INTERIM POVERTY REDUCTION
STRATEGY PAPER
ARMENIA SOCIAL TRENDS “04
This issue of “Armenia Social Trends” is devoted to the International Day for the Eradication of
Poverty, which is celebrated around the world on 24 October.
The level of human development in any country is measured by the prosperity of its regional
towns and the well-being of the residents who live there. Our aim in this special bulletin is to
analyse the socio-economic conditions in small and medium-sized centres and to draw attention
to the urgent need for regional programmes aimed at helping the country’s poorest people.
The United Nations Development Programme (UNDP) gives high priority to comprehensive
monitoring of poverty and inequality and their underlying causes. To ensure that the factors
af-fecting human poverty are analysed in a thorough and appropriate fashion, the “Armenia Social
Trends” bulletin is based on assessments undertaken at the community level by mayors and later
synthesised by Monitoring and Analysis Units in each marzpetaran. This makes the material
particularly valuable since it represents the shared evaluations of two Government branches,
lo-cal self-governing bodies and regional Governments.
UNDP is ready to support the efforts of the Government of Armenia to implement targeted
programmes aimed at revitalising regional towns. We are committed to working in partnership
with municipalities, the private sector and civil society organisations to help vulnerable and
dis-advantaged residents.
We are proud that UNDP is one of the first organisations to offer its technical assistance to all
marz capitals and we look forward to extending this cooperation, as part of our on-going efforts
to reduce poverty and ensure growth with equity, to regional towns throughout the country.
Lise Grande
UN Resident Coordinator
UNDP Resident Representative
SMALL AND MEDIUM SIZED TOWNS IN THE REGIONS OF RA
• Small and medium sized towns of Armenia within the context of PRSP• Specifics of poverty factors and human development in Armenia’s small and medium sized towns (based on the results of “National Human Development Survey”)
Community survey of small and medium towns of RA • ARAGATZOTN MARZ • ARARAT MARZ • ARMAVIR MARZ • GEGHARKUNIK MARZ • LORI MARZ • KOTAYK MARZ • SHIRAK MARZ • SYUNIK MARZ
• VAYOTS DZOR MARZ • TAVUSH MARZ
• Problems of small and medium sized towns from the viewpoint of their prominent residents • Urban communities need more autonomy
• Rehabilitation of abandoned villages as a poverty reduction measure AS WITNESSED BY JOURNALISTS
• The town, where people live • The forgotten town
• Give us back our status • ANNEX (PDF)
Small and medium sized towns of Armenia within the context of PRSP
Astghik Mirzakhanyan“Creation of a Social Monitoring and Analysis (M&A) System” Project Coordinator
The selection of the theme for the fourth issue of “Armenia Social Trends” bulletin is not occa-sional. The results of poverty surveys regularly conducted by the National Statistical Service reveal that the urban population, with the exception of Yerevan residents, is the poorest in Armenia. Accord-ing to data from 2001, 19.6 percent of Armenia’s urban population is very poor, while the national indicator is 16 percent, Yerevan 16.8 percent, and rural areas 11.3 percent. Incomes are more unequal in towns other than Yerevan; the Gini coefficient for income concentration is 0.477 compared to 0.458 in Yerevan1.
Poverty reduction processes have progressed to varying degrees in Yerevan and other towns and villages of the country, and as a result there are some specific variations in social trends in small and medium sized towns. Thus, the overall poverty in towns has reduced almost twice slower than in Yer-evan. In 1998-2001, poverty reduced by 15.3 percent in the capital city, compared to the 8.1 percent reduction in towns (including Yuri and Vanadzor). It must be noted that a reverse trend was recorded in income inequality in the same period; in towns with higher levels of income inequality the reduc-tion was 1.5 times more rapid, than in Yerevan, this, however, was a result of reduced incomes and not vice versa.
This conclusion is supported by the comparative analysis of income trends in Yerevan and other towns. Per capita incomes of the poorer Yerevan residents from salaried employment increased by 1.9 times in 1998-2001, while salaries of the poor in other towns actually decreased by 1-2 percent. The same trend is recorded for incomes from employment; the per capita incomes of the self-employed poor residents in Yerevan have doubled, while the incomes of the self-self-employed in towns reduced by one-fifth2.
Thus, residents in country’s small and medium sized towns are obviously more threatened by poverty than the population in the capital city. This “threat” is a result of significant inequalities be-tween Yerevan and other towns in socio-economic development, livelihoods of residents, labor mar-ket tensions, income and human poverty. Unfortunately, the threat is not subsiding. This is confirmed by the results of the National Human Development Survey (NHDS) conducted in all 11 marzes of Armenia, including Yerevan, in spring 2001. The comparative analysis of the key factors of human development and human poverty in Yerevan and Armenia’s small and medium sized towns based on the results of the survey of 6000 households is presented in the article titled “Specificities of poverty factors and human development in Armenia’s small and medium sized towns” authored by UNDP Consultant Nairuhi Jrbashyan. pp. 3 - 8
Within the framework of the joint UNDP and Government of Armenia project “Creation of a So-cial Monitoring and Analysis (M&A) System”, a nationwide survey of small and medium sized towns was conducted in summer 2003 by staffs of central and regional M&A Units in order to determine the root socio-economic causes of the mentioned inequalities. From the total of 48 towns in the country 45 were included in the survey; the exceptions were Yerevan, Gyumri and Vanadzor. The question-naire was developed jointly by the staff of the PRSP Monitoring and Coordination Department of the Ministry of Finance and Economy and UNDP consultants. Survey interviews were conducted directly with town officials. Data on key socio-economic indicators, as well as town officials’ subjective esti-mations of some poverty related phenomena, were collected through the questionnaire. The collected assessments and statistical data were summarized and analyzed for each marz by M&A staffs of marz governments. pp. 9 - 32, 49 - 64
Other than the questionnaire developed for town governments, the staff of the UNDP “Creation of a Social Monitoring and Analysis System” Project and experts of “PASV” NGO developed yet another questionnaire for the survey of authority figures in small and medium sized towns. Interviews based on this questionnaire were conducted with individuals acknowledged by residents as respect-able and/or authoritative figures in the community. Authority figures were selected from 4 areas of activity: science and culture, public-political, business and governance. In total 517 individuals were interviewed and their views on future development of their respective towns and factors constraining that development are presented in the article “Problems of small and medium sized towns from the viewpoint of their prominent residents” authored by Nelson Shahnazaryan and Silva Abelyan. pp. 65 - 68
David Hambartsumyan, Director of the Department of Management of Budgeting Process of the Ministry of Finance and Economy, raises a number of issues and proposes certain solutions for fund-ing of community development programmes in an interview with him entitled “Current issues of public financing of local self governing bodies” . pp. 69 - 71
Numerous problems pointed out by UNDP consultants, M&A staffs, town officials, as well as towns’ authority figures, of course, need to be solved. Some of these solutions have already been planned in the Poverty Reduction Strategy Paper approved by the Government of Armenia and the corresponding Action Plan for 2003-2006. Solutions for some other issues, however, are yet to be clearly defined and developed, and the corresponding recommendations should be thought through and seriously discussed, so that they can be formulated into well-justified projects. Examples of in-teresting recommendations, which are the results of the experience accumulated in public agencies through long time cooperation with their beneficiaries and counterparts, are presented in the article “Rehabilitation of abandoned villages as a poverty reduction factor” authored by Gagik Yeganyan, Director of Migration and Refugees Department of the Government of Armenia and Samvel Harutun-yan Deputy Head of Staff of the same department. pp. 71 - 74
It would have been inappropriate if, within the framework of the study of the problems of small and medium sized towns, we had not referred to the specific and extremely difficult socio-economic conditions of the smallest town in the country, Dastakert (with 264 residents). Thus, we requested Andranik Voskanyan, a professional journalist working with the Analytical-Informational Center for Economic Reforms of the Government of Armenia, to pay a visit to Dastakert town, located in former Sisyan region in Syunik marz, and have interviews with residents. His findings are presented in “Town, where people live” article. pp. 74 - 76
As a result of the new territorial-administrative division adopted in accordance with the corre-sponding Act in 1995-1996, the majority of workers towns, which were fairly widespread in the Sovi-et period, was granted village status, or was totally incorporated into lager neighboring communities. The extreme poverty of residents in former workers towns was pointed out repeatedly already dur-ing discussions organized within the framework of the participatory process for PRSP development. Moreover, according to some civil society organizations, the entire population of workers towns can be classified as very poor, since industrial facilities, around which the towns were originally built, are non-operational long since and agricultural lands, as a rule, are not available in their administrative territories. Journalists Tatevik Nazinyan and Rima Yeganyan have depicted the sad realities in some workers towns. pp. 77 - 80
Data on small and medium sized towns collected from town governments have been summarized and presented in the Inserts of this bulletin. pp. 33 - 48
It must be noted that the responsibility for the reliability of data presented in the Inserts and ma-terials of M&A units of marz governments lies with town governments. At the same time, however, it is important to take into account that authorities in small and medium sized towns govern their communities, in effect, based on these data and assessments, regardless of the level of their accuracy. Hence, the extent to which local self-governing bodies, as represented by mayors of small and me-dium sized towns, are aware of the socio-economic situation in their communities and the problems
of their residents, vulnerable groups in particular, should be a more serious concern than the accuracy of this or that figure.
Since it is precisely the accuracy of this information that predetermines the effectiveness of the governance exercised by mayors, and consequently the extent to which voter expectations are real-ized. And indeed the future well-being of more than one-fifth of country’s population currently living in small and medium sized towns depends on their targeted and realistic policies.
---1 “Poverty Reduction Strategy Paper” (PRSP), Yerevan, 2003, p. 30, Table 2.2. 2 ibid., p. 33, Table 2.4.
Specifics of poverty factors and human development in Armenia’s small and
me-dium sized towns
(based on the results of “National Human Development Survey”)
Nairuhi JrbashyanUNDP Consultant
The “National Human Development/Poverty Survey” (NHDS) was conducted in March-April 2003 within the framework of the UNDP project “Strengthening the Capacity of Social M&A System”. The survey was based on an especially designed rapid monitoring methodology. The sampling included 6000 households from all marzes of the country, ensuring the representativeness of the results at marz level. Along with it, the survey of 170 rural communities and small and medium sized towns of the country (except Yerevan, Gyumri and Vanadzor) was conducted within the framework of the NHDS, where a questionnaire especially designed for heads of communities was used. In effect, the NHDS included two different components, a household survey and a survey of heads of communities.
The results of the household survey of NHDS are currently being processed and are not yet final-ized. Nevertheless, considering the theme of this issue of “Armenia’s social trends” bulletin, namely the problems of small and medium sized towns (referred to as towns throughout the article), we found it appropriate to summarize and present the specifics of social and economic developments in those towns based on the results of the NHDS household survey. The summarization is based on the comparative analysis of poverty factors and manifestations of human development for clusters of surveyed households in small and medium sized towns and in Yerevan.
This is a well-justified approach considering the disparities between Yerevan and other towns in level of poverty and its dynamics over the past six years (1996-2001)1. According to official data,
poverty levels are significantly higher in towns compared to Yerevan, and although over the men-tioned period the relative numbers of the poor have reduced both in Yerevan and in towns, neverthe-less poverty reduction rates in towns are much slower than in Yerevan2. Thus, comparative analysis
of poverty factors and manifestations of human poverty in the two clusters will allow to determine the factors having the largest impact on these distinctly unequal developments.
It must be noted that data relating to all those households in small and medium sized towns, which were included in the sampling cluster of the NHDS (6000 households) were summarized and analyzed. 38 such towns with a total of 1915 surveyed households were included in the NHDS sam-pling. The Yerevan cluster used for comparative analysis included 1000 households. Such numbers of households ensure both the representativeness of each cluster and the reliability of the results of the comparative analysis.
The analysis presented below compares the specifics of poverty risk groups and main poverty factors identified through previous poverty surveys3, as well as specific manifestations of human
de-velopment in small and medium sized towns with the corresponding indicators in Yerevan. Indexes and indictors for the monitoring of the Millennium Development Goals4 form the basis for the set
of indictors used for the comparative analysis. Thus, we have identified mainly those MDG related manifestations of human poverty which better reflect the unequal and disproportionate developments in small and medium sized towns compared to the capital city.
1. Poverty risk groups and factors related to demographic composition and structure of households
poverty, the more members the household has the higher is the risk of poverty. Whereas, children in the family are a significant factor of poverty, and households with large number of children (3 or more) form one of the groups at higher risks of poverty. Analysis of the surveyed clusters shows that the average household in towns is larger than the average household in Yerevan (see Table 1) mainly due to the number of children. The child dependency ratio for towns was 0.31 compared to 0.26 for Yerevan.
Table 1. Main demographic indicators as poverty factors for the surveyed clusters
Compared to Yerevan, there are fewer households with no children (at the lowest risk of poverty) in towns, and on the other hand the share of households with 3 or more children (at the highest risk of poverty) is about 1.5 times more (see Figure 1). Considering that one additional child in the family reduces its living standard by 3.7 percent6, we can conclude that households in towns, due to their
demographic composition, are at a higher risk of poverty compared to households in Yerevan. 2. Representation of the unemployed, as a high poverty risk group, in the surveyed clusters Poverty surveys in Armenia show a close link between poverty and unemployment. Initial com-parisons based on NHDS data reveals that the share of real unemployed among the active working age population (ages 15-64) in towns is somewhat higher than the same indicator in Yerevan (cor-respondingly 24.4 percent and 23.8 percent7). Whereas the age-sex composition of the unemployed
is almost identical; in both clusters more than half of them are up to 35 years of age and around 54 percent are women. However, when we calculate (data and calculation methodology presented in Ta-ble 2) the real unemployment rate, disproportions become more illustrious. The real unemployment rate is very high in both clusters, but nevertheless it is 1.1 times higher in towns compared to Yerevan, correspondingly 37.6 percent and 35.7 percent8.
The official unemployment rates in both clusters are 3-3.5 times lower than the real rates; while again the rate is higher in towns already by 1.2 times, correspondingly 12.1 percent and 9.9 percent.
Thus, unemployment remains to be one of the most serious problems in towns as well as Yerevan; the problem, however, is more serious in towns according to both the official and real unemployment rates.
Table 2. Employment and unemployment among active working age population (15-64)
1 not willing to take up employment.
2 calculated as share of people aged 15-64 who did not have an income generating job, were willing to work, were ready to take up employment immediately and were actively searching for jobs at the time of the interview and within the preceding week.
3 employed, studying and unemployed.
4 calculated as share of the unemployed in the employed, studying and unemployed working age population.
5 Millennium Development Goal 8 “Establishment of global partnership for development”, indicator for objective 16. Calculated using the same method applied to the previous one.
6 calculated as share of the officially registered unemployed in the employed and officially unemployed working age population.
Interestingly, the unemployment rate in the age group of 15-24, which is one of the MDG indica-tors, is notably high in both clusters, while it is somewhat higher in towns at 42.2 percent.
It must be noted that the inequalities in indicators of the labor market would have been wider, if the population in the surveyed towns did not have the possibility to conduct agricultural activities. According to data from NHDS, around 30 percent of households in the surveyed small and medium sized towns have agricultural lands, where around 10 percent of the economically active population is employed. Of course, this significantly reduces the disproportions between labor markets in Yerevan and towns.
It is notable that large differences in the duration of real unemployment are recorded; the average duration of unemployment in towns in about 1.7 times longer than in Yerevan (see Table 2). This shows that a resident in towns left out of the labor market is threatened with long term unemployment, loss of professional skills and qualifications and the subsequent hopelessness.
This significant difference is conditioned by much more limited possibilities in towns for creating new jobs. The internal migration of the labor force is also limited due to numerous factors. First, the unemployed from towns are of the opinion that it is almost hopeless to seek jobs outside their commu-nities, namely in Yerevan with higher rates of economic development. The analysis of the means that the unemployed in towns use for finding jobs shows that only 4 percent use the press and other mass media (which, by the way, mainly reflect job positions available in Yerevan). This can be compared to Yerevan, where around 25 percent of the unemployed try to find jobs through the mass media.
Second, as the comparative analysis of the education levels of the unemployed reveals, Yerevan has a larger supply of qualified free work force compared to towns. The share of unemployed with higher education is about 2 times larger in Yerevan compared to towns (see Figure 2).
And generally, Yerevan has 50.2 percent of the total number of unemployed with some specializa-tion, i.e. secondary vocational or higher educaspecializa-tion, compared to 41.9 percent in towns. Considering also the longer duration of unemployment in towns and almost total absence of opportunities for re-qualification, it becomes clear why the migration of the surplus work force in towns is mainly toward the nearby villages basically for construction or agricultural jobs (see articles on marzes in this bul-letin).
Thus, the situation of economic activity and real unemployment is serious in both clusters, but it is nevertheless somewhat more serious in towns.
The most notable disproportion identified is the longer duration of unemployment in towns, which tends to turn into stagnated unemployment.
3. Representation of the hired employees with low salaries, as a high poverty risk group, in the surveyed clusters
According to poverty surveys conducted in the country, employment is not yet a guarantee for avoiding poverty; around 45 percent of the employed are poor.
These are mainly employees of budgetary organizations, who are employed in education, culture, science and arts sectors and receive average salaries significantly lower than the national average. Thus, this group of the employed is also a high poverty risk group.
According to NHDS data, around 25 percent of the working age employed population in both clus-ters are salaried employees. More than half of them, both in Yerevan and in towns, work in budgetary organizations. 48.2 percent of salaried employees in towns receive average monthly salaries lower than the general poverty line; including 15.1 percent receiving salaries lower than the poverty food line9 (see Figure 3).
In the absence of other employment or source of income, such salaried employees cannot take care of even their own needs, not mentioning their possible dependents.
The share of salaried employees receiving salaries lower than the general poverty line is 1.7 times, and those with salaries lower than the poverty food line 2.1 times larger in towns, compared to Yer-evan.
Thus, salaried employees in towns are at a higher risk of poverty compared to those in Yerevan, due to their higher representation in low salary sectors and lower salary levels.
4. Specifics of the manifestation of a number of human poverty indicators in Yerevan and small and medium sized towns
As already mentioned, the human development concept is at the basis of the NHDS. According to this concept, poverty is a wider phenomenon and encompasses more than the low level of material well-being. It defines poverty as limitation of possibilities for human development and fulfilling of basic human needs, using the term human poverty. Human poverty is the absence of opportunities (in physical and material terms) for satisfying the fundamental needs necessary for a decent living. The most important characteristics of human poverty are lack of access or limited access to education, healthcare and drinking water, social isolation and exclusion, lack of a permanent dwelling or its un-favorable conditions, etc. The most unequal manifestations of the main indicators of human poverty in Yerevan and small and medium sized towns are presented below.
4.1. Access to the Education and Healthcare Systems
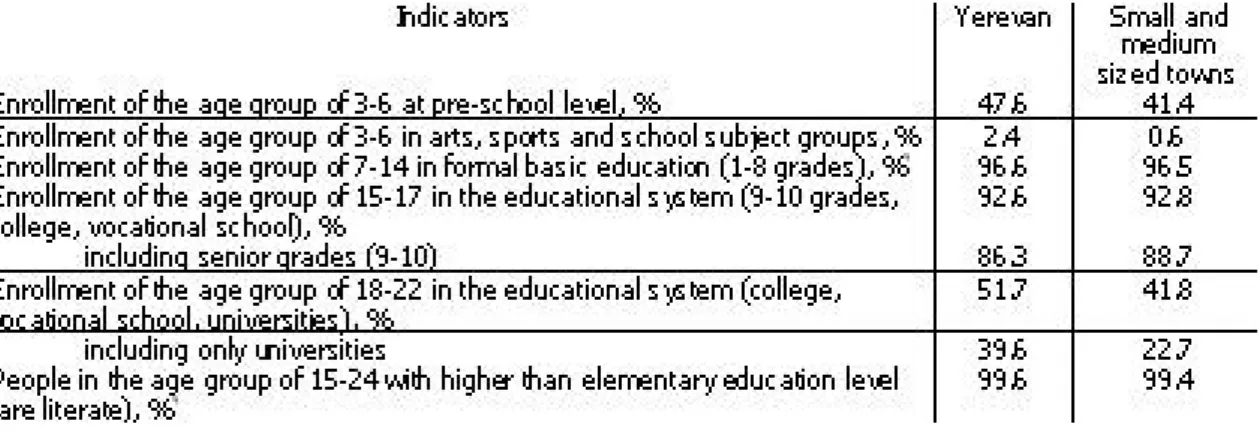
According to NHDS data (see Table 3), the most notable disproportions between Yerevan and towns related to access to the educational system are:
a) indicators of enrollment of the age group of 3-6 in the pre-school educational system; the indica-tor is 1.2 times smaller in towns. The enrollment of children of the same age group in arts, sports, and school subject groups is even more unequal; it is 4 times lower in towns.
b) indicators of enrollment of the age group of 18-22 in the tertiary education (college, vocational school, university); the indicator is 1.2 times smaller in towns.
c) indictors of enrollment of the age group of 18-22 in universities; it is 1.7 times smaller in towns.
Table 3. Enrollment in the educational system, including the educational indicators of MDG in Yerevan and small and medium sized towns
These disproportions are related to more limited access to these educational services in towns compared to Yerevan, and also longer travel distances for using those services.
The MDG indicators for universal enrollment in primary and secondary educational system, as well as literacy rate in the age group of 15-24 (Goal 2, indicators 6, 8), as well as indicators for gender equality in the educational system (Goal 3, indicators 9 and 10) have already been achieved in both clusters10.
The most notable difference between health indicators of the clusters was recorded in the share of disabled children in the total number of children (see Table 4). Disabled children are 2.8 times more in towns compared to Yerevan. Although morbidity indicators are identical in towns and in Yerevan, but the frequency of visits paid to doctors, especially in case of children, is lower in towns compared to Yerevan. Whereas, the main reason mentioned by 92 percent of households for not seeking doctor’s help when they needed medical assistance was that they could not afford to pay for the services.
The most notable difference between Yerevan and towns was recorded for the share of up to one year of age mortality in the total number of births within the last 3 years, which is one of the most im-portant human poverty indicators. As presented in Table 4, the mentioned indicator is 5 times higher in towns compared to Yerevan.
Table 4. Healthcare indicators, including those of the MDG in Yerevan and towns
* Characterizing Millennium Development Goal 4 related to infant mortality and Goal 5 related to maternal mortal-ity.
4.2. Access to drinking water, dwelling and facilities
Access to safe drinking water is one of the main components of human poverty included in the list of MDG indicators. Thus, it would be interesting to compare access to safe drinking water for households in Yerevan and towns.
The majority of the surveyed households (around 95 percent) in both clusters receive drinking wa-ter from municipal wawa-ter supply networks, either inside their apartment or in the yard of their house. And this is logical since the urban population has had access to municipal water supply infrastructures already from Soviet times. The issue here is the operational conditions of these infrastructures and the extent to which they are able to ensure access to drinking water. Despite the existing water supply network, the main sources of drinking water for 7.2 percent of households in towns (their share in Yerevan is 0.3 percent) are water taps far from the house, water brought by tankers or wells, which are not very safe sources of drinking water (see Figure 4).
On the other hand, the share of those having water every day is 1.2 times smaller in towns com-pared to Yerevan, correspondingly 73 percent and 84 percent of the surveyed households.
With regard to dwellings, the majority of the surveyed households live in their private apartments and houses. However, the number of households living in dormitories or temporary dwellings (cot-tage, wagons, basements, garages) is 5 times higher compared to Yerevan (0.4 percent in Yerevan and 2 percent in towns). This disproportion is possibly explained by the fact that a number of towns have refugee residents and are in the area struck by the earthquake in 1988.
There are some inequalities related to another indicator as well. The average per capita living space for households living in apartment buildings in towns is 0.5 sq m. less compared to Yerevan (compare 12.5 sq m to 13 sq m). In addition, dwellings in towns are in much poorer conditions. Dwellings of the surveyed households in Yerevan underwent repair and maintenance works correspondingly 15 and 9 years ago, while the same indicators for towns are 20 and 11 years. Possibly this is the reason that 32.1 percent of households in towns have evaluated the conditions of their dwelling poor or very poor (compared to 25.4 percent in Yerevan).
4.3. Access to telecommunications and information
Indicators of access to telecommunications and information characterize one of the most important aspects of human poverty, namely participation in social life. The NHDS has provided the possibility
for calculating a number of interesting indicators in this regard, some of which are among the MDG indicators. The comparison between Yerevan and towns (see Table 5) shows that residents in towns are more isolated compared to Yerevan residents. The largest gap, to the disadvantage of residents in towns, was recorded in the number of households using computers, cellular phones and the internet.
Thus, the comparative analysis presented in this article reveals that, in general, there are significant disproportions in main indicators of human development and poverty factors between residents in small and medium sized towns and Yerevan. Consequently around 30 percent of country’s population living in small and medium sized towns is at higher risk of poverty and there is a need for including measures for reducing these disparities in regional poverty reduction programs.
Table 5. Access of households to telecommunications and information
---1 See “Poverty Reduction Strategy Paper”, Yerevan-2003, page 30, Table 2.2.”Poverty in ---1998/99 and 200---1”
2 According to the results of “Living standard surveys” conducted by the National Statistical Service, 55.2 percent of Yerevan residents and 61.7 percent of residents in other towns were poor in 1999. In 2001, poverty levels in these clusters were correspondingly 46.7 percent and 56.7 percent. See “Poverty Reduction Strategy Paper”, Yerevan-2003, page 30, Table 2.2.”Poverty in 1998/99 and 2001”
3 See “Social Snapshot and Poverty in Armenia”, NSS 1998, 2001, 2002.
4 In September 2000, 189 countries, including Armenia, adopted the Millennium Declaration and the Millennium De-velopment Goals. See “Human DeDe-velopment Report 2003.Millennium DeDe-velopment Goals: A compact among nations to end human povert”, United Nations Development Programme, New York , 2003
5 The ratio of children aged 0-14 to the working age population (aged 15-64), i.e. number of children per one working age person.
6 See “Social Snapshot and Poverty in Armenia”, NSS, Yerevan 2001.
7 According to the results of the survey of labor force in urban areas of Armenia conducted by NSS in 2001 using the same methodology 24 percent of people in this age group were unemployed. See “Labor Force in the Urban Settle-ments of RA”. Report, NSS, 2003. http://www.armstat.am/Publications/2003/Ashxatuj-02-ang-het
8 According to the results of the survey of labor force in urban areas of Armenia conducted by NSS in 2001, the unem-ployment rate was 42.7 percent. See “Labor Force in the Urban Settlements of RA”. Report, NSS, 2003. http://www. armstat.am/Publications/2003/Ashxatuj-02-ang-het
9 According to the results of the last “Integrated living standard survey”, the general poverty line was determined at AMD12,273 and the poverty food line 7,525. See “Social Snapshot and Poverty in Armenia”, NSS 2001.
10 See Human Development Report 2003. Millennium Development Goals: A compact among nations to end human poverty, United Nations Development Programme, New York , 2003
11 It must be noted that the represetativeness of women in their fertile age who had childbirth within the last three years is fairly small.
Community survey of small and medium towns of RA
ARAGATZOTN MARZDiana Pogossyan
Aragatzotn marzpetaran’s Monitoring and Analysis Specialist Tel. 0-32/3-55-59
Three towns, Ashtarak, Aparan and Talin, were included in the survey of urban communities of Aragatzotn marz. All three towns are former regional centers. Ashtarak is the marz capital from 1995. The administrative territory of Ashtarak includes also Mughni village.
Specifics of employment among marz‘s urban population
Aragatzotn is one of the smallest marzes in Armenia. Its population constitutes only 4.3 percent of country’s total population (according to 2001 census), and the majority of its population, or 76.3 percent, live in rural areas. The marz produces only 1 percent of the national GDP. Agriculture, espe-cially livestock production, is the predominant economic sector in the Marz. This fact also determines the direction of development in marz’s towns. All three surveyed communities have large areas of ag-ricultural lands, a significant part of which is the private property of towns’ residents (see Table 1).
Table 1. Data on agricultural lands in towns of Aragatzotn marz, according to town govern-ments, 2002
Working on private agricultural land has become the main economic activity for the majority of residents in Ashtarak, Aparan and Talin. Around 2/3 of residents are involved in agricultural activi-ties, whereas Ashtarak has the smallest share of such residents estimated by town authorities at 60 percent, and Talin has the largest share at 80 percent.
The composition of economy, and consequently job distribution by sectors, used to be somewhat different in marz’s towns. Ashtarak in particular, where 1700 people were annually employed in the industrial sector in 1988-1990, has changed significantly. However, all these facilities together have just 268 employees. Thus, the number of industrial jobs decreased by 6 times during the transition pe-riod, amounting to less than 10 percent of the total number of job positions (in 2002 according to town officials). The situation is the same in other two cities of the marz as well, although changes were not as radical in Aparan and Talin, since they have always had the informal status of “village town”.
Aparan
• “Nig” equipment parts production • “Arev” factory
• Branch of Yerevan “Haygorg” group • Cheese factory • Bread factory Talin • Cheese factory • Bread factory • Asphalt factory
• Small factory of Swiss gold watches • “Shant” dairy factory
• “Diamontec” diamond processing factory1
Interesting changes in the composition of economy have taken place in Talin. “Diamontec” dia-mond processing factory, which has around 500 employees, is the largest employer among the men-tioned enterprises. In effect, the absolute number of emloyees in the industrial sector in Talin with only 5000 residents is the largest in the marz (see Table 2).
Table 2. Data on operational industrial facilities in towns of Aragatzotn marz and number of their employees, according to town authorities, 2002
At the same time, as presented in Table 1, 94 percent of households in Talin have agricultural land, or 1.2ha per household. As a result, the mayor estimates the share of agricultural employment at around 80 percent.
Considering the employment situation in marz’s small and medium sized towns presented above, unemployment rate estimations made by mayors seem to be somewhat unusual} The official unem-ployment rate, according to regional emunem-ployment services, is very low and does not exceed 2 percent in all 3 towns, while mayors estimate the unemployment rate at 80-90 percent (see Figure 1). Town officials justified the 45 times “deviation” of their estimations from official figures based on the fol-lowing arguments:
a) not all households owning land are involved in agricultural activities;
b) privatized land is not irrigated due to lack of irrigation water and pipeline worn out condition; c) residents, who used to have jobs in other sectors cannot reconcile with the thought of “being employed in the agricultural sector”;
d) incomes from employment, that is salaries and agricultural incomes, are too low and conse-quently people do not consider themselves as fully employed;
e) some employees working in towns’ enterprises, in particular “Diamontec” in Talin, are from neighboring villages;
f) employment services do not register town residents with private land as unemployed, even if the land is not cultivated.
These arguments explain why ”unemployment” was the unanimous response of all the mayors to the question “What causes poverty in your town?”.
Issues of drinking water and better access to quality healthcare services were also mentioned. Economic and social infrastructures of towns
Urban streets in all three towns are in poor conditions, since there has been no construction or re-pair work for a long time. Patching street pavements allows for a more or less normal vehicle traffic. Thus, town officials are of the opinion that roads should be brought to normal conditions. The only constraint is financing, since road construction projects are costly, and town governments do not have the necessary funds.
Large scale housing construction has not taken place in the last ten years. The only notable project was the repair of dormitory No. 25 in Ashtarak, which was implemented in 2002 jointly by Aragat-zotn marz government and the UNHCR. The 48 renovated apartments were distributed to 10 local and 38 refugee families as their private property.
Roofs, drinking water networks and sewerage systems in almost all apartment buildings need to be repaired and renovated.
A local heating system was successfully tested in one of Aparan’s apartment buildings in 2002. It is planned to install such systems in other apartment buildings of the town this year. In all three towns, water supply is scheduled, and water is provided for 2-4 hours per day.
Town authorities are not satisfied with the conditions of the telephone network and quality of tel-ephone connections.
Other means of communication, the press for example, are available to marz’s urban population al-most every day. The geographical specifics of towns limit the possibilities for watching TV programs; residents can only “catch”, and not all the time at that, 4-7 TV channels. Ashtarak town tries to solve the problem through paid cable network services, but the number of subscribers is still very limited.
Poverty assessments and means for its eradication
According to assessments by town officials, 10 percent of the urban population in Aragatzotn marz is very poor. At the same time, Ashtarak and Talin authorities estimate their non-poor population at 30 percent, while according to Aparan town officials the town has 3 percent very poor residents.
In addition to material poverty, town official attach importance to moral poverty as well, which is a result of cultural isolation and social vulnerability of people in the marz.
The following programs were recommended by mayors for solving the existing problems and re-ducing poverty in Aragatzotn marz:
job creation;
- re-operation and refurbishing of former factories; - improvement of drinking water supply;
- establishing markets for agricultural goods;
- ensuring markets for processing and sales of agricultural products.
The mentioned programs are yet to be developed and included on the list of officially planned projects, while the ones below have already been included in three-year community development plans:
- installation of local heating systems;
- repair of drinking water supply and irrigation networks; - improving municipal services to apartment buildings; - repair of sections of rural roads;
- city planning
- improving education and cultural life.
Here is some brief information on marz’s towns. ASHTARAK
Ashtarak is situated at 1175m above sea level, on Kasakh river, 20km north-east of Yerevan, at the intersection of Yerevan-Gyumri and Yerevan-Spitak roads. It is the marz capital from 1995.
The radio-physics and electronics research institute of the National Academy of Sciences is in Ashtarak. The town has inherited a developed social infrastructures network from the former Soviet system: 5 secondary schools, 1 boarding school, 1 special school, 3 kindergartens, as well as music, arts and sports schools, one private university, sports stadium, library, culture club, teachers club, numerous museums and scientific centers.
APARAN
Aparan (called Bash-Aparan until 1935) is the second largest town of Aragatzotn marz by popula-tion. It is situated at 2010m above sea level. It was redesigned in 1967. The housing stock includes 1513 single-family houses, as well as 27 apartment buildings. Houses are mostly built using local tuff.
Main ethnic groups in the town are Armenians and Yezdis. Residents are mainly involved in livestock production and farming. A large number of people leave for seasonal work outside community.
Aparan is famous for its tasty drinking water, which comes from Yeznak spring.
The social infrastructure in Aparan consists of the following facilities: 3 secondary schools, 1 college, 1 music school, 2 kindergartens, sports, arts center, culture club, folk theater, one library, telephone switching center, hospital, polyclinic, a number of drugstores.
TALIN
Residents in Talin are mainly the decedents of Armenians from Kars, Nakhijevan, Bayazet, Alashk-ert, Sasun and Mush regions of Greater Hayk, who immigrated in 1828-1830.
The town has two secondary, one sports and one music school, crafts center, culture club, national heritage museum, hospital, drugstore, as well as 3 kindergartens sponsored by the Armenian Apos-tolic and Armenian Adventist churches, etc.
---1 It must be noted that the “Diamontech” company cares for the education and improvement of technical skills of its em-ployees. Around 500 people are currently participating in training courses in order to work in the new positions soon to be opened in the company. The overall number of employees will soon reach 1000. The factory supports town’s teachers by providing AMD5000 per month to each teacher.
ARARAT MARZ Shoghik Arustamyan
Ararat marzpetaran’s Monitoring and Analysis Specialist Tel: /0-35/ 2-10-64
This survey revealed the specifics of socio-economic and human developments in 4 small and medium sized towns of Ararat marz. The overall picture emerging from the survey shows that a seg-ment of marz’s urban population do not participate in human developseg-ment processes because of their poverty. Previous surveys identified the vulnerable groups of population, which are more prone to poverty in general and human poverty in particular.
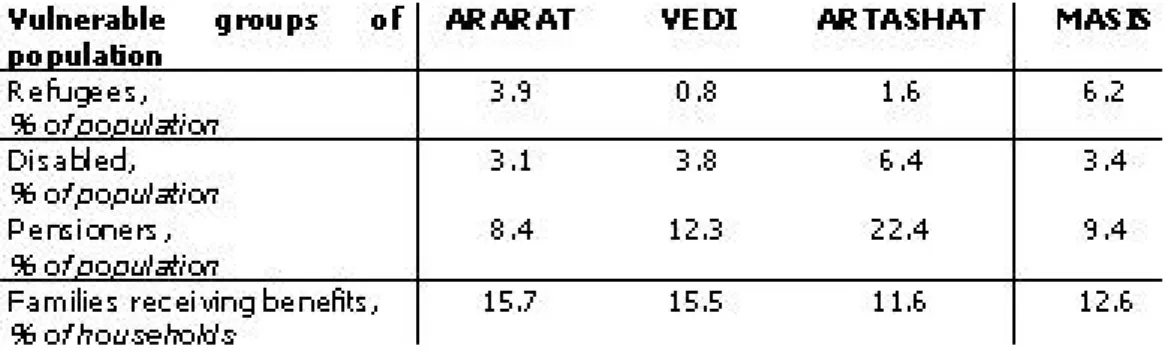
Thus, information on the representation of vulnerable groups in towns of Ararat marz, is a good measure of the level of poverty risk marz’s urban populations face (see Table 1).
Table 1. Representation of vulnerable groups among the urban population of Ararat marz by towns
As presented, the most important problem for Artashat town is its large share of pensioners (22.4 percent), for Masis the relatively large share of refugees (6.2 percent), for Ararat and Vedi the large share of families receiving benefits (15.5-15.7 percent).
Demographic indicators are as follows: In 2002, the highest natural growth rate was recorded in Ararat town at 27.6 per thousand residents, which is 2-3 times higher than the rate in other 3 towns of the marz. The largest number of marriages was recorded in Artashat at 12.1 per one thousand resi-dents, and Vedi has the lowest divorce rate ate 0.2 per one thousand residents.
Employment is a serious problem in all towns of the marz. First, there is a very low level of non-farm activities, which is particularly important for the urban population. Among marz’s towns only in Ararat the number of people employed in industry exceeds those working in other sectors; 43.4 percent of all the employed according to town authorities. In the other three towns the employed are mainly concentrated in the agricultural sector, where their share is 65-81 percent (see Figure 1).
Employment data should be considered carefully, especially for a marz like Ararat, where settle-ments are mainly in Ararat valley.
First, a large number of urban households in the marz have private land plots, and consequently are involved in agricultural activities. At the same time, however, some of them also work in industries, construction or services. There are also people who work in a number of sectors at the same time.
This is a problem for statistical data collection, since it is not clear under which sector these people ought to be registered as employed.
Second, who should be considered employed (or not unemployed); can a person with non-agricul-tural higher education, who is unemployed but has land, be considered unemployed? Or, how do we evaluate town’s level of employment? By the number of workplaces, or by the actual place of resi-dence of those employed in workplaces? For example, half of the staff of marz government located in Artashat is from out of town. And finally, in Ararat valley people are employed in the agricultural sector for only 5-6 months of the year, and in the remaining months these so called “employed” peo-ple have nothing to do and do not have any incomes.
Of course, in current difficult socio-economic conditions in small and medium sized towns it is still very important to provide land to the urban population, however agriculture cannot be considered a promising sector for their future prosperity.
While today, in some cases, there are more agricultural lands within the administrative territories of towns than in some villages, and the share of urban households with private land reaches 42-43 percent, see Table 2.
Table 2. Share of households with agricultural land in marz‘s towns
Thus the reason behind the majority of the employed, or 84-89 percent, being in the private sector is that they cultivate their own private land.
Nevertheless, in some former industrial towns, especially Ararat and Artashat, there is a high rate of unemployment at 16.4 and 10.7 percent correspondingly. The rate is higher in Ararat since it has almost no agricultural land.
Table 3. Unemployment rate in towns of Ararat marz, 2002
This large 3 to 10 times’ difference between assessments of the unemployment rate have their own logical explanation: the real unemployed do not register at regional employment services (although these are accessible in all towns), since:
• monthly unemployment benefits are very small, not more than US$5;
• even when it is granted (and it is granted only to 10-15 percent of applicants), it is not for a long period, i.e. a maximum of 6 months;
• there is little hope for finding employment.
The only advantage of registering as unemployed is that it increases the possibility of inclusion in the family benefit system, but nevertheless if other conditions are already met this unemployment status does not increase chances much.
Infrastructures contributing the most to the development of towns are roads and communications. Roads in marz’s towns are in more or less good conditions, with the exception of the 0.5km roads linking towns to central highways. All towns have public transportation to and from the capital city costing AMD150-350. All towns (except Ararat) have taxis with a AMD500 per km fee.
All towns have telephone lines. Local and long-distance telephone communications are of average quality.
One of the specifics of poverty in Armenia is that the poor should have at least a shelter, be it permanent or temporary. Data on housing stocks and numbers of households in marz’s towns are presented in Table 4.
Table 4. Housing stock in Ararat marz
Numbers of families living under temporary shelter are not considerable in neither of the towns. Whereas, in Artashat and Masis, due to emigration, numbers of dwellings exceed those of the house-holds, while there are dwellings in Vedi with more than one family (which, by the way, is a very common practice in the country); A number of families being close relatives live under one shelter: parents with their children, brothers and sisters each with their families, etc.). This means that the number of dwellings is not necessarily identical with the number of households.
renovated since. A majority of households, more than 80 percent, are connected to water supply and sewerage networks, and gas is currently supplied only to single-family houses. The harsh winter in 2002 damaged water supply and sewerage systems in residential apartment buildings; in almost all buildings sewage water spills out into basements. The average price of apartments in marz’s towns does not exceed US$100 per sq m.
Water is supplied to towns for on average 1.5 to 4 hours per day. The fact that artesian water is supplied to apartment buildings in Artashat and Masis is enough to turn drinking water into an urgent problem for marz’s towns.
The effectiveness of secondary school education is determined, among others, by the share of students continuing their studies in universities. In this regard, as presented in Figure 2, the situation is better in Artashat and Vedi, where 37-38 percent of school graduates continued their studies in uni-versities. The lowest effectiveness was recorded in Ararat schools at only 8 percent.
Another important indicator, especially from the viewpoint of the optimization of the educational system and transferring financial management of secondary school education to communities, is ex-penditures from town’s budget per student in 2002. Exex-penditures on the school system are 1.5 to 3 times higher in Masis and Ararat towns than in Vedi and Artashat; correspondingly AMD12600, 8500, 7000 and 4200 annually. The last two towns, however, have higher rates of university admis-sions than the first two (see Figure 2).
In recent years, television has become the main source of information. Towns (except Artashat) do not have local newspapers, radio lines, local TV stations. Both marz and national newspapers are nevertheless available in towns.
According to estimations made by local authorities, the highest poverty rate at 96 percent (includ-ing 30 percent very poor) was recorded in Artashat, and the lowest rate at 65 percent (includ(includ-ing 10 percent very poor) in Masis (see Figure 3). Such spread of poverty in Artashat, which is the marz capital and where at least 1/3 of the residents have 4,000 sq m of land on average, is somewhat pe-culiar. In our opinion, criteria for well-being and poverty in Artashat are very different from those in other towns of the marz.
Figure 3. Evaluations of poverty levels in towns of Ararat marz estimated by town officials, %
ARARAT
The town was established in 1950s around a cement factory. Has an altitude of 840m above sea level, is 45km far from Yerevan and 22km far from marz capital. More than 40 percent of all the em-ployed work in cement and gold factories.
Ararat has serious environmental problems. The cement factory operates without filters, for which it is constantly fined. But the factory prefers to pay penalties instead of installing expensive filters. Waste from the gold factory, cyanide in particular, spills out and contaminates the environment, espe-cially pastures, causing damages to livestock production. At least this is how town residents explain the rise in meat prices.
Supply of drinking and irrigation water is of utmost importance for the town; water pipelines are worn out, and one of the two pumps is not operational.
“Mission Armenia” NGO provides free meals to 100 elderly five times a week in a facility renovat-ed by funding from the local government. Member of the NGO also take care of 102 disablrenovat-ed elderly, providing constant medical supervision at home and free medicine, as well as ensuring their hygiene by bathing them, doing their laundry and ironing, cleaning the house and doing the shopping.
VEDI
The majority of residents live in single-family houses. Agriculture is the main employment area with more than 80 percent of the employed. Households having land plots complain that because of mistakes in land inventories they have to pay higher taxes for land plots larger than the ones they actually have. Only 14 percent of the employed work in the public sector.
Roads connecting Vedi town to marz capital (48km) and Yerevan (19km) are in good conditions. The necessary funds for renovating urban streets were allocated this summer. The re-operation of electrical devices factory and establishment of a processing factory for travertine limestone can have a significant impact on job creation.
Two out of three drinking water reservoirs of the town are operational. The drinking water is of low quality. Other than two public agencies providing social services, the local Red Cross has started its active involvement led by Doctor Zemphira Malkhasyan. By the sponsorship of “Vedi Alco” com-pany, the Red Cross feeds the single elderly one day a week and they can spend their free time in the
hall provided by town government throughout the year.
The existence of “Vedi Alco” company and the numerous social programs implemented by its management (director Manvel Ghazaryan) have their undeniable role in preventing emigration from the town, and contribute to the maintaining of more or less adequate social structures. “Mission Ar-menia” NGO too provides free social services to refugees and other vulnerable groups.
ARTASHAT
A large number of Artashat town residents have emigrated to other places in Armenia, or other countries. In addition, the majority of these emigrants were working age residents. The most unfa-vorable impact of this emigration is the disruption of the sex-age composition, which is primarily reflected in the large share of pensioners among residents at 22.4 percent. This means, that almost every fourth resident is of economically non-active age. We will have a better understanding of the level of social tension in the town if we also consider the unemployment rate among working age residents, which is 10.7 percent according to the regional employment service and around 60 percent according to town authorities.
The social tension is diminished due to a number of important factors. First, 31 percent of house-holds in Artashat have received agricultural land, and as a result more than 70 percent of the employed work in the agricultural sector. Second, marz branches of central governmental agencies, as well as the marz government offices are located in Artashat as the capital city of the marz, which ensures jobs in the public sector for 11 percent of the employed. Seasonal industrial jobs are available mainly by the canned food factory.
Targeted social programs are implemented for non-working age, disabled and single elderly in-cluded on the beneficiary list of “Mission Armenia” NGO. Soup kitchens, free healthcare services, especially organized cultural events, etc. are available to them in both Ararat and Artashat.
One of the most serious problems in the municipality is the high level of ground waters swamp-ing houses. The sewerage is in poor conditions; its pipelines have not been cleaned since 1970s and are overstuffed with sludge. As a result, sewage water in 126 apartment buildings spills out into the basement. And 10 percent of single-family houses are not even connected to the sewerage system. 98 percent of households are connected to the water supply network, but the system, nevertheless, is in very poor conditions. The town does not have a septic plant. 14 wells providing water for apartment buildings are collapsing gradually. Supply of both artesian and drinking water is the number one problem in Artashat.
The second important issue is the poor conditions of the 70 km long urban streets, which were as-phalted for the last time in 1968. It is already a long time that garbage is not removed from the town; residents dump their garbage in an open filed at a 2km distance from their houses.
MASIS
The town is distinguished by the large number of refugees (6.2 percent of residents) and the large share of absent population (20 percent). Only 15.5km of the total 40.8km of urban streets are as-phalted. Roofs, as well as water supply and sewerage systems in all 88 residential apartment buildings need repairs.
Formerly being an important railroad station, Masis was famous for its large storage facilities, which are now empty. Re-opening of the railroad will result in re-operation of these facilities and will create new jobs, which is very important for residents who are mainly unemployed or have seasonal agricultural jobs.
According to the Ministry of Health, there is a malaria risk in Masis, and cases of malaria surface once in a while. Due to supply of artesian drinking water cases of dysentery and poisoning are
fre-ARMAVIR MARZ Hermine Hovhanissyan
Armavir marzpetaran’s Monitoring and Analysis Specialist Tel. (0-37) 6-31-48
All three urban communities of Armavir marz, that is Armavir, Vagharshapat and Metzamor, were studied within the framework of the survey of small and medium sized towns in the country. The analysis presented summarizes data obtained during the survey, which were mainly collected by a special questionnaire completed by town authorities.
Various projects relating to re-operation of production facilities, drinking water supply, gas sup-ply, basic education, preschool education, healthcare and other areas, which have a direct impact on population’s living standard, have been implemented in marz’s towns by active participation of inter-national, inter-national, marz and local organizations over the last five years.
Unlike rural communities, which were studied through a similar survey conducted in the fall 2002 (see “Armenia Social Trends” 3rd issue, December 2002), the three surveyed urban communities of the marz had three-year development programs (2003-2005); and the data included in these programs served as one of the main sources of information for completing the questionnaires.
It must be noted that data on indicators obtained from town authorities might be different form data provided by other agencies officially in charge of tracking those indicators. However, the data provided below is the very information used by town officials for making decisions on development priorities for towns.
Armavir – (formerly Hoktemberyan) marz capital was established on June 26, 1931. Is 48km far from Yerevan and has an altitude of 880m above sea level. The majority of residents are ethnic Ar-menians. Despite being the marz capital, it has only marz’s second largest population and number of households after Vagharshapat (see Table 1).
With regard to demographic indicators, the town is notable for its large share of households receiv-ing benefits at 14.1 percent, which is 1.5-2.5 times more than in Vagharshapat and Metzamor.
Table 1. Some demographic indicators of towns in Armavir marz
Armavir residents live mainly in single-family houses; the housing stock includes 142 apartment buildings and 5979 single-family houses (see Table 2). 35 percent of apartment buildings were built 21 to 50 years ago, 58 percent were built 20 years ago, and the remaining 7 percent were built in recent years. Taking into account the “average age” of apartment buildings at 21.8 years, it is only natural that 122 buildings, or 86 percent, need repairs, and 12 buildings are actually unsafe. Accord-ing to data from home sale transactions, the price of 1 sq m of livAccord-ing area in the town in the last month amounted to US$61.
Table 2. Residential buildings and municipal services in towns of Armavir marz 2002
There are no registered condominiums in the town.
Currently, 92 percent of town’s households are connected to water supply and sewerage networks. Almost none of marz’s communities, however, have operational central heating systems any more.
Extension of central gas supply systems is welcomed warmly by the population; currently around 50 percent of households have access to natural gas supply systems. The process continues. 65 per-cent of households are connected to the telephone network, but both local and long distance connec-tions are of poor quality.
The official unemployment figures for the town are presented in Table 3.
Table 3. The unemployed registered at Armavir town’s employment service
In effect, the majority of the unemployed registered at Armavir town’s employment services in 2001 and 2002 were women, mainly with secondary education. The growing number of the unem-ployed with higher education, more than half of whom are women, is a cause for concern.
It must be noted however that women find jobs through employment services more often than men. In 2002, 59 unemployed women and 48 unemployed men found jobs, form whom 57 women and 14 men through Armavir town’s employment services. Nevertheless, the figures presented show the limited possibilities of employment services in finding jobs for the unemployed.
The “benefit for work” program, which is implemented by including the unemployed registered at employment services, has a significant role in creating temporary employment.
According to Armavir town’s employment services the unemployment rate in 2002 was 5 percent, while the mayor estimated the real unemployment rate at 40 percent (see Figure 1); according to the mayor this is the result of very few available jobs for town’s unemployed.
Figure 1. Unemployment rate in marz’s towns 2002, %
Because of the very few available jobs, the unemployed in Armavir town, in order to provide mini-mum subsistence for their families, often take up seasonal work in villages of the marz or small land plots (on average 0.09ha) within the town, where they grow food for their families. But this does not satisfy their needs, and in addition it is not even considered as a form of employment (see Table 4).
Table 4. Distribution of the employed in town’s of Armavir marz by economic sectors (according to town authorities), %
In 2003, one of the forgotten sectors, namely public transportation, was revived in Armavir town. Minibus lines (AMD50 per passenger) and taxis (AMD100 per 1km) are operational again. Urban streets are 86km long, including 78km paved with average quality asphalt. The road connecting the regional capital to Yerevan is 48km long, and is relatively in much better conditions. There are four departures every hour from Armavir town to Yerevan.
The town has all the necessary social infrastructures; there are 8 post offices, 12 kindergartens (administered by town government), 10 formal basic education schools, a number of music and sports schools. In the previous academic year (2001-2002), 171 graduates out of a total number of 533 (or 32 percent) were admitted to various universities of the country. It must be noted that all formal basic education schools have their own computer classrooms.
The central marz hospital is in Armavir, there are also 3 polyclinics, 15 drugstores, 5 private dentist clinics. With regard to the public sector, a local employment and social services center operates in Armavir town as well.
The private sector is represented by 3 branches of Yerevan banks, 2 credit institutions, 2 internet service providers, tens of recreational facilities (cafes, restaurants, sports facilities, etc.) The fact that Armavir is the marz capital plays a decisive role in the availability of infrastructures, since almost all communities in the marz use these institutions.
Armavir residents have access to daily national press. In addition, a regional newspaper called “Hayrenakanch” is published once a month (there are no town newspapers). Town residents have the possibility to watch more than 20 TV channels.
Town authorities mention unemployment as the main factor causing poverty. Thus, according to town officials, only job creation (or re-opening existing workplaces which are currently idle), and
preferably in the industry sector, would mitigate town’s poverty problems, improving the tense so-cio-economic and moral-psychological environment. The town government is ready to participate in programs for poverty reduction.
According to Armavir’s three-year development program (2003-2005), the three main directions for development are:
• urban development and city planning; • land-development;
• ensuring continuous operation of pre-school institutions; • renovation of cultural facilities.
Allocations from the community budget have already been made for the mentioned purposes. Vagharshapat – (former Ejmiatzin) is the spiritual capital of the country and the largest town of the marz. Vagharshapat, with its ancient and rich history, is 30km far from the marz capital, and at a 20km distance from the capital city. 9.9 percent of households, are included in the family benefit system. Vagharshapat has the highest share of the disabled and pensioners among urban communities of the marz, correspondingly 3.9 and 17.1 percent.
According to regional employment services, town’s unemployment rate in 2002 amounted to only 2.2 percent (which is the lowest in the country). The share of women among the unemployed is also very low at 37.2 percent. 20 people, including 12 women, found jobs through the employment serv-ices in the last year.
According to data from Vagharshapat town government, 53 percent of the employed are women. Only 10 percent of the employed work in the public sector. The main areas of employment are church services and processing of agricultural products, which provide jobs for around 80 percent of the employed (see Table 4).
Agricultural land area within the administrative territory of the town is the largest, compared to the other 2 towns (see Figure 2). However, only 21.7 percent of households in Vagharshapat have private land, whereas, such households in Armavir constitute 55.4 percent. Compared to Armavir, residents in Vagharshapat, with a less tense labor market, have more job opportunities in sectors other than agriculture.
Figure 2. Agricultural land in town’s of Armavir marz
16 factories and production lines provide industrial jobs in the town. Services sector is represented by 302 shops, 29 drugstores and 9 libraries. There are 53 restaurants and other recreational facilities, and 5 facilities belonging to the Armenian Apostolic Church, the largest of which is the cathedral of the Holy See of the Armenian Church.
Urban streets are 90km long, 75km of which has an asphalt pavement of average quality. Public transportation linking the town with marz capital has 3 departures per hour, while there are 4 depar-tures to the capital city per hour, and the fee is the same for both at AMD250. The town has public buses, minibuses and taxis, with the same fees as in Armavir.
Ejmiadzin residents also live in single-family houses (see Table 2). Many of the town’s apartment buildings need roof repairs, elevators in 2 buildings are not operational, and nearly all of them need entrance repairs and yard refurbishment. Since Ejmiadzin is near the capital city, it has the highest price per sq m of living area among marz’s towns at US$120.
Unlike other towns of the marz, there are 7 registered condominiums in Vagharshapat, at least 3 of which are operational.
As a former regional capital, this town has various social and recreational infrastructures. There are 11 formal basic education schools with 8157 students and 727 teachers (86 percent with higher education). More than 1000 children attend 10 kindergartens. In 2001-2002, 42 percent of the 797 school graduates were admitted to universities. There are numerous, cafes, bars and other recreational facilities in the town.
The priorities stated in the three-year development program, according to Vagharshapat town gov-ernment, are development of tourism, processing of agricultural products, development of grape and fruit production and expansion of canning industry based on the latter. At the same time, it must be mentioned that town’s budget is too limited for the implementation of the mentioned programs; more than half of the budget (56 percent) is formed by subsidies of around AMD247 million.
Metzamor – the town was established in 1969, as a temporary settlement for builders of the nucle-ar power station. It was granted workers settlement status in 1972, and town status in 1992. Metzamor is 8km to the north-east of marz capital Armavir and 40km far from the capital city. The network of urban streets is 7km long, and all streets are asphalted.
According to employment services, the unemployment rate in Metzamor in 2002 was 4.2 percent, and there were 850 registered unemployed as of January 1, 67 percent of whom were women.
The majority of residents live in apartment buildings, and 46 families live in cottages with back-yards. Construction activities started in Metzamor in 1970, and the majority of buildings, or 61 per-cent, are 21-30 year-old. Today, these apartment buildings have numerous problems related to roof repairs (38 percent of buildings), absence of sewerage or its poor conditions (28 percent), poor con-ditions in basements, etc. The absence of a sewerage and wastewater treatment plant creates serious problems, such as the stink in town’s air.
As a young town, built in accordance with typical soviet city design, Metzamor has had all the nec-essary social infrastructures from the beginning. It has 3 secondary schools, 3 kindergartens, music and sports schools. The healthcare sector is represented by a hospital with120 beds and operations, pediatrics, general medicine, infectious diseases and obstetrics departments, a polyclinic, 2 drug-stores and a number of private dentists. The telephone station with automatic exchange equipment and 4000 lines started operation in 1980. There are 2 post offices in Metzamor. Around 50 percent of families have phone connection.
The town has libraries, numerous recreational facilities, internet connection and a church.
The Armenian Nuclear Power Plant plays a large role in ensuring employment for Metzamor resi-dents. Currently, around 62 percent of the 1659 employees of the power plant are from Metzamor. And thus, 60 percent of employment in the town is in the public sector.
The town of energy specialists prioritizes gas supply, repair of roofs and basements and general city planning in its three-year development program.
The distribution of Vagharshapat residents by living standard, according to estimations of town authorities, is as follows: non-poor 10 percent, poor 70 percent and very poor 20 percent. Again em-ployment has been mentioned as the main factor causing poverty in the town; according to the mayor the actual unemployment rate is around 30 percent. Job creation, financial investments in various economic sectors, active involvement of the Church and development of tourism were mentioned as the most effective measures for combating poverty.
Development of tourism, processing of agricultural products, development of grape and fruit pro-duction and expansion of canning industry based on the latter are included in the three-year develop-ment program as the most important measures. It must be develop-mentioned, however, that town’s budget is very limited for the implementation of the mentioned measures; currently more than half of the budget (56 percent) comes from subsidies amounting to AMD247 million.
Town’s authority figures underline a number of important measures, which will contribute to pov-erty reduction. Such as introduction of cheap energy sources, repair of power plant infrastructures, use of local high quality labor force in these activities, creation of an industrial complex, stabilization of town’s moral-political atmosphere, etc.
The mentioned measures are common for the three towns of the marz and even for other towns of the country. We really hope that the necessity of implementing the PRSP will transform the well-known motto “Our town is our home” into a common mentality and approach. According to marz’s mayors, levels of poverty in towns are as follows: