SHADOWSENSE
PERFORMANCE
I. DOCUMENT REVISION HISTORY
Revision Date Author Comments
1.1 Now\19\2015 John La Re‐formatted for release
1.0
Objective
The purpose of this experiment is to measure and evaluate the latency between a touch event and the USB output of the ShadowSense frame. Various positions inside the active touch area will be tested to further understand the distribution of latency across the frame as well as to calculate an average latency for the entire frame.
1.1
Equipment
The equipment used during the entire test: Baanto ShadowSense touch frame with firmware version 7.41 Baanto Dashboard software Piezo Buzzer Element (35 mm diameter) Four Channel Tektronix Oscilloscope E550 Lenovo ThinkPad laptop
1.2
Setup
The Baanto ShadowSense frame was assembled and connected to the PC through a USB connection and powered with a 12V power supply. Dashboard was launched to ensure that the frame being tested was operating properly. The configuration parameters in Dashboard were first reset to the default settings. The LED views were examined next to confirm there was no abnormal behavior with the system. This was followed by some basic drawing tests to confirm the system performance. Channel 1 of the oscilloscope was then connected to the piezo buzzer element, channel 2 was connected to a debug pin on the frame to capture USB interrupts sent to the PC, and channel 4 was connected to a debug pin on the frame to capture the start of each LED polling cycle. This setup is shown in Figure 1.
Figure 1: Test setup
The piezo buzzer element was then placed in the active touch area with its leads running underneath the frame to ensure the wires did not trigger a touch event while the test was being performed. To further ensure no unexpected touches occurred due to the wires from the buzzer, the frame was propped up using small cut outs so there was no chance of interference with the optical plane. CH1 CH2 CH3
Oscilloscope
2.0
Method
Once the frame was connected and the performance was validated the latency testing could begin. The time between when a touch event occurs and when the ShadowSense frame sends the USB packet to the host PC is the latency being investigated. A piezo buzzer element was used to sense when the touch event had occurred because with piezoelectric materials, when a force is applied to them, the charge that can be stored in the material varies proportionally to the force being applied. The force being applied in this scenario is the touch down of a finger or other touch object. This change can easily be observed and measured using the oscilloscope. The resulting touch information is sent to the PC through the USB HID interface connection which can also be seen and measured with the oscilloscope. The desired latency value under investigation is the time difference between these two signals. The piezo buzzer element was placed in eight separate locations during testing. The test points included some that were very close to the edge of the frame and others that were closer to the center of the touch frame. The test locations were the four corners of the frame, starting with the corner where the USB and power connections are made (see Figure 2) and points about 8 inches towards the center of the frame. In each of the test locations, 5 tests were ran, with the latency between the touch event and the USB packet being sent, measured and recorded each time. This allowed for investigation regarding the distribution of latency across the entire frame. It was expected that the latency would be the worst in test location 1 and would improve at the succeeding test locations. This is mainly due to the architecture of the ShadowSense frame as well as how it operates. The frame utilizes IR LEDs and sensors to detect touch. There are LEDs located along both sides as well as the bottom and are positioned to face inward. The ShadowSense frame strobes each LED individually in sequence starting in the corner where the first test position is located. Since test location 1 is at the beginning of the strobing sequence, it must wait a minimum of an entire cycle before the data is processed.
When the latency testing started it was discovered that if the touch probe, which was initially a finger, moved too slowly it resulted in much more error and latency being introduced into the systems because the IR plane would be interrupted and the touch event would be detected before the piezo buzzer was touched. Once this was discovered the method of applying a touch for the testing had to be modified to accommodate for this added latency. The solution that was decided on was to use a ball of butyl and drop it from a height of approximately 1 m in an effort to eliminate this error. Dropping the ball of butyl from this height resulted in the butyl having a velocity when breaking the optical plane of about 9.81 m/s. This velocity was quick enough that the time difference between when the butyl broke the optical plane and when it hit the piezoelectric sensor was negligible.
2.1
Results
The results of the testing can be seen in Table 1 at the end of this document. It is evident from the data that the latency can vary even when touch events occur in the same location. The latency also varies as the touch location moves to different sections around the touch area. ShadowSense touch technology works by polling the LEDs sequentially and collecting the resulting touch data. The onboard microcontroller then processes the data and sends it to the PC via a USB HID interface. Due to the process of collecting the touch data, the latency depends on the polling period of the particular frame being investigated. The polling period is defined as the time between successive USB packets being sent or the time between the same LED being strobed twice. For the most accurate polling period it is best to measure the time for multiple cycles and find the average. As can be seen in the figure below, there are 5 cycles that take 54.3 ms to complete. This results in a polling period of approximately 10.86 ms.
Figure 3: Frame time for SDW656
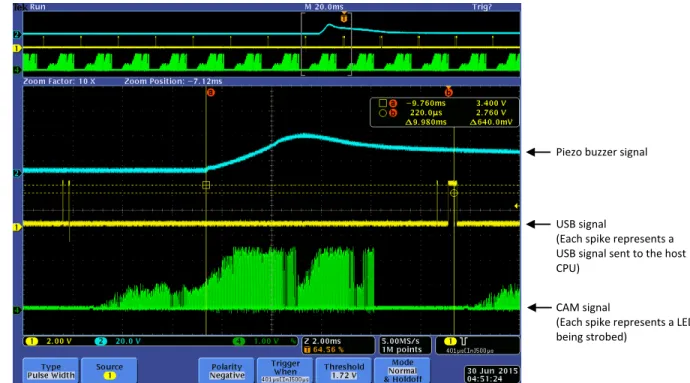
The minimum system latency occurs when the touch event is registered and the master controller sends Piezo buzzer signal
USB signal
(Each spike represents a
USB signal sent to the host
CPU)
CAM signal
(Each spike represents the
start of another LED polling
Figure 4: Best case scenario where the touch event (blue signal) is recognized and processed in the same frame (green signal)
the USB packet with the touch data is sent (yellow signal)
Figure 5: Worst case scenario where the touch event (blue signal) occurs in one frame (green signal) but the data is not
processed and sent (yellow signal) until the following frame
Piezo buzzer signal
USB signal
(Each spike represents a
USB signal sent to the host
CPU)
CAM signal
(Each spike represents a LED
being strobed)
Piezo buzzer signal
USB signal
(Each spike represents a
USB signal sent to the host
CPU)
CAM signal
(Each spike represents a LED
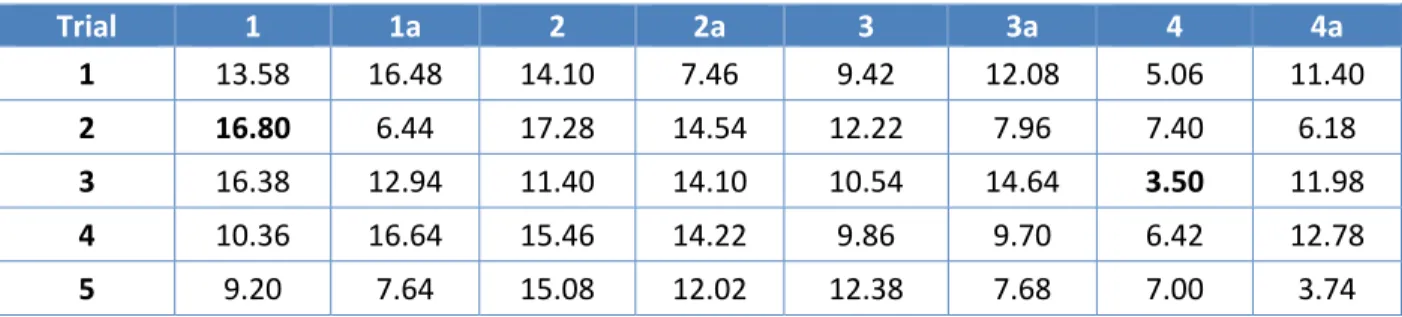
As can be seen in Table 1 below, the fastest response time recorded during the testing process was 3.5 ms and the slowest response was 16.8 ms. This results in a median of 10.15 ms, meaning the user can expect the system latency to be approximately 10.15 ms on average.
Table 1: SDW656 latency results (in milliseconds)
Trial 1 1a 2 2a 3 3a 4 4a 1 13.58 16.48 14.10 7.46 9.42 12.08 5.06 11.40 2 16.80 6.44 17.28 14.54 12.22 7.96 7.40 6.18 3 16.38 12.94 11.40 14.10 10.54 14.64 3.50 11.98 4 10.36 16.64 15.46 14.22 9.86 9.70 6.42 12.78 5 9.20 7.64 15.08 12.02 12.38 7.68 7.00 3.74 The ShadowSense touch frame’s latency is directly proportional to the size of the frame. As shown in Table 2 below, the latency increases slightly as the frame size increases. The latency value being presented represents the time between a touch event occurring and when the resulting touch data is sent to the host PC via USB. The touch technology is not the only source of latency in a touch solution. There will be additional latency from the time it takes the host PC to process the USB interrupt. The display will also contribute to the system latency as a result of certain functions such as scaling, de‐ interlacing, scan rate conversion and motion compensation. It is important to be aware of these additional sources of latency when comparing various solutions with each other.
Table 2: All other SKU sizes with average latency
SKU Median Latency (ms)
SDW319 6.02 SDW403 7.06 SDW424 7.28 SDW464 7.81 SDW487 8.09 SDW550 8.87