Reinvigorating Right to Buy and One for One
Replacement
Reinvigorating Right to Buy and One for One
Replacement
Impact Assessment
March 2012
Department for Communities and Local Government
© Crown copyright, 2012
Copyright in the typographical arrangement rests with the Crown.
You may re-use this information (not including logos) free of charge in any format or medium, under the terms of the Open Government Licence. To view this licence, visit
http://www.nationalarchives.gov.uk/doc/open-government-licence/ or write to the Information Policy Team, The National Archives, Kew, London TW9 4DU, or e-mail: [email protected].
This document/publication is also available on our website at www.communities.gov.uk Any enquiries regarding this document/publication should be sent to us at:
Department for Communities and Local Government Eland House Bressenden Place London SW1E 5DU Telephone: 030 3444 0000 March 2012 ISBN: 978-1-4098-3370-3
Title:
INCREASE RIGHT TO BUY (RTB) DISCOUNTS AND INTRODUCE ONE FOR ONE REPLACEMENT OF
ASSOCIATED SALES WITH AFFORDABLE RENTED HOMES
IA No: Unallocated
Lead department or agency:
Department for Communities and Local Government
Other departments or agencies:
Homes and Communities Agency
Impact Assessment (IA)
Date: 07/03/2012Stage: Final Stage
Source of intervention: Domestic
Type of measure: Secondary legislation
Contact for enquiries: Chris Walker 030 344 42287
Summary: Intervention and Options
RPC Opinion:
Not required.
Cost of Preferred (or more likely) OptionTotal Net Present Value
Business Net Present Value
Net cost to business per year (EANCBon 2009 prices)
In scope of One-In, One-Out?
Measure qualifies as
£1,504m to £2,212m Minimal Minimal Yes NA
What is the problem under consideration? Why is government intervention necessary?
Right to Buy sales have been in long term decline and minimal in most recent years. A more generous discount will allow a greater number of social tenants to take up their Right to Buy and meet their home ownership aspirations, support social mobility and will help create and sustain mixed communities. Housing need remains high and building replacement homes for affordable rent will help us to meet this need. Housing construction output and jobs have suffered during the recession with construction amongst the hardest hit sectors, accounting for a fifth of the 7.1% decline in GDP from peak to trough. So the
replacement programme will help to support the sector and contribute to economic growth.
What are the policy objectives and the intended effects?
Reinvigorating Right to Buy is intended to boost home ownership for social tenants. This will support social mobility policy objectives and help aspiration - around 80% of people aspire to homeownership. One for one replacement of additional sales with affordable rented units will prevent Right to Buy sales depleting the affordable housing stock and will ensure our ability to meet housing need is not impaired. It has been estimated that there are around 1.9 million households in housing need in England.
Using the Right to Buy sale receipts to invest in house building will also stimulate construction activity and support the economic recovery without the need to increase central Government borrowing.
What policy options have been considered, including any alternatives to regulation? Please justify preferred option (further details in Evidence Base)
A number of Right to Buy policy options have been considered with an average discount of up to half the value of the property. The key tradeoffs are (i) boosting Right to Buy take-up and (ii) raising sufficient revenue per sale to be able to fund the replacement with an affordable rented unit and achieving value for money. The cash cap is important in this equation but is also designed to prevent excessive windfalls to social tenants whilst ensuring a generous offer.
For one for one replacement, the options essentially revolve around delivery and include: local delivery where receipts are left with the council for reinvestment locally; national delivery where receipts are
allocated through a national programme administered by the Homes and Communities Agency (in London, this role would be undertaken by the Mayor); or a combined approach
The chosen approach is option 2 (existing discount ranges with £75k cash cap) with a combined delivery model.
Will the policy be reviewed? It will be reviewed. If applicable, set review date: Month/2015 Does implementation go beyond minimum EU requirements? N/A
Are any of these organisations in scope? If Micros not exempted set out reason in Evidence Base.
Micro No < 20 No Small Yes Medium Yes Large Yes What is the CO2 equivalent change in greenhouse gas emissions?
(Million tonnes CO2 equivalent)
Traded:
Unknown
Non-traded:
Summary: Analysis & Evidence
Policy Option 2
Description: Increased Right to Buy Discounts and one for one replacement of associated sales with affordable rent homes. Chosen policy option: POLICY OPTION 2: Maintain existing Right to Buy discount ranges with £75,000 cash cap.
FULL ECONOMIC ASSESSMENT
Net Benefit (Present Value (PV)) (£m)* Price Base Year 2011 PV Base Year 2011 Time Period
Years 30 Low: +£1,504m High: +£2,212m Best Estimate: +£1,805m
COSTS (£m)
Total Transition(Constant Price) Years
Average Annual
(excl. Transition) (Constant Price)
Total Cost
(Present Value)
Low High
Best Estimate NIL NIL NIL
Description and scale of key monetised costs by ‘main affected groups’
None.
Other key non-monetised costs by ‘main affected groups’
**Transfer costs (£120k per Right to Buy unit and £156k to £161k per replacement unit) are as follows.
For local authorities and Registered Social Landlords: the lost rental income (due to losing a social unit as a result of Right to Buy purchase); the costs associated with replacement affordable rent unit in terms of maintenance, repairs, debt servicing, and other resource provision. For HM Treasury: the increase in housing benefit payments associated with the Right to Buy sale (losing a social housing unit)
BENEFITS (£m)
Total Transition(Constant Price) Years
Average Annual
(excl. Transition) (Constant Price)
Total Benefit*
(Present Value)
Low £1,504m
High £2,212m
Best Estimate £1,805m
Description and scale of key monetised benefits by ‘main affected groups’
The social benefit associated with improving household consumption of low income households (£1,804m for additional units over the Spending Review or £56,000 per unit - both Right to Buy unit and replacement unit combined).
The economic benefit of increasing housing supply (£328m for units over the Spending Review or £18,000 per unit). The economic benefit of increased construction activity, in terms of jobs and output, associated with replacement affordable rent units (£393m for additional units over Spending Review or £23,000k per unit).
Other key non-monetised benefits by ‘main affected groups’
**Transfer benefits (£146k per Right to Buy unit and £138k per replacement unit) are as follows.
For local authorities and Registered Social Landlords: the savings associated with repair, management and debt servicing interest payments by selling a Right to Buy home, and the benefit of rental income from replacement affordable rent homes. For local authorities/HM Treasury: the Right to Buy sales receipt (hypothecated to one-for-one replacement funding and local authority / Registered Social Landlords debt compensation). For HM Treasury: Housing Benefit savings associated with Right to Buy unit and replacement affordable rent unit.
Key assumptions/sensitivities/risks Discount rate (%) 3.5%
*Economic and social benefits above are presented for additional Right to Buy sales (and the associated replacement units) which occur over the remainder of the Spending Review period only (2012/13-2014/15). This is not a reflection of the policy being time limited.
**The costs and benefits incurred by Government, local authorities and Registered Social Landlords have been presented in Net Present Value (NPV) terms per unit in the non-monetised section above, but these are excluded from the economic appraisal given that they represent transfers rather than net economic impacts.
BUSINESS ASSESSMENT (Option 1)
Contents
1 CONTEXT
The Government’s proposals on Right to Buy and replacement, current Right to Buy policy, application of policy to housing association sector, delivery models for replacement.
2 PROBLEM UNDER CONSIDERATION
Right to Buy – long term decline and Government’s commitment to reinvigorate the policy
Replacement – meeting need and weak economic growth 3 RATIONALE FOR INTERVENTION
Right to Buy – affordability
One for one replacement – meeting need, limiting Housing Benefit costs, supporting economic growth
4 POLICY OBJECTIVE AND OPTIONS CONSIDERED
Helping more people to realise their aspiration of home ownership through reinvigorating Right to Buy and using receipts to fund replacement homes for affordable rent. Different discount and cap options.
5 OPTION APPRAISAL AND METHODOLOGY
Take up – description of model estimating take up under different average discount rates, assumptions made, limitations of the model
Cost benefit analysis – social and economic impacts
Value (net present value) to the Government – basis of cost benefit analysis, assumptions and limitations
6a RIGHT TO BUY OPTIONS
Option 1: Maintain existing discount ranges with £50,000 cash cap Option 2: Maintain existing discount ranges with £75,000 cash cap Option 3: 40% Headline Right to Buy discount and no cash cap Option 4: 50% Headline Right to Buy discount and £75,000 cap Option 5: 50% Headline Right to Buy discount and no cash cap Burdens on Local Authorities
6b ONE FOR ONE REPLACEMENT OPTIONS
Models for delivering replacements - local, national, combined
Funding the replacement units - from borrowing, provider contributions, receipts and other funding
Value (net present value) to the Government and providers – basis of cost benefit analysis and conclusions
7 PRESERVED RIGHT TO BUY IN THE HOUSING ASSOCIATION SECTOR Tenants benefiting – secure tenants who have transferred with their homes Allocation of receipts – shares retained by associations and paid to transfer councils
Arrangements for replacement – options to incentivise replacement Management costs – meeting administration and transaction costs Burdens on Housing Associations – costs of administration
8 ECONOMIC AND SOCIAL IMPACTS
Distributional benefit – basis of analysis and conclusion
Economic benefits (replacement) – additional housing supply and jobs
9 IMPACT ON HOUSING BENEFIT – basis of analysis and conclusions. 10 SUMMARY AND IMPLEMENTATION PLAN
SECTION 1: CONTEXT
1. To help more people realise their aspiration of home ownership, and to increase investment in further affordable housing, the Government intends to raise Right to Buy discounts to make them attractive to tenants across England. It is committed to replacing every additional home sold under the Right to Buy with a new home for affordable rent.
2. Under the Right to Buy legislation, council tenants (and tenants of housing associations who transferred from council landlords) have the right to buy their home at a discount1. The policy has been a great success – since its introduction in 1980, almost 2 million households have exercised this right and can enjoy the benefits of homeownership including greater independence, security of owning a valuable asset and the right to change their home as they wish. “The Right to Buy was one of the most successful housing policies… because the policy enabled many households to become owner-occupiers who would not otherwise have been able to do so… It has been a positive influence in maintaining mixed communities in spatial terms. It has also provided a cheaper access point into owner-occupation for lower income employed households helping to sustain mixed communities as these properties are transferred into the market2.”
3. However, the previous Government reduced discounts and the take-up of right to buy has fallen to an all time low. Indeed, warning was given that cuts to the discount rate would affect take up: “The data suggests that those affected by the ceiling were somewhat more likely to withdraw from purchase. They were also more likely to face questions about the affordability of their purchase. Withdrawal was associated with the need to make larger average payments. These effects appear to be becoming more pronounced with time3.”
1
Right to Buy is available to secure tenants of local authorities and non-charitable housing associations. Assured tenants of housing associations who were secure tenants and have been transferred with their homes as part of a stock transfer from a local authority to a housing association also have the Right to Buy - this is known as Preserved Right to Buy. Broadly the same terms apply to both schemes.
2
ODPM, Lessons from the past, challenges for the future for housing policy, January 2005
3
4. As a result of these changes, the average Right to Buy discount, as a percentage of the sale price, has fallen significantly over the last 10 years; from a national average of 50% in 1998/99 to just 25% in 2010/114. In London, the fall has been even more pronounced with the average discount falling from 53% in 1998/99 to 13% in 2010/115.
5. The Government is now determined to reverse this decline and reinvigorate the policy to give a new generation the opportunity of homeownership. It has said that it will increase discounts to affordable levels and money from extra sales will be invested in paying down the existing housing debt and building new housing for affordable rent.
4
DCLG live table 643.
Evidence Box: The Right to Buy over time
• On introduction in 1980, the discount was 33-50% (depending on length of tenancy) capped at £25,000.
• In 1984 the Government introduced the ’cost floor rule’ for homes which had been built or renovated since March 1984 where more than £5,000 had been spent on the property. The 'cost floor rule' provides that the discount cannot reduce the purchase price below a certain level. The discount range also changed to 32-60%.
• In 1987, the cap was increased to £35,000, and a higher discount of 44-70% was established for flats. The date for the cost floor was also changed from March 1984 to March 1974
• In 1989, the cap increased from £35,000 to £50,000 and the cost floor rule changed to include buying the property and the effective time became eight years.
• In 1999, the Government reduced the maximum discount, by introducing regional caps - from £22,000 in the North East to £38,000 in London. The effective time for the cost floor was also changed to 10 years.
• In 2003, the maximum discount was cut to just £16,000 in 41 local authority areas in London and the South East.
• The Housing Act 2004 then increased the qualification period for Right to Buy from two years to five years of tenancy (this had the effect of changing the discount range for houses from 35-60% and 50-70% for flats, both subject to cash caps) for those taking up a tenancy from 2005 onwards.
Figure 1: Right to Buy and Preserved Right to Buy sales 1980/81 to 2010/11 RTB & PRTB sales 1980/81 to 2010/11 0 20,000 40,000 60,000 80,000 100,000 120,000 140,000 160,000 180,000 1980/ 81 1981/ 82 1982/ 83 1983/ 84 1984/ 85 1985/ 86 1986/ 87 1987/ 88 1988/ 89 1989/ 90 1990/ 91 1991/ 92 1992/ 93 1993/ 94 1994/ 95 1995/ 96 1996/ 97 1997/ 98 1998/ 99 1999/ 00 2000/ 01 2001/ 02 2002/ 03 2003/ 04 2004/ 05 2005/ 06 2006/ 07 2007/ 08 2008/ 09 2009/ 10 2010/ 11 R T B & PR TB s a le s RTB & PRTB sales
6. Currently, to qualify for Right to Buy or Preserved Right to Buy, tenants must have spent five years as public sector tenants. Once eligible, current discount rates are:
• for houses: 35 per cent of the property’s value plus 1 per cent for each year beyond the qualifying period up to a maximum of 60 per cent
• for flats: 50 per cent plus 2 per cent for each year beyond the qualifying period up to a maximum of 70 per cent
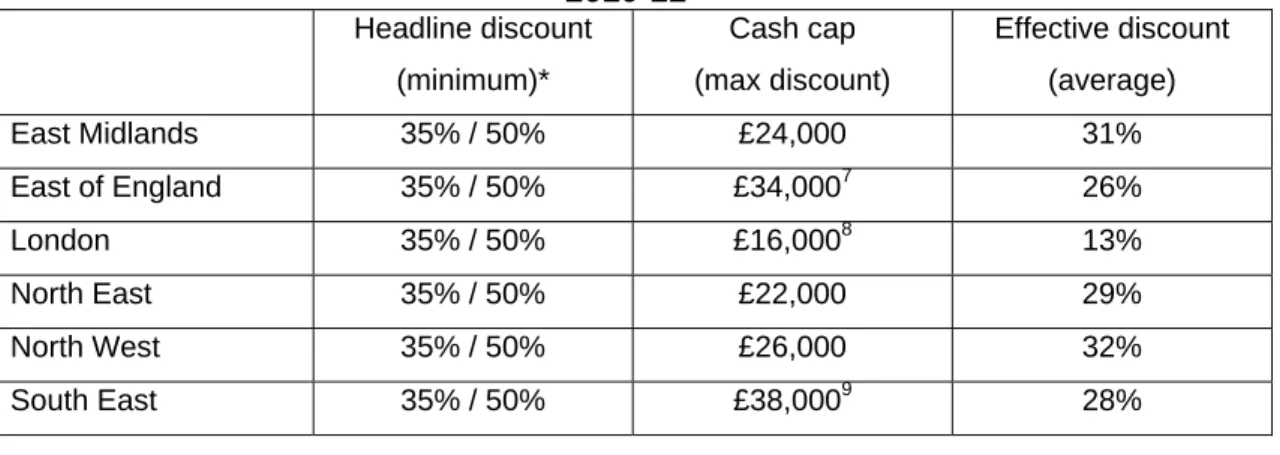
7. In practice, most Right to Buy discounts are limited by caps set in secondary legislation. These currently range from £16,000 in most of London to £38,000 in the South East. The effect of the caps is that the average discount rate received by buyers in England is around 25 per cent - ranging from 13 per cent in London to 32 per cent in the North West. Table 1 illustrates this point:
Table 1: Current Right to Buy policy, cash caps and effective discount rates,
2010-116 Headline discount (minimum)* Cash cap (max discount) Effective discount (average) East Midlands 35% / 50% £24,000 31% East of England 35% / 50% £34,0007 26% London 35% / 50% £16,0008 13% North East 35% / 50% £22,000 29% North West 35% / 50% £26,000 32% South East 35% / 50% £38,0009 28% 6 DCLG live table 643. 7
Except Watford, where the maximum discount is £16,000
8
Except Barking and Dagenham or Havering, where the maximum discount is £38,000
9
Except Chiltern, Epsom and Ewell, Hart, Oxford, Reading, Reigate and Banstead, Tonbridge and Malling, Vale of the White Horse, and West Berkshire where the discount is £16,000
South West 35% / 50% £30,000 25%
West Midlands 35% / 50% £26,000 30%
YorkshireHumber 35% / 50% £24,000 30%
*houses / flats
8. The simplest and most immediate way of improving the Right to Buy offer is to raise caps from their current low levels. As an illustration, Table 2 below shows the impact of both raising the cash cap to £75,000 and imposing a ‘headline’ or fixed discount rate of 50% (the lower of which will bind), on the effective discount rate for the average property in each region. But there is a balance to be made between offering generous discounts on the one hand, and value for money to the taxpayer and having enough receipts to fund the building of replacement homes on the other. The Government has already made clear that its firm intention is to substantially increase the caps and hence the average discount rates received by buyers in England.
Table 2: National 50% Right to Buy discount policy with £75,000 cash cap; effective discount rates
Headline or fixed discount rate Cash cap (max discount) Effective discount (average) East Midlands 50% East of England 46% London 39% North East 50% North West 50% South East 45% South West 49% West Midlands 50%
Yorkshire & the Humber … … … … 50% … … … … … … … … £75,000 … … … … 50%
9. The option that Ministers have chosen is policy option 2 (maintain existing discount ranges with a £75,000 cash cap). This option was chosen because it was considered to best meet the policy objectives, in particular the potential to increase take up of Right to Buy whilst at the same time ensuring that receipts would be sufficient to enable one for one replacement with affordable rent properties. The £75,000 cash cap also limits the potential for large windfall gains that an ‘uncapped’ policy approach would lack. The 30 year Net Present Value under this approach is positive, and the policy option results in significant net economic benefits.
10. Currently, Right to Buy sales of council properties are running at around 2,600 a year. Once the council’s costs relating to the sale have been covered, the council retains 25 per cent of the remaining receipt from the sale, with the other 75 per cent
going to the Treasury. The Treasury’s public expenditure forecasts include forecast Right to Buy receipts which are built into the Government’s deficit reduction plan. Councils will also have made assumptions about the receipts they will receive from Right to Buy sales, on the basis of the current Right to Buy rules.
11. The arrangements in the housing association sector are varied and depend on the local agreements made with transferring councils. In most cases, Preserved Right to Buy sale receipts are shared between the housing association and council, but in the case of early transfers, housing associations generally retain the full receipt. The element of the receipt retained by the housing association covers sales costs and compensates for lost rental income. This is important so that the sale has minimal impact on the housing association’s business plan so it can continue to meet loan covenants.
12. The Government is committed to ensuring that every additional home sold under Right to Buy is replaced by a new home, and receipts from sales will be recycled towards the cost of replacement (and repayment of debt). The receipt needed to fund replacement will only be a proportion of the cost of a new home. This is because most of the funding for new affordable rented homes comes from borrowing by the provider against the future rental income stream; and, in many cases, cross-subsidy from the landlord’s own resources, including land.
13. As housing associations are independent organisations, we do not wish or intend to mandate what they do with any receipts they retain. In practice, any surplus receipts (after costs and compensation for lost rental income) retained by housing associations are likely to be recycled to support new build and other public benefits. Where receipts are shared with councils, it is our expectation that housing associations will work with them to develop replacement homes.
14. We consulted on the best way to ensure delivery of the replacement homes with broadly three models:
• local delivery – where receipts are left with the council for reinvestment locally
• national delivery – where receipts are allocated through a competitive national programme administered by the Homes and Communities Agency. In London, this role would be undertaken by the Mayor
• combined approaches – either through directing how councils can use receipts or, where councils can show they are able to deliver one for one replacement and secure good value for money, allowing them to retain the receipts. Those who prefer not to lead on commissioning replacement homes or cannot meet the criteria could surrender receipts for distribution through a national programme.
15. Under the local delivery model, councils would generally be better placed to identify local needs and opportunities but less able to secure the wider competitive and distributional efficiencies that could be achieved through a national programme.
16. The chosen delivery model is a combined approach (‘Local with Agreement’) in which Local Authorities who have sold Right to Buy properties will have the opportunity to reinvest in replacement affordable rent properties subject to a maximum contribution from Right to Buy receipts. This maximum contribution will ensure value for money whilst at the same time keeping in line with localist principles. Any Local Authorities that are unable or do not wish to use receipts for replacement will submit their surplus receipts to a national pool to which local authorities and Registered Providers could bid.
17. As set out above, we are committed to letting councils keep the proportion of the receipt needed to cover the housing debt associated with additional Right to Buy sales. This will ensure that the Right to Buy reforms do not have an impact on the viability of self-financing or independent social landlords.
18. Future transfers of local authority properties to housing associations should not be affected as long as the discounts are applied consistently across both Right to Buy and Preserved Right to Buy, which is our intention. This will provide tenants with the confidence that they will not be disadvantaged by transfer.
SECTION 2: PROBLEM UNDER CONSIDERATION
Right to Buy
19. The Government wishes to help more people to realise their aspirations of home ownership. The Right to Buy programme has been immensely successful in helping to deliver this objective but sales have been in long term decline and minimal in recent years. Right to Buy sales across the Local Authority and Housing Association sectors combined amounted to fewer than 4,000 units in 2010/11. This is compared to a high in the early 1980s of over 160,000 sales per annum and a peak of over 80,000 sales per annum in the 2000s. Sales have fluctuated since the introduction of Right to Buy but the general trend has been downwards. This is likely to be a result of less generous discounts; increasing house prices; a general decline in the quality of the remaining stock as ‘better’ quality properties have been purchased; the changing socio-economic characteristics of social tenants; and, from 2007, adverse credit conditions.
20. The Government would like to see a significant increase in Right to Buy (and Preserved Right to Buy) sales in the coming years, allowing more social tenants to gain access to homeownership and meet their aspirations. The scale and rate of the increase in sales will depend not only on the generosity of the discount policy, but also fundamentally on economic and financial (mortgage market) conditions.
Replacement Meeting need
21. Historically, the Right to Buy policy has not involved the replacement of sales with new social or affordable homes. This has been a key criticism of the policy in the past, given the rising levels of housing need and demand.
22. Without one for one replacement of Right to Buy sales with affordable rented homes, the social and affordable housing stock has fallen. This is a problem because of the prevalence of housing need. It has been estimated that there are around 1.9m households in housing need in England.10 Increasing the affordable housing supply remains an important way of meeting housing need and alleviating housing pressure, especially for the most vulnerable households.
Supporting economic growth
23. Construction output and jobs have suffered during the recession, more than other sectors, with housing output declining by around 40% from the peak; net additions were around 121,000 in the latest year compared to over 200,000 in 2007. On the
10
latest estimates from the Office for National Statistics, the sharp decline in construction accounted for a fifth of the 7.1% decline in GDP from peak to trough in the recession and house building is now at its lowest level since the 1920s. The use of the Right to Buy receipts will provide a stimulus to construction and the wider economy that does not involve additional central Government borrowing.
SECTION 3: RATIONALE FOR INTERVENTION
Right to Buy
24. In general, social tenants cannot afford to buy their homes at market prices. Increasing the Right to Buy discount, by raising the cash caps will increase the financial incentive and improve affordability for social tenants to exercise their Right to Buy. This should re-invigorate Right to Buy sales to boost homeownership and meet aspiration.
25. The Right to Buy allows residents to do up their home, change their front door, improve their garden – without getting permission from the council. It gives people a sense of pride and ownership not just in their home, but in their street and neighbourhood.
26. The total stock of social sector housing today is approximately 4 million properties. In around 1.3 million of these, the head of the household is in work. Making reasonable assumptions around borrowing and transaction costs, we estimate that approximately 480,000 of them could afford to purchase their home. We believe that nearly 300,000 of these households both have the Right to Buy and could afford to do so. Many of these households may also end up financially better off in the medium to long term given the acquisition of an asset and the implied low loan to value repayment mortgage which in many cases may be cheaper to service than paying social rents.
One for one replacement Meeting need
27. Replacement with affordable rent homes will build on the funding model used in the 2011-15 Affordable Homes Programme, launched in July 2011 (which had the innovative ‘affordable rent’ model at its heart and is expected to produce up to 170,000 new affordable homes by 2015). This would ensure that our ability to meet housing need is not impaired by the additional Right to Buy sales. The new homes that are built will add to the total stock of housing so that, combined with the previously announced Affordable Homes Programme, the affordable housing stock should rise over the Spending Review period (2011/12-2014/15).
28. These new homes will also help constrain Housing Benefit expenditure because the households being provided with the new affordable rent homes, some reliant on Housing Benefit, will have lower (affordable) rents than they would have to pay in the private market.
29. The use of the Right to Buy sales receipts to raise the capital to fund construction and help stimulate the wider economy does not involve additional central
Government spending or borrowing which is imperative given the pressing need to reduce the budget deficit.
Supporting economic growth
30. During the recession, the UK economy contracted by 7.1% from peak to trough, according to the latest Office for National Statistics estimates, with the fall in construction output contributed around a fifth of this. Construction has been amongst the hardest hit sectors of the economy. It follows that restoring output to pre recessionary levels would support economic growth, which was only 0.9% in 2011 and is likely to be less than 1% in 2012, according to the latest Office for Budget Responsibility (OBR) view11.
31. The housing construction associated with the one for one replacement policy will help support economic recovery and growth in the near term. However, the number of homes that will be built over the current Spending Review will depend on the number of Right to Buy sales, and there will be a time lag before the sales receipt translates into a housing ‘start’. Given the current economic conditions, it is much less likely that this building activity will displace other private sector building. Housing output is also more labour intensive than most other sectors of the economy, due to strong domestic labour supply chain effects.
SECTION 4: POLICY OBJECTIVE AND OPTIONS CONSIDERED
32. The overarching policy objectives for Right to Buy sale and replacement combined are:
- to drive up Right to Buy take-up, thereby helping more people to realise their aspiration of home ownership;
- to ensure value to the government and a sufficient average sales receipt to be able to fund replacement homes for affordable rent;
- to protect the increase in overall affordable housing supply over the current Spending Review period to meet housing need
- to provide an investment stimulus to housing construction to support economic output and growth, without increasing central government borrowing.
33. We consider a number of illustrative options for the Right to Buy sale policy:
- Option 1: Maintain existing discount ranges with £50,000 cash cap - Option 2: Maintain existing discount ranges with £75,000 cash cap - Option 3: 40% Headline Right to Buy discount and no cash cap - Option 4: 50% Headline Right to Buy discount and £75,000 cap - Option 5: 50% Headline Right to Buy discount and no cash cap
34. The following pages consider each of these options in turn, with an upfront explanation covering the approach and methodology taken.
35. The option that Ministers have chosen is Option 2 (maintain existing discount rates with a £75,000 cash cap). This option was chosen because it was considered to best meet the policy objectives, in particular the potential to increase take up of Right to Buy whilst at the same time ensuring that receipts would be sufficient to enable one for one replacement with affordable rent properties. The £75,000 cash cap also limits the potential for large windfall gains that an ‘uncapped’ policy approach would lack. The 30 year Net Present Value under this approach is positive, and the policy option results in significant net economic benefits.
SECTION 5:OPTION APPRAISAL AND METHODOLOGY Take up
36. We estimate Right to Buy take up under the new Right to Buy policy using a module of the Department’s Affordability Model. This was developed and built by leading housing economists at Reading University, with the latest development work to the model commissioned in June 2008 and concluded in summer 2010.
37. Within this model, Right to Buy sales, at a regional level, are estimated as a function of:
- Local authority housing stock
- Average Right to Buy discount percentage - Mortgage interest rate
- House prices (both level and rate of change)
38. These were found to be the (statistically) significant variables and the model has an R-squared value of 0.68, which means the model explains roughly 70 per cent of the variation in Right to Buy sales. However, the model under-predicts the boom in sales up to 2003 and under-predicts the fall in sales following the credit crunch in 2008. Therefore, whilst the model performs reasonably well over time, it does not fully (or immediately) capture short term effects such as the influence of expected capital gains or credit restrictions.
39. Aside from average discount rates, which vary between baseline and policy options, we have selected a common set of assumptions for the other variables in the model. These are:
- Local authority housing stock. We assume the stock declines in line with Right to Buy sales.
- Mortgage rates. Based on Bank of England Inflation Report (implied forward rates).
- Regional House prices. Based on Office for Budget Responsibility projections.
40. The model predicts an initial increase in sales with an increased discount. This is a result of house prices and interest rates remaining initially low. However, rising interest rates and house prices eventually produce downward pressure on levels of sales.
41. A significant increase in sales above those projected would be likely to require substantial improvements in credit availability (and the pace of economic recovery) and buyer confidence as well as rising discounts. These factors are suppressing general housing market activity currently but may be even more pronounced
amongst prospective Right to Buy purchasers (unemployment threat, higher impact of inflation on real incomes).
42. Policy delivery will also have a bearing on future sales associated with increasing average discount rates and this is not captured in the modelling. For example, take-up will depend on factors such as publicity, guidance and assistance for prospective buyers, and wider support in relation to constraints such as buyer confidence and credit availability. Therefore given a particularly strong and well targeted programme of communications, for example, take up may be higher in the early years following a change in the discount rate than that predicted by the model.
43. Evidence from previous Right to Buy policy changes suggest that there was a degree of information failure and therefore provides evidence to suggest there may be room for measures to boost take up. A report assessing the impact of changes to the Right to Buy policy in February 199912 indicates that only one third of respondents were aware of the changes and only just over half of these respondents heard about the change before they applied.
Cost-benefit analysis
44. Two approaches to cost benefit analysis are followed. One follows HM Treasury Green Book Appraisal methodology and considers the net economic impact of the policy in terms of a) the social benefit of improving household consumption of low income households, b) the economic benefit of increased housing supply and c) the economic benefit of increased construction. The Green Book Appraisal is set out in Section 8. The other approach, which is set out below, considers the net present value of the policy changes to the public sector (Government, Local Authorities and Housing Associations) and is an assessment of financial flows. The costs and benefits incurred by Government, local authorities and Registered Social Landlords are not included in the economic appraisal given that they represent transfers from one part of society to another rather than net economic impacts.
Value (Net Present Value) to the public sector
45. Although the Right to Buy discount and one-for-one replacement are part of one policy (the second cannot happen without the first), we appraise them separately. This is because they are essentially two separate decisions (i) to set Right to Buy terms at a specified % discount and £ cash cap (ii) to replace sales one for one with affordable rent homes using the proceeds, as opposed to using the proceeds for some other purpose.
46. For each policy, we compare the Net Present Value of the real terms costs and benefits over the assessment period, against a counterfactual of the status quo. The use of the status quo will not reflect the opportunity cost of being unable to pursue
12
alternative policies in the future, e.g. instead of selling social homes under a Right to Buy policy, converting them to affordable rent homes.
47. The approach also does not seek to take into account some important policy changes in the pipeline. The key one is the Government’s tenure reform programme which, for some new tenants, may mean a shift towards fixed-term tenancies. There would clearly be a more serious challenge to our approach if the new tenure policy was also being applied to existing tenants – however, there are no plans to do so.
48. We assess Net Present Value over both 30 and 60 years. 60 years could be considered a long period of time in appraisal terms but is consistent with some past practice. The advantage of a longer 60 year period is that the full value of the asset is captured in the Net Present Value analysis without needing to make an assessment of residual value, which can be subjective. It also more closely reflects the lifetime of homes. However, the advantage of a shorter 30 year period is that it minimises the so-called divergence problem, where small changes or differences in the initial values (including in our assumptions) can have a big and potentially spurious impact on the results, a problem that is more severe the longer the period. However, due to the subjective nature of the residual asset values, they are not included in the 30 year Net Present Values set out in this paper, but are set out alongside.
49. The figures presented are for a sale in the first year of the policy but, in reality, Net Present Values will differ according to the year of sale. There are a number of reasons for this:
1. the cash cap is fixed in nominal terms so if house prices are generally rising with time, the effective generosity of the cash cap will be falling. So the Net Present Value will tend to be more positive for sales further into the future. 2. macroeconomic variables (e.g. inflation), Local Authority rent, and Local
Housing Allowance for rents increase at a different rate in the next few years compared with their increases in the longer run - this will affect the balance of benefits and costs depending on the year of sale
50. We consider only the net present value for the public sector of these policies. The public sector (or “government”) is taken to mean both central and local government combined.
51. The key Net Present Value assumptions are set out below.
Macroeconomic assumptions
Table 3: Macroeconomic Assumptions
2012 2013 2014 2015 Beyond
RPI 3.3% 2.9% 3.1% 3.6% 3.2%
CPI 2.7% 2.1% 2.0% 2.0% 2.0%
GDP deflator 2.5% 2.8% 2.5% 2.5% 2.7%
Policy assumptions
• Local Authority rent = RPI + 2.5% to 2015 to approximate Local Authority rent convergence criteria, RPI + 0.5% beyond
• Local Housing Allowance rent = CPI 2013-16, RPI + 0.5% 2017 and beyond. LHA inflation for 2012 is assumed to be 2% which reflects an announcement from DWP Ministers in December which confirmed that LHA rates will be frozen from April 2012 ahead of CPI uprating from 2013. This corrects an oversight in the draft impact assessment.
• Market rent = RPI + 0.5%
• Repairs Management and Maintenance = RPI to 2041, RPI +0.5% 2042-71
Table 4: Rent assumptions
2012 2013 2014 2015 Beyond
Local authority rent inflation 5.8% 5.4% 5.6% 6.1% 3.7% Local Housing Allowance
rent inflation 2.0% 2.1% 2.0% 2.0% 3.7%
Market rent inflation 3.7% 3.7% 3.7% 3.7% 3.7%
Repairs, Maintenance and
Management inflation 3.3% 2.9% 3.1% 3.6% 3.2%
Key Housing Benefit assumptions
• Percentage of those exercising their Right to Buy who are on Housing Benefit = 10% (full housing benefit equivalent13). This assumption has been reduced from 15% in the draft Impact Assessment as a result of analysis of
consultation responses, which indicate that 10% is more realistic based on historic sales, and following discussion with the Department for Work and Pensions. However, due to the continued uncertainty and the potential for the increase in the discount rates to increase this figure, sensitivity analysis is presented in Section 9.
• Social let term = 15 years (i.e. we assume that the Right to Buy purchaser would have otherwise left their property after 15 years).
• Percentage of social tenants on Housing Benefit = c.60% (full housing benefit equivalent14). This varies regionally.
13
This is a simplifying assumption. We do not expect 10% of potential Right to Buy purchasers to be on full Housing Benefit, rather we expect that a larger number of tenants will be on partial Housing Benefit which amounts to an equivalent on 10% on full Housing Benefit. However, as mentioned above, there is a high degree of uncertainty associated with this assumption.
14
SECTION 6A: RIGHT TO BUY OPTIONS
52. The key considerations for the Right to Buy discount options are maximising take up whilst ensuring value for money and that the average sale receipt will be sufficient for replacement with affordable rented homes on a one for one basis.
53. The receipt needed to fund replacement will only be a proportion of the construction cost of a new home. This is because most of the funding for new affordable rented homes comes from borrowing by the provider against the future rental income stream; and, in many cases, cross-subsidy from the landlord’s own resources, including land. For instance, in the Affordable Homes Programme for 2011-15 which we announced last summer, Government grant is contributing around 20 per cent of the cost of providing the new affordable rented homes. Similarly, it is expected that the Right to Buy receipt will need to cover a proportion of the cost of the replacement home and that the remainder of the costs will be found from other sources.
54. We estimate the contribution that will be needed from the sales receipt to fund a replacement home will be approximately £40,000. Our proposal is that Right to Buy receipts will first be used to meet debt on additional properties sold. This is estimated at around £17,000 on average for Local Authorities and £19,000 on average for Housing Associations, although there is wide variation around these figures.
55. In addition, during the 2011-15 Spending Review period, we will need to take account of the fact that both HM Treasury and councils will have expected to receive a level of Right to Buy receipts under the current terms of the Right to Buy scheme. In the case of HM Treasury’s proportion, this is factored into the Government’s public expenditure figures. The aim is to ensure that those HM Treasury and council forecast receipts are met out of the Right to Buy sale receipts (this does not apply to preserved Right to Buy). Our initial modelling shows that, even taking that into account, based on central assumptions under our preferred option the expected receipts will provide a sufficient contribution to the cost of replacement homes both during the Spending Review period and beyond. .
Option 1: Maintain existing Right to Buy discount ranges with a £50,000 cash cap
Additional Take-up
56. Additional take up is presented under three scenarios. The central scenario is consistent with that described in the section which explains the take up modelling.
57. The upper bound scenario reflects a more buoyant economic recovery than that in the central case with house prices rising more rapidly, which drives up Right to Buy sales. The lower bound scenario reflects a much more sluggish economic environment with potential pressures from the Eurozone resulting in low to negative house price inflation.
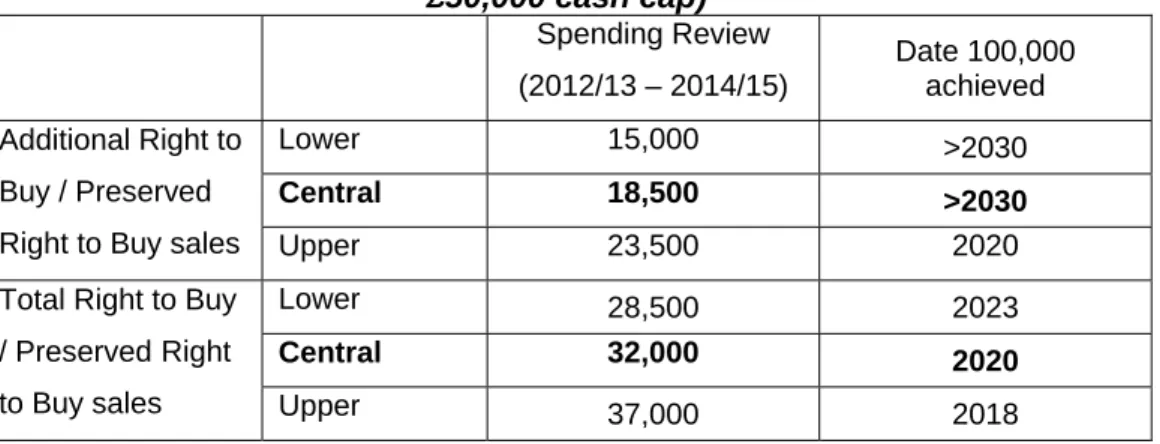
Table 5: Take up under policy option 1 (Maintain existing discount ranges with £50,000 cash cap) Spending Review (2012/13 – 2014/15) Date 100,000 achieved Lower 15,000 >2030 Central 18,500 >2030 Additional Right to Buy / Preserved
Right to Buy sales Upper 23,500 2020
Lower 28,500 2023
Central 32,000 2020
Total Right to Buy / Preserved Right
to Buy sales Upper 37,000 2018
Average sale receipt and funding replacement
58. The average gross Right to Buy sale receipt is estimated at £79,500 in the first year of the policy. After compensation to the local authority of the debt position, the implied average net sale receipt is £62,500. We estimate this would be sufficient for one for one replacement without the need for conversions (both within and beyond the current Spending Review period).
Value (Net Present Value) to the government
59. The table below presents the Net Present Value breakdown per home in the first year of policy option 1, versus the current Right to Buy policy. A positive number represents a financial benefit to the public sector while a negative number indicates that the policy has a net present cost to the public sector. The 30 year Net Present Value figure is positive at £26,800 and the 60 year Net Present Value figure is also positive at £6,200. The fact that the Net Present Value is much more positive over 30 years reflects the fact that the benefits are frontloaded, whereas the costs are more evenly spread over time and potentially omit residual asset value.
Table 6: Net Present Value of policy option 1 (Maintain existing discount ranges with £50,000 cash cap), England
Benefits Present value
30 years* 60 years - sale receipt maintaining existing discount ranges and
with a £50k cash cap £79,500 £79,500
- maintenance cost savings £24,800 £36,500
- major repair cost savings £18,800 £27,700
- management cost savings £15,900 £23,400
- debt servicing interest savings £7,400 £10,200
Benefits subtotal £146,200 £177,200
Costs
- loss of rental stream -£95,000 -£144,100
- deadweight impairment15 vs current policy -£18,500 -£6,900
Costs subtotal -£119,500 -£171,000
Net position £26,800 £6,200
* The 30 year assessment excludes the potential residual value of the property. Residual values are incredibly subjective and difficult to calculate in an accurate fashion, particularly for non-market assets, therefore should be treated with caution. Using the estimated net rental income from year 31-60 as a proxy, we estimate that the residual value of the property could be in the region of £21k. Including the residual value would worsen the net position.
Option 2 (preferred option): Maintain existing Right to Buy discount ranges with £75,000 cash cap
Additional Take-up
60. This is the option chosen by Ministers to best meet the stated policy objectives. Again, take up is presented under the three scenarios.
Table 7: Take up under policy option 2 (Maintain existing discount ranges with £75,000 cash cap) Spending Review (2012/13 – 2014/15) Date 100,000 achieved Lower 16,500 >2030 Central 20,000 2025 Additional Right to Buy / Preserved
Right to Buy sales Upper 25,000 2019
Lower 30,000 2021
Central 33,500 2019
Total Right to Buy / Preserved Right
to Buy sales Upper 38,000 2017
Average sale receipt and funding replacement
61. The average gross Right to Buy sale receipt is estimated at £72,500 in the first year of the policy. After compensation to the local authority of the debt position, the implied average net sale receipt is £55,500. Under our central assumptions we estimate that this would be sufficient for one for one replacement without the need for conversions within and beyond the current Spending Review period.
Value (Net Present Value) to the government
15
The deadweight has been calculated by working out the number of sales that would occur if the existing policy were to continue and the NPV we forgo on each existing sale as a result of moving to a more generous new policy. The NPV of the existing policy diminishes (becomes less positive) with time because the benefits are frontloaded (e.g. the sales receipt) whereas the costs hit later on (e.g. housing benefit). The 30 year NPV of the existing policy is around +£46,000 and the 60 year NPV is around +£16,000. So, as the NPV of the existing policy diminishes with time so does the deadweight of replacing it, hence why deadweight under the 60 year NPV in the table above is
62. The table below presents the Net Present Value breakdown per home in the first year of policy option 2, versus the current Right to Buy policy, for England. The 30 year Net Present Value figure is positive at £19,800, but the 60 year Net Present Value figure is negative at -£700.
Table 8: Net Present Value of policy option 2 (Maintain existing discount ranges with £75,000 cash cap), England
Benefits Present value
30 years* 60 years - sale receipt maintaining existing discount ranges and
with a £75k cash cap £72,500 £72,500
- maintenance cost savings £24,800 £36,500
- major repair cost savings £18,800 £27,700
- management cost savings £15,900 £23,400
- debt servicing interest savings £7,400 £10,200
Benefits subtotal £139,300 £170,200
Costs
- loss of rental stream -£95,000 -£144,100
- extra housing benefit costs -£6,000 -£20,000
- deadweight impairment16 vs current policy -£18,500 -£6,900
Costs subtotal -£119,500 -£171,000
Net position £19,800 -£700
* The 30 year assessment excludes the potential residual value of the property. Residual values are incredibly subjective and difficult to calculate in an accurate fashion, particularly for non-market assets, therefore should be treated with caution. Using the estimated net rental income from year 31-60 as a proxy, we estimate that the residual value of the property could be in the region of £21k. Including the residual value would worsen the net position.
Option 3: 40% Headline Right to Buy discount and no cash cap
Additional Take-up
63. Again, take up is presented under the three scenarios.
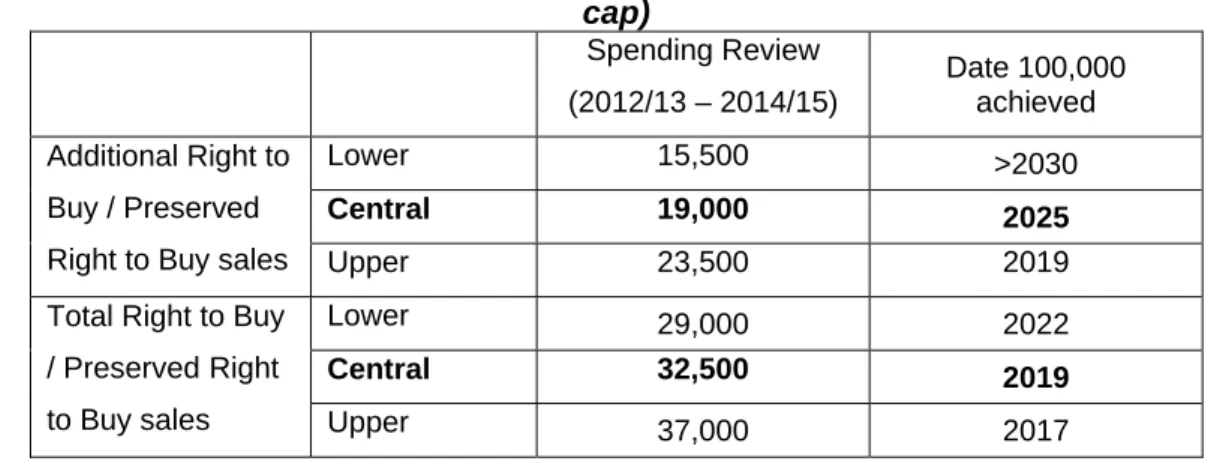
Table 9: Take up under policy option 3 (40% headline discount and no cash cap) Spending Review (2012/13 – 2014/15) Date 100,000 achieved Lower 15,500 >2030 Central 19,000 2025 Additional Right to Buy / Preserved
Right to Buy sales Upper 23,500 2019
Lower 29,000 2022
Central 32,500 2019
Total Right to Buy / Preserved Right
to Buy sales Upper 37,000 2017
16
Average sale receipt and funding replacement
64. The average gross Right to Buy sale receipt is estimated at £75,200 in the first year of the policy. After compensation to the local authority of the debt position, the implied average net sale receipt is £58,200. We estimate this would be sufficient for one for one replacement without the need for conversions (both within and beyond the current Spending Review period).
Value (Net Present Value) to the government
65. The table below presents the Net Present Value breakdown per home in the first year of policy option 3, versus the current Right to Buy policy. The 30 year Net Present Value figure is positive at £22,500 and the 60 year Net Present Value figure is also positive at £1,900.
Table 10: Net Present Value of policy option 3 (40% headline discount and no cash cap), England
Benefits Present value
30 years* 60 years - sale receipt with a 40% headline Right to Buy
discount & no cash cap £75,200 £75,200
- maintenance cost savings £24,800 £36,500
- major repair cost savings £18,800 £27,700
- management cost savings £15,900 £23,400
- debt servicing interest savings £7,400 £10,200
Benefits subtotal £141,900 £172,900
Costs
- loss of rental stream -£95,000 -£144,100
- extra housing benefit costs -£6,000 -£20,000
- deadweight impairment17 vs current policy -£18,500 -£6,900
Costs subtotal -£119,500 -£171,000
Net position £22,500 £1,900
* The 30 year assessment excludes the potential residual value of the property. Residual values are incredibly subjective and difficult to calculate in an accurate fashion, particularly for non-market assets, therefore should be treated with caution. Using the estimated net rental income from year 31-60 as a proxy, we estimate that the residual value of the property could be in the region of £21k. Including the residual value would worsen the net position.
Option 4: 50% Headline Right to Buy discount and £75,000 cash cap
Additional Take-up
66. Again, take up is presented under the three scenarios.
Table 11: Take up under policy option 4 (50% headline discount and £75k cash cap) Spending Review (2012/13 – 2014/15) Date 100,000 achieved Lower 18,000 2029 Central 21,500 2022 Additional Right to Buy / Preserved
Right to Buy sales Upper 26,000 2019
Lower 31,500 2020
Central 35,000 2018
Total Right to Buy / Preserved Right
to Buy sales Upper 39,500 2017
Average sale receipt and funding replacement
67. The average gross Right to Buy sale receipt is estimated at £68,600 in the first year of the policy. After compensation to the local authority of the debt position, the implied average net sale receipt is £51,600. This would be sufficient for one for one replacement without the need for conversions beyond the current Spending Review period, but we estimate that there would be a modest funding gap within the current Spending Review period under this policy.
Value (Net Present Value) to the government
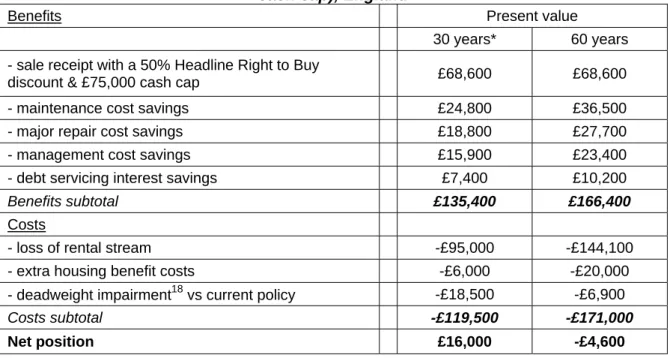
68. The table below presents the Net Present Value breakdown per home in the first year of the policy option 4, versus the current Right to Buy policy, for England. The 30 year Net Present Value figure is positive at £16,000 but the 60 year Net Present Value figure is negative at -£4,600.
Table 12: Net Present Value of policy option 4 (50% headline discount and £75k cash cap), England
Benefits Present value
30 years* 60 years - sale receipt with a 50% Headline Right to Buy
discount & £75,000 cash cap £68,600 £68,600
- maintenance cost savings £24,800 £36,500
- major repair cost savings £18,800 £27,700
- management cost savings £15,900 £23,400
- debt servicing interest savings £7,400 £10,200
Benefits subtotal £135,400 £166,400
Costs
- loss of rental stream -£95,000 -£144,100
- extra housing benefit costs -£6,000 -£20,000
- deadweight impairment18 vs current policy -£18,500 -£6,900
Costs subtotal -£119,500 -£171,000
Net position £16,000 -£4,600
18
* The 30 year assessment excludes the potential residual value of the property. Residual values are incredibly subjective and difficult to calculate in an accurate fashion, particularly for non-market assets, therefore should be treated with caution. Using the estimated net rental income from year 31-60 as a proxy, we estimate that the residual value of the property could be in the region of £21k. Including the residual value would worsen the net position.
Option 5: 50% Headline Right to Buy discount and no cash cap
Additional Take-up
69. Again, take up is presented under the three scenarios.
Table 13: Take up under policy option 5 (50% headline discount and no cash cap) Spending Review (2012/13 – 2014/15) Date 100,000 achieved Lower 19,000 2024 Central 22,500 2020 Additional Right to Buy / Preserved
Right to Buy sales Upper 27,000 2018
Lower 32,500 2019
Central 36,000 2018
Total Right to Buy / Preserved Right
to Buy sales Upper 40,500 2017
Average sale receipt and funding replacement
70. The average gross Right to Buy sale receipt is estimated at £62,600 in the first year of the policy. After compensation to the local authority of the debt position, the implied average net sale receipt is £45,600. This would be just about sufficient for one for one replacement without the need for conversions beyond the current Spending Review period, with some risk; but we estimate a clear funding gap within the Spending Review period under this policy.
Value (Net Present Value) to the government
71. The table below presents the Net Present Value breakdown per home in the first year of policy option 5, versus the current Right to Buy policy, for England. The 30 year Net Present Value figure is positive at £9,900 but the 60 year Net Present Value figure is negative at -£10,700. The fact that the Net Present Value is much more positive over 30 years reflects the fact that the benefits are frontloaded, whereas the costs are more evenly spread over time and potentially omit residual asset value.
Table 14: Net Present Value of policy option 5 (50% headline discount and no cash cap), England
Benefits Present value
30 years* 60 years - sale receipt with a 50% headline Right to Buy
discount & no cash cap £62,600 £62,600
- maintenance cost savings £24,800 £36,500
- major repair cost savings £18,800 £27,700
- debt servicing interest savings £7,400 £10,200
Benefits subtotal £129,400 £160,300
Costs
- loss of rental stream -£95,000 -£144,100
- extra housing benefit costs -£6,000 -£20,000
- deadweight impairment19 vs current policy -£18,500 -£6,900
Costs subtotal -£119,500 -£171,000
Net position £9,900 -£10,700
* The 30 year assessment excludes the potential residual value of the property. Residual values are incredibly subjective and difficult to calculate in an accurate fashion, particularly for non-market assets, therefore should be treated with caution. Using the estimated net rental income from year 31-60 as a proxy, we estimate that the residual value of the property could be in the region of £21k. Including the residual value would worsen the net position.
Burdens on Local Authorities
72. Under our proposals to increase average discounts on Right to Buy sales, we expect take-up of Right to Buy to be substantially higher than current levels, and therefore the costs of administering sales (successful and withdrawn) will rise correspondingly. Currently, councils may deduct the administration and transaction costs of successful sales from Right to Buy receipts but there is no allowance for costs relating to applications under Right to Buy which fall through and do not result in a sale.
73. We propose to provide for set administrative costs of £2,850 in London and £1,300 elsewhere, which includes a 50% uplift to cover the cost of withdrawn applications. This will mean authorities should be able to cover their costs of processing applications (and include a contribution towards the costs of aborted applications) but will also encourage efficient administration.
19
SECTION 6B: ONE FOR ONE REPLACEMENT OPTIONS
74. Under our take-up modelling, receipts are generally greatest and sales increase the most in areas of high housing need, because these are the areas where house prices are highest and Right to Buy demand has previously been choked off by low levels of caps (e.g. £16,000 in most of London). In consequence, it is broadly the case that additional Right to Buy receipts will be generated in areas where housing need is greatest.
75. However, receipts generated locally will not necessarily secure one-for-one replacement in each area. For example, on average, our estimates suggest that – broadly speaking – receipts in the North West may be insufficient to support the funding required for one-for-one replacement while in London receipts on a single sale could support more than one replacement home for affordable rent.
76. We consulted on three options for delivery models for managing the one-for-one replacement programme. These were:
Local delivery – where receipts for replacement are left with the council for reinvestment locally
National delivery – where receipts for replacement are allocated through the Greater London Authority in London and by the Homes and Communities Agency in the rest of England.
Combined approaches – either through directing how councils can use receipts or, where councils can show they are able to deliver one for one replacement and secure good value for money, allowing them to retain the receipts. Those who prefer not to lead on commissioning replacement homes or cannot meet the criteria could surrender receipts for distribution through a national programme.
77. Under all models, the receipts for replacement will require supplementing by borrowing, provider contributions in land or funds and under some of the options modelled, some additional funding. This mix of funding follows the approach already being taken to funding affordable rent in the 2011-15 Affordable Homes Programme.
78. A number of issues were considered in deciding between these models, including the extent to which the arrangements:
• can secure competition and value for money in commissioning replacement homes
• deliver replacement homes in areas of housing need
• are administratively simple and transparent
• provide assurance that, for England as a whole, one-for-one replacement is secured
79. Following the consultation, Ministers’ chosen delivery model is the combined approach (‘local model with agreement’). This will enable Local Authorities the option to retain Right to Buy receipts for replacement homes in their area subject to receipts not exceeding a maximum contribution in replacement properties. The maximum contribution will be such that a Local Authority can use Right to Buy receipts up to 30% of the total scheme costs of a replacement unit. This is based on data from successful local authority bids from the 2011-15 Affordable Homes Programme and is set at such a level to ensure value for money. This will support one for one replacement, whilst at the same time sticking to localist principles. If a Local Authority cannot or does not wish to deliver replacement properties receipts will be surrendered and redistributed through an England-wide programme run by the HCA. London will be treated separately with the GLA running a London-wide programme with any excess receipts.
Funding the replacement units
80. As indicated above, the Government’s intention is that Right to Buy receipts will first be used to meet debt on additional properties sold. This is estimated at around £17,000 on average for Local Authorities and £19,000 on average for Housing Associations, although there is wide variation around these figures. In addition, during the Spending Review we will meet HM Treasury and council forecast receipts out of the remaining Right to Buy sale receipts after this debt repayment (this does not apply to preserved Right to Buy).
81. The receipt proceed needed to fund replacement will be only a proportion of the construction cost of a new home. This is because most of the funding for new affordable rented homes comes from borrowing by the provider against the future rental income stream; and, in many cases, cross-subsidy from the landlord’s own resources, including land.
82. Drawing on the experience of the 2011-15 Affordable Homes Programme, we estimate that the average construction cost of a replacement unit nationally will be between £133,000 and £150,000, based on the costs of Affordable Rent homes. The £150,000 figure accounts for the possibility of diminished cross-subsidy from other sources in the future. The average amount of provider provision in the Programme is around £34,000 for Local Authorities and £15,000 for Housing Associations but, again, with some variation.
83. Taking all this together, we can estimate that the contribution needed from the sales receipt to fund a replacement home will be between £40,000 and £45,000.
Table 15: Illustrative funding sources for replacement, per home
Borrowing capacity from future
affordable rent income £59,000 £78,000
Provider provision £34,000* £22,000*
Right to Buy sale receipt (in place of
grant) £40,000 £45,000
Total £133,000 to £143,000 £140,000 to £150,000 *this could include land
Value (Net Present Value) to the Government and providers
84. The following tables present an illustrative breakdown of the Net Present Value to the Government and providers of one-for-one replacement with affordable rent homes, for England. Table 16 is an illustration for Local Authorities. It tells us that with a contribution from receipts of £41,500, provider resources of £34,000 and borrowing of £59,000, the net Present Value to the Government is positive over 60 years, at +£9,000. That is, the income from future rent and housing benefit savings will exceed the costs (i.e. future running costs including debt servicing, upfront grant and provider resources). The fact that the Net Present Value is negative over 30 years reflects the fact that the benefits are more evenly spread over time and potentially omit residual asset value, whereas the costs are frontloaded.
85. Table 17 is an illustration of the Net Present Value for Housing Associations. It tells us that with a grant of £45,000, provider resources of £15,000 and borrowing of £78,000, the net Present Value to the Government and providers combined is positive over 60 years. Again the Net Present Value is negative over 30 years for the reasons described.
Table 16: Net Present Value of 141 replacement policy for government and providers, typical local authority (England)
Benefits Present value
30 years** 60 years
- Rental stream £135,200 £204,600
- Housing Benefit impacts £2,800 £3,900
- Benefits subtotal £138,000 £208,500
Costs
- maintenance cost -£24,800 -£36,500
- major repair cost -£18,800 -£27,700
- management cost -£15,900 -£23,400
- debt servicing interest on £59,000 -£26,400 -£36,400
- Grant (from Right to Buy sale) -£41,500 -£41,500
- Provider resource* -£34,000 -£34,000
*assumed to be land in this calculation.
** The 30 year assessment excludes the residual value of the property which is estimated to be approximately £20k. Including the residual value would improve the net position
Table 17: Net Present Value of 141 replacement policy for government and providers, typical HA (England)
Benefits Present value
30 years** 60 years
- Rental stream £135,200 £204,600
- Housing Benefit impacts £2,800 £3,900
- Benefits subtotal £138,000 £208,500
Costs
- maintenance cost -£24,800 -£36,500
- major repair cost -£18,800 -£27,700
- management cost -£15,900 -£23,400
- debt servicing interest on £78,000 -£34,700 -£47,900
- Grant (from Right to Buy sale) -£45,000 -£45,000
- Provider resource* -£17,000 -£17,000
- Costs subtotal -£156,200 -£197,500
Net position -£18,200 £11,000
*assumed to be land in this calculation.
** The 30 year assessment excludes the residual value of the property which is estimated to be approximately £20k. Including the residual value would improve the net position