EBA’s Capital Exercise and Technical Efficiency of the
banks
Adhiraj Singh Rathore
University of Glasgow
Abstract
This study uses a sample of 194 banks from 15 EU countries and two-stage data envel-opment analysis (DEA) to provide evidence on the impact of the European Banking Authority (EBA)’s capital exercise on banks’ efficiency. In the first stage of the analysis, we measure the efficiency by employing DEA. We then use Tobit regression to inves-tigate the impact of the capital exercise on banks’ technical efficiency. We estimate several specifications while controlling for bank-specific attributes and country-level characteristics accounting for macroeconomic conditions, financial development and market structure. The results indicate that EBA’s capital exercise came, as a shock for the banks would be contributing towards making the banks more stable. It would be preventing banks from excessive risk-taking activities. Furthermore, it would be allowing the banks to withstand the financial distress and contributing in banks be-coming less prone to the systemic risk. The study finds that the capital requirements would be creating favourable economic conditions, which would be, affect the extent, depth and quality of financial intermediation and banking services.
JEL classification: G21, C67.
Keywords: Efficiency, Bank, Euro Area, DEA, Capital.
1.
Introduction
In October 2011 the European Banking Authority (EBA), the institution charged with setting harmonized supervisory standards for banks in EU member states, announced that Major European banking groups would have to increase their core tier 1 capital ratios to 9 percent of their risk-weighted assets by June 2012 (EBA, 2011b). These groups were also required to hold a new temporary capital buffer to cover risks linked to sovereign bond holdings. The announcement came largely as a surprise, as the EBA had just conducted rigorous stress tests in the summer of 2011 and had already released detailed information on the exposure of European banks to sovereign risk. This announcement came at a time when the euro area was still considered to be extremely fragile, following a tumultuous summer on the sovereign debt markets of several member states. Many observers were concerned that impaired bank balance sheets were leading to weak credit supply and aggravating the recession in several countries. Therefore, the timing of the EBA’s capital exercise came under fire from the critics for contributing to a “credit crunch” in the euro area.
Indeed, any attempt to evaluate the impact of a capital requirement shock on lending supply faces several challenges. First, new regulations, such as Basel I to III, have generally been announced well ahead of their implementation explicitly in order to allow banks to smoothly adjust their balance sheets. This makes the task of identifying an unexpected shock to capital requirements and measuring the short-term impact on loan supply quite difficult. Second, as with the 2007-09 sub-prime crisis, regulators may increase requirements on account of a deterioration in the credit quality of borrowers during a downturn. Similarly to the difficulty of measuring the impact of a bank capital shock more generally, disentangling demand and supply effects is therefore not straightforward. Third, changes to bank regulations tend to affect all large banks of a given country at the same time, making it difficult to construct appropriate control groups of untreated but similar institutions.
Most of the recent studies have been focussing on how the Basel Accords would affect the efficiency of the banks. Basel III have allowed banks to have a transition period before the regulations are fully implemented (BIS, 2011). This would be allowing the banks to have time to make necessary time to make the adjustments without affecting its efficiency. However, the EBA capital exercise announcement came as a shock to the banking industry. The EBA announced its capital exercise after drawing conclusions from its own June 2011 stress tests (EBA, 2011b) . This announcement required the banks to be holding 9% capi-tal ratio by June 2012(EBA, 2011c) .The new required ratio was higher than that planned under under the transition to Basel III and explicitly not related to the level of risks of any particular banking group, but rather to ensure that all large European banks accumulated
sufficient capital cushions to withstand a further deterioration in the sovereign debt crisis. The horizon set by the EBA to meet the higher required was shorter compared to Basel III process.This makes the case for the observed change in lending over the period was a result of the capital requirement shock. All of these elements reflect that the Capital Exercise comes close to a natural experiment and providing a rare opportunity to observe an exogenous regulatory shock to bank capital.
M´esonnier and Monks (2014) investigated the impact of of a regulatory shock tightening bank capital requirements on lending to the real economy.The results show that the exercise had pro-cyclical macroeconomic effects on credit supply. (Gropp, Mosk, Ongena, and Wix, 2018) showed that the Banks did not raise their capital ratios by increasing their levels of capital, but by reducing their risk-weighted assets, in particular their credit exposures to corporate and retail clients.Numerous researchers have shown the role of capital requirement on the technical efficiency of the banks. However, none have looked into the role of such capital shock on the technical efficiency of the banks.
This study attempts to fill in the gap by providing evidence on how the EBA’s capital shock impacted on the efficiency of the banks. To do so, the study conducts an analysis of the impact of the capital shock on the efficiency scores estimated by DEA. The study uses the balance sheet data of the banks, macroeconomic conditions, financial development and mar-ket structure to investigate impact on the bank efficiency while controlling for bank specific factors. To my best knowledge, this is the first study to do so. The study uses a sample of 194 banks from 15 countries which is comprehensive in terms of geographical coverage. The EBA’s capital exercise made the banks to reconsider their activities in the banking sector and to manage their portfolios better. It has aimed to make the banking market less con-centrated. The results show that the mean of the Technical Efficiency for the banks in the sample equal .505 and .488 for before and after the capital exercise announcement was made by the EBA respectively.Furthermore, the capital exercise contributed in stabilising the tech-nical efficiency over the years. The EBA’s capital exercise has contributed towards making the banks more stable and having less likelihood of having a financial distress. Additionally, it would be preventing the banks from excessive risk-taking activities.As the exercise would creating an environment for careful lending and better bank performances.
The rest of the study is structured as follows. Section 2 provides an overview of the EBA Capital Exercise and a review of studies that an investigated efficiency and capital require-ment. Section 3 outlines Data Envelopment Analysis while Section 4 presents the sample and variables used in the study. Section 5 discusses the results and Section 6 concludes the study.
2.
Literature Review
2.1.
EBA Capital Exercise
On October 26,2011 The EBA announced its capital exercise which required banks to strengthen their capital positions by by building up a temporary capital buffer against sovereign debt exposures and to raise their core tier 1 capital ratio to 9% (EBA, 2011a). The banks were required to meet these requirements by June 2012. The aim of the exercise was to build confidence in the ability of euro-area banks to withstand credit shocks.
The level of the new required core-tier-1-to-RWA ratio was substantially higher than that planned under the transition to Basel III (BIS, 2011). This was explicitly not related to the level of risks of any particular banking group. As a result, it is fair to assume that the heightened requirement came as a surprise for most of the banking groups involved (Gropp et al., 2018). The new required ratio was higher than that planned under under the transition to Basel III and explicitly not related to the level of risks of any particular banking group, but rather to ensure that all large European banks accumulated sufficient capital cushions to withstand a further deterioration in the sovereign debt crisis (EBA, 2011b). The horizon set by the EBA to meet the higher required was shorter compared to Basel III process.This makes the case for the observed change in lending over the period was a result of the capital requirement shock. The EBA published an initial country-level estimate of required capital raising on October 26, 2011. On December 8, 2011, it published a formal recommendation with bank-level figures based on September 2011 balance sheet data (EBA, 2011c). Twenty-seven banks were identified as having an aggregate capital shortfall of 76 billion and were required as a consequence to submit capital plans to the EBA through their national su-pervisory authorities by January 20, 2012. (EBA, 2011c)The EBA published a preliminary assessment of the plan on February,2012 and emphasized that the measures were observed not be having any negative impact on the lending into the real economy (EBA, 2011c). On July 2012, the preliminary report was published and the majority of the banks had met the capital requirements. The final report, including end-June 2012 detailed balance sheet information for all participating banks was published on October 3,2012 (EBA, 2012). Numerous researchers have criticized the timing of the capital exercise due to potentially ag-gravating the credit crunch in the Euro area (M´esonniera and Monksb, 2015). However, The EBA has consistently emphasized for the need to address the capital shortfalls without con-straining credit provision in the real economy. However, the EBA consistently emphasized the need for banks to address capital shortfalls without constraining credit provision to the real economy. For example, the recommendation of December 8, 2011 outlined a hierarchy of capital-raising measures, emphasizing the use of liability management and stating that
national authorities could only agree to asset disposals if they did not “lead to a reduced flow of lending to the EU’s real economy” (EBA, 2011c) . Furthermore, the EBA and national authorities were to ensure that capital targets were “not achieved through excessive delever-aging, disrupting lending into the real economy” (EBA, 2011c). In total, the twenty-seven banks increased their capital by 115.7 billion (EBA, 2012). According to the EBA’s final report, 83.2 billion of this related to direct capital measures, while 32.5 billion related to the impact of RWA measures (EBA, 2012). Contributing to the latter figure was a fall in RWAs of 42.9 billion (0.87 percent of total RWAs as of September 2011) arising from reductions in lending (EBA, 2012). The EBA concluded: “In line with the Recommendation, capital plans have not led directly to a significant reduction of lending into the real economy. A deleveraging process had already started before the capital exercise and will need to continue in an orderly fashion” (EBA, 2012).
2.2.
Efficiency and Capital Requirements
In banking, the capital structure is considered to be more significant than the other industries because of informational failures, principal-agent issues, bankruptcy costs, taxes and regulation. Capital acts as a buffer against loss, and hence failure with limited liability (Wang, 2014). The proclivity for commercial banks to engage in high-risk activities is cur-tailed when greater amounts of capital are at risk. Generally, it is expected that the capital adequacy ratio to exhibit a positive relationship with a bank’s value(Wang, 2014).
Numerous researchers have found that a higher capital adequacy will be resulting in smaller tax deduction or lower risk by having a higher proportion of equity to debt, which con-tributes towards the higher risk-taking behaviour. By having a higher capital adequacy ratio in place, it would be giving the depositors more confidence in a bank’s security and forms a type of internal fund resource. Additionally, it has been seen that the large banks tend to hold capital in excess of the most stringent regulatory requirements as a response to perceived risk exposures and in some instances, with an aim of maintaining their future profit streams(Chortareas, Girardone, and Ventouri, 2011). If the bank are required to have the capital more, the upside gains they would be enjoying from the greater risk taking would be countervailed by the potential downside loss of their capital. Therefore, it is significant to align the capital adequacy regulations with the incentives of banks with depositors and other creditors. This would be contributing towards more careful lending and a better bank performance. However, this belief is based on the public interest view and tend to ignore possible regulatory costs which would be in the form of high barrier to entry and greater rent extraction by the governments that result from higher capital requirements.
If the regulator decides to put capital regulations in place, then this would be influencing the following: - 1.The quantity and quality of lending made by the banks 2.The decision of the banks when allocating their asset portfolios 3.The decision of the banks in relation to the sources of their funds. As a result of these factors, the capital regulations would be affecting the efficiency of the banks. The capital regulations specifies the amount of capital which a bank must have at risk. If the bank is required to be holding more capital at risk, then the gains made from the high risk-taking would countervailed by the potential downside loss of their capital. Barth, Lin, Ma, Seade, and Song (2013b) found that the capital adequacy reg-ulations have a significant role in relation to the incentives of the bank with depositors and other creditors. This would be contributes in more careful lending practice and better bank performance. The capital regulations influences the decision of the banks regarding the mix of deposits and equity. The deposits and equity bears different costs for the bank. VanHoose (2007) investigated the effects of the capital regulations on the banks. He found that by having stricter capital regulations in place , the efficiency of the banks would be improving only if the regulatory screening ability is low. Additionally, if the regulatory screening ability is high, the efficiency would improve if there is loose capital regulations. When the capital regulations are placed, the banks are looking to substitute the loans with alternative forms of assets. The banks are looking to for different asset portfolios which would be generating better returns and requires the different resources to be managed. Therefore, the capital regulations raises questions about the bank’s management of its portfolio of different assets efficiently.
Barth et al. (2013b) investigated the efficiency of the banks in 72 countries for the period 1999 to 2007 using the worldwide surveys on bank regulation. When using DEA, they found that the tighter regulations on the banking activities have a negative impact on the bank efficiency. While greater capital restrictions are marginally and positively associated with the bank efficiency. There findings imply that there are potential trade-offs between bank soundness and efficiency. This means that the stricter capital regulations has weak rela-tionship with the bank efficiency. The stricter capital regulations would be contributing in reducing the bank risk, but not be a highly significant benefit for the efficiency gains. Pasiouras, Tanna, and Zopounidis (2009)investigated the impact of the banking regulations on bank’s cost and profit efficiency for banks operating in 74 countries during the period 2000-2004. They found that the stricter capital requirements would be improving the cost efficiency while reducing the profit efficiency. This would explained by having a stricter capital requirements, the likelihood of financial distress would be reduced , while the lower profit efficiency could be explained by the bank’s balance sheet getting more inclined towards liquid, lower return assets.
Moral hazard could defined as excessive risk-taking when another party is bearing part of the risk and could not be charged easily for or prevented from that risk taking. Most of the empirical research have found that the high capital ratios would be preventing moral hazard from taking place between shareholders and managers. This contributes towards in improving the efficiency of the banks. These research have investigated the conflicts between shareholders and managers. Usually they support the notion that both efficiency and capi-tal are relevant determinants of a bank’s risk taking and more hazard incentives.Berger and DeYoung (1997)found that the banks with less capital would be responding to the moral hazard incentives by taking higher portfolio risks. As a result, there would be a decrease in the capital ratios of the banks before the increase in non-performing loans for the banks with low capital ratios. This would be causing a decline in the efficiency levels of the banks. Barth, Caprio Jr, and Levine (2013a) found the relationship between the capital regulations and non-performing loans. There are less non-performing loans when rigorous capital regu-lations are in place.
Pasiouras, Gaganis, and Zopounidis (2006) used the country level data and bank level data from 71 countries and 857 banks to investigate the impact of bank regulations, supervision, market structure, and bank characteristics on individual bank ratings. Pasiouras (2008a) using DEA investigated the Greek commercial banks for the Greek commercial banks over the period 2000-2004. He found that there is a positive relationship between the capital requirements and technical efficiency. However, this is not statistically significant in the different combinations of inputs and outputs used in the DEA model. Defung, Salim, and Bloch (2016) investigated the technical efficiency of the banks in Indonesia for the period 1993-2011 by employing DEA. They found that the strengthening of the banking system with higher capital to asset ratios, higher minimum reserve requirements and enhanced su-pervision led to lower efficiency in the intermediation approach. However, these reforms have led to an increase in revenue efficiency.Santos (1999) used an intermediation model to study the efficiency and welfare implications of the banks’ minimum required capital–asset ratio. The results showed that a bank’s stability and efficiency would be improving if there is capital regulations in place. Chiu, Jan, Shen, and Wang (2008) investigated the efficiency of Taiwan banks for three-year period from 2000 to 2002 using DEA. They found that the average efficiency scores of banks with high capital adequacy are significantly higher than those of banks with lower capital adequacy. However, the period for their research is con-sidered to be very less for making any conclusions.
By controlling for bank specific , industry specific and macroeconomic variables, which are supposed to influence the efficiency , capital and risk relationship, Tan and Floros (2013) examined the relationship between efficiency , risk and capital in the Chinese banking
indus-try. They found that bigger banks (in terms of total assets) have higher technical efficiency. Furthermore, in a higher concentrated banking market, the technical efficiencies of Chinese banks are lower. Also, they found GDP growth rates have positive impact on the efficiency. Wheelock and Wilson (1995) using the micro-level historical data to examine the causes of bank failure. The results indicate that increasing inefficiency increases the probability of bank failure. The probability of failure would be higher for a bank which was less effi-cient at transforming labour , capital and financial inputs into earning assets and demand deposits.The lower a bank’s capital/assets or cash/deposits ratios, the more likely it was to fail.F¨are, Grosskopf, and Weber (2004)investigated the effect of the regulatory constraint such as risk-based capital constraint and leverage constraint on the efficiency. Using a sample of banks from 1990,1992 and 1994 Call Reports,they found that the relaxing the regulatory constraints leads to greater technical inefficiency. The results showed the significance of the regulatory constraints on the technical inefficiency.
Bitar, Saad, and Benlemlih (2016) investigated the impact of capital ratios on risk, efficiency and profitability in the Middle East and North Africa region using risk-based regulatory ra-tios and non-risk-based traditional capital rara-tios for the period 1999 to 2013. They found that the banks with higher capital ratios have higher loan loss reserves and are more effi-cient. They found that higher proportions of net loans in bank total assets improves the bank efficiency . Bitar, Pukthuanthong, and Walker (2018)analysed the impact of the cap-ital on risk, efficiency, and profitability of banks in 39 OECD countries during the period 1999-2013.They found that risk-based and non-risk based capital ratios increases bank effi-ciency. Their findings show that requiring highly liquid banks to hold higher capital may hinder their efficiency. The asset growth is positively associated with bank efficiency. Their results show bank size to have a positive relation with bank efficiency. This suggests that larger banks benefit from economies of scale. Additionally, they found that GDP growth is positively correlated with bank efficiency. The banks in countries with higher GDP growth are more efficient and more profitable. These banks tend to hold smaller loan loss reserves reflects favourable economic conditions. These studies show the significance of the bank specific, industry specific and macroeconomic variables on the bank efficiency.
3.
Methodology and Data
3.1.
Data Envelopment Analysis
Data Envelopment Analysis (DEA) has been widely used in the measuring the efficiency in the banks. DEA is a linear program in the form of piecewise linear combination which
presents a set of best practice observation and evaluates the performance by relating the input and outputs relating to the common efficiency frontier (Xu, Gan, and Hu, 2015) . DEA measures the relative efficiency in situations in which there are multiple inputs and outputs and there is no obvious objective way to aggregate either inputs or outputs into a meaningful index of productive efficiency(Holod and Lewis, 2011). In its basic form, considers a collection of decision-making units (DMU) each of which consumes DMU-specific levels of selected inputs to produce DMU-specific levels of selected outputs(Holod and Lewis, 2011). DEA makes no assumptions regarding the manner in which a DMU converts inputs into outputs. DEA establishes an efficiency frontier based on observed best performances and evaluates the efficiency of each DMU relative to this frontier. DMU that lie on the frontier is considered as efficient. When apply DEA in evaluating the performances of a set of banks, it is possible to form two groups such as one that comprise an efficient frontier and the other with the banks lying below the frontier (Titko, Stankeviˇcien˙e, and L¯ace, 2014). When DEA is applied, the efficiency scored is estimated as the ratio of weighted outputs to weighted inputs (Titko et al., 2014). The weights are selected for each variable of every analysed unit in order to maximize its efficiency score. Each DMU is assigned an efficiency score which ranges between 0 and 1. The score equal to 1 indicates an efficient DMU with respect to the rest DMUs in the sample. The first version of DEA assumes constant returns to scales (CRS) which means that a change in the inputs is followed by a change in same proportion of the outputs (Charnes, Cooper, and Rhodes, 1978). The output of this model is a score indicating the overall technical efficiency (OTE) of each DMU under CRS. In more technical terms, let us assume that there is data on K inputs and M outputs on each of N DMUs. For the ith DMU, these are represented by the vectors x
i and yi respectively. The K x N input
matrix , X , and the M x N output matrix , Y , represent the data for all N DMUs. The input oriented measure of a particular DMU , under CRS , is calculated as
M inθ,λθ (1)
s.t.−yi+Y λ≥0 (2)
θxi−Xλ ≥0 (3)
λ≥0 (4)
where θ ≥ 1 is the scalar efficient score and λ is N x 1 vector of constants. If θ = 1 the bank is efficient as it lies on the frontier, whereas ifθ < 1 the bank is inefficient and needs a 1 -θ reduction in the inputs levels to reach the frontier. The linear programming is solved N times, once for each DMU in sample, and a value of is obtained for each DMU representing
its efficiency score.
The choice of a model specification has a significant impact on the results of the research.It is well known that the DEA is sensitive to the variable selection. When selecting the model’s variables, statistically rigorous methods should be applied. The choice of number of variables selected is significant because the greater numbers of variables a DEA model has, the more efficient DMUs will be (Jenkins and Anderson, 2003). Therefore, it contributes in increase the number of the efficient banks. Additionally, the application of the DEA should be done with cautious and the factors such as country specific and industry-specific should be taken into consideration (Pasiouras, 2008b). For ensuring the validity of the DEA model specification, an isotonicity test should be conducted. An insotonicity test involves the calculation of all the inter-correlations between inputs and outputs for identifying whether increasing the amounts of inputs lead to greater outputs (Tsolas and Charles, 2015). If the inter-correlation between inputs and outputs is observed positive, the insotonicity test is passed. Therefore, the inclusion of inputs and outputs is justified.
In the following years, Banker, Charnes et al. (1984) employed a DEA model with variable returns to scale (VRS). This means VRS relaxes the constant returns to scale assumption and allows for the possibility that the bank’s production technology might exhibit increas-ing, constant or decreasing returns to scale. This model decomposes OTE into a product of two component. The first is the technical efficiency under VRS or pure technical efficiency (PTE). This relates to the ability of the managers to utilize firm’s given resources. The second is scale efficiency (SE). This relates to exploiting scale of economies by operating at a point where the production frontier exhibits CRS. The CRS linear programming is modified to consider VRS by adding the convexity by N1’ = 1, where N1 is a N 1 vector of ones. The technical efficiency scores obtained under VRS are higher than or equal to those obtained under CRS and SE could be obtained by dividing OTE with PTE. The VRS efficiency scores are higher or equal to the CRS efficiency scores because of the scale size of each DMUs.The present study would be reporting the efficiency estimates obtained under CRS. The efficiency scores obtained under CRS have been used by many earlier studies (Pasiouras, 2008a; Drake and Hall, 2003). The CRS assumption allows comparing large banks with smaller ones. DEA has been used for measuring the efficiency at level of bank branch , at country level and at multi-country level. Schaffnit, Rosen, and Paradi (1997) investigated the efficiency of Ontario based branches of a large Canadian bank. The results indicated that he most efficient branches tend to be more profitable and deliver better quality service. They found a strong effect of branch’s neighbourhood density on its performance. The efficiency at level of bank branch is useful for the bank management to improve their service quality and utilize the available resources more efficiently (Paradi and Zhu, 2013). The efficiency at country
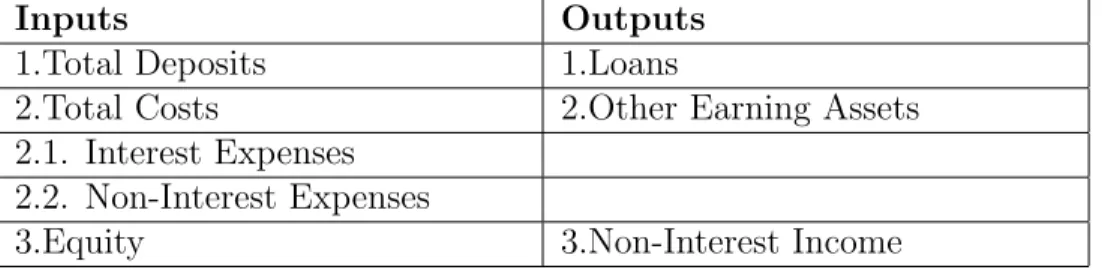
Inputs Outputs
1.Total Deposits 1.Loans
2.Total Costs 2.Other Earning Assets 2.1. Interest Expenses
2.2. Non-Interest Expenses
3.Equity 3.Non-Interest Income Table 1: Description of Inputs and Outputs for DEA.
level is important for the development of financial regulation and for financial regulators (Staub, e Souza, and Tabak, 2010). Jemric and Vujcic (2002) investigated the efficiency of Croatia banks.They found that the decision of the regulators to privatize and for the entry of foreign banks was correct decision. This contributed in an increase in efficiency and improv-ing the operation of the market participants. Pasiouras (2008b) investigated the impact of regulations and supervision on banks technical efficiency using a sample of 715 banks from 95 countries. This analysis provides a comprehensive analysis of relationship between bank efficiency and regulation and supervision approaches around the world. The cross-country analysis provides an international evidence.Therefore, this study adopts a cross-country ap-proach to provide an international evidence for the role of EBA’s capital exercise on the technical efficiency.
For measuring the bank efficiency, the input-oriented DEA models are most frequently used. The possible reason is that the bank managers have higher control over inputs rather than over outputs (Fethi, Pasiouras 2010). The input-oriented DEA model objects to max-imize the proportional reduction in inputs as much as possible so as to achieve relative efficiency, given the same output level .The input oriented model’s target is to minimize the inputs while adequately satisfying the given output level. The input-oriented DEA model allows to reduce inputs without changing outputs to achieve efficiency. These inputs reduc-tion or savings are defined as input slacks. The input slacks can be seen as an important indicator to help bank managers to improve their banks’ performances.
3.2.
Data and Variables
The focus is on the commercial banks because it would allow us to examine a more homo-geneous sample in terms of services and consequently inputs and outputs enhancing further the comparability among counties. The sample consists of the banks in 15 countries in Eu-rope with the financial data available from Market Intelligence for the period 2008-2015. The banks were excluded from the sample for one of the following reasons: - (i) they had no data available for any of the years, (ii) they had missing or negative values for the required
inputs/outputs, and (iii) they had missing values for the bank- specific control variables. The final sample consists of 194 banks in 15 countries in Europe. This is followed by splitting the sample into 2 sub-samples based on the announcement of the Capital Exercise. The first sub-sample is before the announcement is made and for the period 2008-2011. The sec-ond sub-sample is after the announcement and for the period 2012-2015. During the above procedure, we select the consolidated data only. The reports prepared under International Financial Reporting Standards are used where available, but if only reports prepared under local generally accepted accounting principles are available, then it is used. All the data was converted to Euro prior to downloading, using official exchange rates available in Market Intelligence. The country specific variable is downloaded from the World Bank.
There is an on-going debate in the banking literature relative to the proper definition of input and output. Berger and Humphrey (1997) identified two main approaches for the selection of inputs and outputs. These are the ‘production approach ‘and the ‘intermediation approach’. The production approach assumes that the banks produce loans and deposits account ser-vices by using labour and capital as inputs, and that the number and type of transactions measure the outputs. The intermediation approach perceives the banks as financial inter-mediaries between savers and investors. Berger and Humphrey (1997) argues that neither of these two approaches are perfect because they cannot fully capture the dual role of financial institutions as providers of transactions and also being financial intermediaries. Moreover, they point out that the production approach is better for evaluating the efficiencies of bank branches and the intermediation approach is more appropriate for evaluating financial insti-tutions as a whole. For production approach, there are difficulties in collecting the detailed transaction flow information. Therefore, the intermediation approach is more preferred in the literature.
Recently, Drake, Hall, and Simper (2006) proposed a ‘profit oriented approach’. This ap-proach defines revenue components as outputs and cost components as inputs. They point out that their results are suited to capture the diversity of strategic responses by financial firms in the face of dynamic changes in competitive and environmental conditions. Gener-ally, inputs are those which are desirable to be minimal and outputs are those which are desired to be maximized. In DEA, both input orientation and output orientation could be used for solving the problem. In input oriented model, the inputs are minimized whereas in the output oriented model, the outputs are maximized.
The review of the cross-country studies indicates that the intermediation approach is most commonly used. This is consistent with the modern empirical literature of studies which ex-amines individual countries. Following these studies, the intermediation approach is adopted. The model is estimated using 3 inputs and 3 outputs. The inputs are total deposits, total
costs which consists of interest expenses and non-interest expenses and equity. For maxi-mizing profits, the minimazation of total cost is needed (Casu and Molyneux, 2003). Con-sequently, total cost is used. Equity is used to control for the differences in risk preferences (Pasiouras, 2008a) (Drake and Hall, 2003). The outputs are loans, other earning assets and non-interest income. In the study ,Total Loans produced by the bank is used as an out-put because this activity is highly resource consuming, with substantial value added (Berg, Førsund, Hjalmarsson, and Suominen, 1993). Numerous studies have used non-interest in-come as a proxy for off-balance sheet activities (Pasiouras, 2008).
3.3.
Tobit Regression Analysis
Numerous studies which have suggested ways in which environmental variables could be accommodated in DEA analysis. The environmental variables are described as the factors which could influence the efficiency of the bank. In this case, such factors are not the tradi-tional inputs and are assumed to be outside the control of the manager (Sufian, 2009). The DEA scores falls between 0 and 1 making the dependent variable a limited dependent vari-able.Ordinary Least Squares(OLS) ,Maximum Likelihood estimation(MLE) and Tobit model could be employed for the second-stage analysis. Banker and Natarajan (2008) showed that OLS ,MLE and Tobit model in the second stage significantly outperform the parametric methods.The previous studies which have investigate the bank efficiency, have used the Tobit model. This is because it could handle the characteristics of efficiency measures. Therefore, providing the results which could provide important policy guidelines to improve performance. Accordingly, DEA scores obtained in the first stage is used as a dependent variable in the second stage and are regressed against bank characteristics, macroeconomic conditions, financial development and market structure. The standard Tobit model can be defined as follows for observation (bank) i:
yi∗ =β0xi+i;if y∗i≥0andyi = 0, Otherwise(5)
wherei ∼N(0, σ2),xi and β are vectors of explanatory variables and unknown parameters, respectively, while y∗i is a latent variable and yi is the DEA efficiency score.
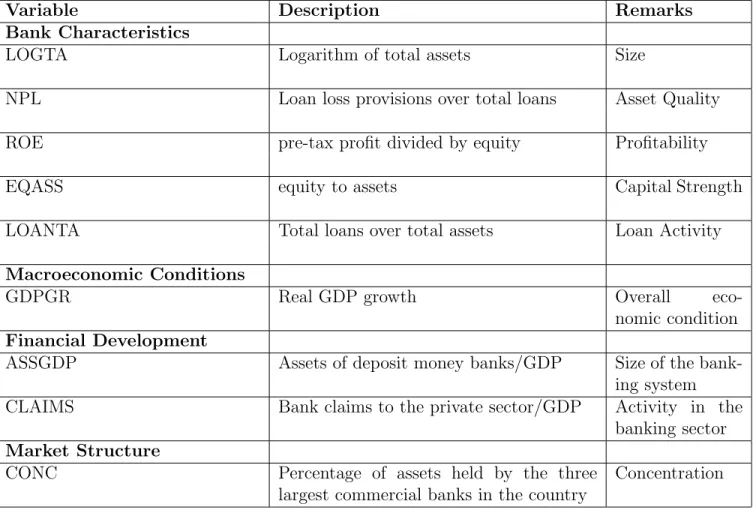
In this study, the bank characteristics, macroeconomic conditions, financial development and market structure would be used.
y∗it=β0+β1LOGT Ait+β2EQASSit+β3N P Lit+β4ROEit+β5LOAN T Ait+it(6) whereyit∗ is the technical efficiency of theithbank obtained in period t.The first model would
be using bank characteristics. The bank specific variables are: LOGTA is the logarithm of bank’s assets and controls for bank’s size; NPL is loan loss provisions over total loans and is a measure of Asset Quality; ROE is the pre-tax profit divided by equity; EQASS is equity to assets ratios and is measure for the capital strength of the bank and LOANTA is total loans over total assets and is a measure of loan activity. These variable have been used in the past studies to reveal the bank specific characteristics which have an impact on the efficiency (Pasiouras, 2008b; Pasiouras et al., 2006).
y∗it=β0+β1LOGT Ait+β2EQASSit+β3N P Lit+β4ROEit+β5LOAN T Ait+β6GDP GRit+it (7)
where y∗it is the technical efficiency of the ith bank obtained in period t. The second model would be using bank characteristics and macroeconomic conditions. Earlier studies have used different variables for controlling the macroeconomic conditions. In this study, for annual growth in GDP is used for controlling the macroeconomic condition. Earlier studies have found that the favourable conditions would be affecting positively the demand of supply of banking services and would possibly contribute towards an improvement in the bank’s efficiency.Maudos, Pastor, Perez, and Quesada (2002) found that the banks operating in expanding markets proxy by the real growth rate of GDP present higher levels of profit efficiency. However, under expansive demand conditions, banks would feel less pressurised to control their costs and could be less cost efficient.
yit∗ =β0 +β1LOGT Ait+β2EQASSit+β3N P Lit+β4ROEit+β5LOAN T Ait +β6ASSGDPit+β7CLAIM Sit+it
(8)
where yit∗ is the technical efficiency of the ith bank obtained in period t.The third model would be incorporating both bank characteristics and financial development. Numerous studies have found that overall financial development, measured by banking market size and levels of monetarization contributes to higher efficiency. In this study, these two variables are used for controlling for the development of the financial sector. These measures have been used in the studies of Demirg¨u¸c-Kunt and Huizinga (1999) ,Pasiouras (2008b) and Caprio, Barth, Levine, et al. (2008). The banking market size is calculated by dividing Assets of deposit money banks with GDP. The monetarization is calculated by dividing Bank claims
to the private sector with GDP.
y∗it=β0+β1LOGT Ait+β2EQASSit+β3N P Lit+β4ROEit+β5LOAN T Ait+β6CON Cit+it (9)
whereyit∗ is the technical efficiency of theithbank obtained in period t. Model 4 would be in-cluding bank characteristics and market structure. T The study also controls for differences in the market structure among countries. This is done by using the degree of concentration. Earlier studies have found that less concentrated markets have a higher efficiency. This mea-sure has been used in the studies of Pasiouras (2008b) and Beck, Demirg¨u¸c-Kunt, and Levine (2006). This is measured as the percentage of assets held by the three largest commercial banks in the country.
y∗it=β0+β1LOGT Ait+β2EQASSit+β3N P Lit+ +β4ROEit+β5LOAN T Ait+β6GDP GRit +β7ASSGDPit+β8CLAIM Sit+β9CON Cit+it
(10) Model 5 would be incorporating bank characteristics, macroeconomic conditions, financial development and market structure.
This model would be incorporating bank characteristics, macroeconomic conditions, fi-nancial development and market structure.
4.
Results
4.1.
Descriptive Statistics
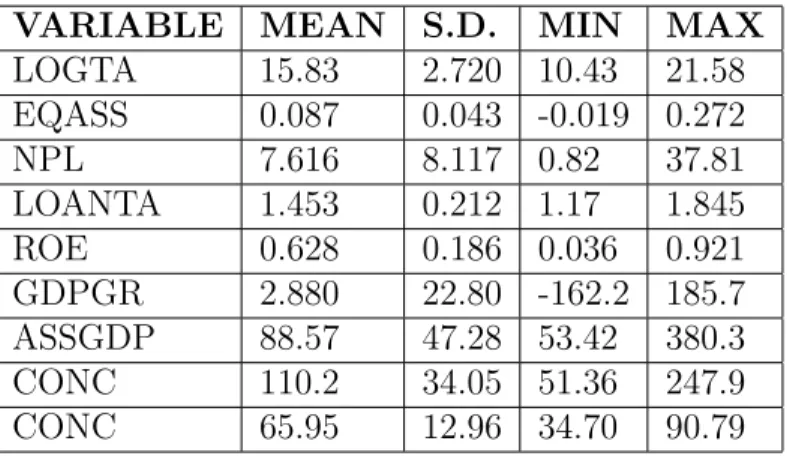
rotating Table 3 shows the descriptive statistics for the inputs and outputs. From 2008 to 2015, the deposits and the equity are increasing. Both are increasing over the time. However, the interest expenses and the non-interest expenses are both decreasing. But, the interest expenses have decreased tremendously over the time while the non-interest expenses have decreased but not as much as compared to the interest expenses. Loans and Non-interest income have increased over the time. However, the other earning assets have decreased from 2008 to 2015.
Tables 4 and 5 shows the descriptive statistics for the bank characteristics, macroeconomic conditions, financial development and market structure. From 2008 to 2015, EQASS which measures capital strength has increased. Moreover, ROE has increased tremendously over time which shows that profitability of the bank. However, NPL, LOANTA and LOGTA have
Variable Description Remarks Bank Characteristics
LOGTA Logarithm of total assets Size
NPL Loan loss provisions over total loans Asset Quality ROE pre-tax profit divided by equity Profitability
EQASS equity to assets Capital Strength
LOANTA Total loans over total assets Loan Activity
Macroeconomic Conditions
GDPGR Real GDP growth Overall
eco-nomic condition
Financial Development
ASSGDP Assets of deposit money banks/GDP Size of the bank-ing system CLAIMS Bank claims to the private sector/GDP Activity in the
banking sector
Market Structure
CONC Percentage of assets held by the three largest commercial banks in the country
Concentration
Table 2: Description of variables used in the regression model
diminished from 2008 to 2015. ASSGDP has diminished from 2008 to 2015. Additionally, CONC has increased slightly from 2008 to 2015. The financial development variables have negligible change from 2008 to 2015.
4.2.
First Stage DEA Results
The observations for each specific bank , for each country and year are pooled together in two samples :- 2008-2011 and 2012-2015. This is followed by running two DEA models , one for each sample. Each sample consists of 194 banks for each year. In total, each sample has 776 banks. The minimum number of the banks each country in the sample for each year is 4 and the maximum number for each year is 33. Table 6 and 7 presents the results of the DEA under constant returns to scale (CRS) and variable returns to scale(VRS) respectively. The panel in table 6 and 7 shows the average Technical Efficiency scores of the banks that are experiencing constant returns to scale and variable returns to scale. Under CRS, The mean of the Technical Efficiency for the banks in the sample equal .505 and .488 for before
V ariable 2008 2009 2010 2011 2012 2013 2014 2015 Dep osit Mean 52400000 53100000 55000000 56300000 59500000 58500000 61600000 65000000 S.D. 134000000 134000000 138000000 142000000 148000000 145000000 157000000 166000000 Equit y Mean 5349452 6761916 7283694 7169484 7536249 7560048 8239445 8606792 S.D. 13300000 16700000 17800000 18200000 19100000 18500000 20900000 22000000 In t.Exp Mean 4666960 2844893 2327744 2463533 2371708 1889525 1645910 1484753 S.D. 13000000 8149185 6407363 6545241 6098041 4730433 4293166 4036147 Non In t.Exp Mean 1953227 1934418 2001219 1973271 1940402 1867585 1808732 1927158 S.D. 6314649 5545554 5554227 5210248 5128914 4921805 4781882 5222499 Loan Mean 64300000 66800000 68700000 67500000 66400000 63300000 65000000 67100000 S.D. 150000000 155000000 155000000 155000000 151000000 144000000 151000000 157000000 NonIn tIncome Mean 1057409 1323670 1387369 1142897 1175542 1214294 1139254 1245262 S.D. 4634710 4157407 4220948 4026918 3378774 3471395 3167228 3522942 Ote Mean 117000000 106000000 110000000 113000000 112000000 103000000 109000000 104000000 S.D. 397000000 337000000 348000000 364000000 359000000 329000000 349000000 332000000 T able 3: Descriptiv e Statistics for the Inputs and the Outputs for DEA rep orted in Euros.
VARIABLE MEAN S.D. MIN MAX LOGTA 16.28 2.623 10.28 21.53 EQASS 0.079 0.090 -0.305 0.976 NPL 7.725 8.455 0.821 37.81 LOANTA 0.647 0.192 0.000 0.889 ROE -13.70 220.9 -2956.6 41.15 GDPGR 1.826 1.719 -0.356 9.512 ASSGDP 88.75 48.97 47.02 380.3 CLAIMS 110.2 34.81 51.36 247.9 CONC 65.26 13.11 34.70 90.79
Table 4: Descriptive Statistics for the control variables before 2011
VARIABLE MEAN S.D. MIN MAX
LOGTA 15.83 2.720 10.43 21.58 EQASS 0.087 0.043 -0.019 0.272 NPL 7.616 8.117 0.82 37.81 LOANTA 1.453 0.212 1.17 1.845 ROE 0.628 0.186 0.036 0.921 GDPGR 2.880 22.80 -162.2 185.7 ASSGDP 88.57 47.28 53.42 380.3 CONC 110.2 34.05 51.36 247.9 CONC 65.95 12.96 34.70 90.79
Table 5: Descriptive Statistics for the control variables after 2011
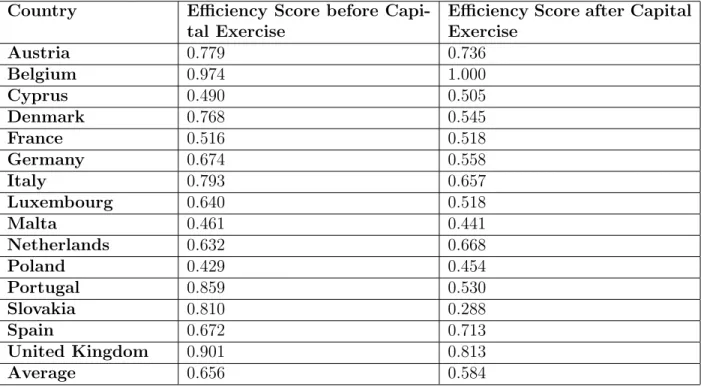
and after the capital exercise announcement was made by the EBA respectively. Before the announcement, the average bank could improve its technical efficiency by 49.48%. But, after the announcement, the average bank could be improving its technical efficiency by 51.12%. In other words, if the average bank was producing on the frontier instead of its current location, only 50.52% of the inputs currently being used would be necessary to produce the same output vector. However, after the announcement, only 48.88% of the inputs currently being used would be necessary to produce the same output vector. Under VRS, The mean of the Technical Efficiency for the banks in the sample equal .656 and .488 for before and after the capital exercise announcement was made by the EBA respectively. Before the exercise, the average bank could improve its technical efficiency by 34.41%. However, after the exercise, the average bank could improve its technical efficiency by 41.65%. n other words, if the average bank was producing on the frontier instead of its current location, only 34.41% of the inputs currently being used would be necessary to produce the same output vector. However, after the announcement, only 41.65% of the inputs currently being used would be necessary to produce the same output vector. Table 8 shows the
Kolmogorov-COUNTRY Efficiency Score before Capi-tal Exercise
Efficiency Score after Capital Exercise Austria 0.726 0.655 Belgium 0.557 0.836 Cyprus 0.448 0.463 Denmark 0.430 0.435 France 0.504 0.475 Germany 0.438 0.450 Italy 0.552 0.475 Luxembourg 0.555 0.444 Malta 0.563 0.632 Netherlands 0.653 0.513 Poland 0.671 0.614 Portugal 0.379 0.287 Slovakia 0.572 0.566 Spain 0.484 0.455 United Kingdom 0.426 0.488 Average 0.505 0.488
Table 6: DEA Results for banks under Constant Returns to Scale before the capital exercise and after capital exercise.
Country Efficiency Score before Capi-tal Exercise
Efficiency Score after Capital Exercise Austria 0.779 0.736 Belgium 0.974 1.000 Cyprus 0.490 0.505 Denmark 0.768 0.545 France 0.516 0.518 Germany 0.674 0.558 Italy 0.793 0.657 Luxembourg 0.640 0.518 Malta 0.461 0.441 Netherlands 0.632 0.668 Poland 0.429 0.454 Portugal 0.859 0.530 Slovakia 0.810 0.288 Spain 0.672 0.713 United Kingdom 0.901 0.813 Average 0.656 0.584
Table 7: DEA Results for banks under Variable Returns to Scale before the capital exercise and after capital exercise.
Group
Efficiency
P-Value
Before Capital Exercise
0
1.000
After Capital Exercise
-0.495
0.023
Combined K-S:
0.495
0.046
Table 8: Kolmogorov-Smirnov Test for DEA results under CRS
Smirnov Test DEA results under CRS before and after the capital exercise announce. The efficiency of the banks before the capital exercise is larger than for the banks after capital exercise.The largest difference between the distribution functions in this direction is 0.495. The approximate p-value for this difference is 0.023. This shows that the difference between efficiency after the capital exercise is highly significant at 5% level.
Under CRS, Before the Capital Exercise was announced, the most efficient countries appeared to be Austria and Poland. After the Capital Exercise is announced, the most efficient countries appeared to be Belgium and Austria. In general, the efficiency scores of the banks have changed after the announcement of the capital exercise. The efficiency scores of the banks in most of the countries have changed after the announcement. The efficiency of the banks in most of the banks have declined. Only the efficiency of the banks in Belgium, Germany, Malta, Denmark, Cyprus and the United Kingdom have improved. However, the efficiency of the banks in Denmark after the announcement is negligible. The efficiency of the banks in Portugal have the worst efficiency scores after the capital announcement. The efficiency of the banks got worse because financial crisis in Portugal. The debt of Portugal kept on rising. It was only in 2014, Portugal left EU bailout mechanism without requiring any more support.
Under VRS, before the Capital Exercise, the most efficient countries appeared to be Belgium and United Kingdom. After the the Capital Exercise, Belgium and United Kingdom still remain to be most efficient. After the exercise,the efficiency scores of most of the banks have changed. Most of the banks witnessed a decline in their efficiency scores. Only the efficiency of the banks in Belgium, Spain, Cyprus, France ,Netherlands and Poland have improved. After the capital exercise, the banks in Slovakia have the worst efficiency scores. The us because of massive regional differences, high long-term unemployment and the lower quality of the business environment and public administration.Also, the slowdown of many big Eurozone economies likely had their impacts on the export-oriented Slovak economy.
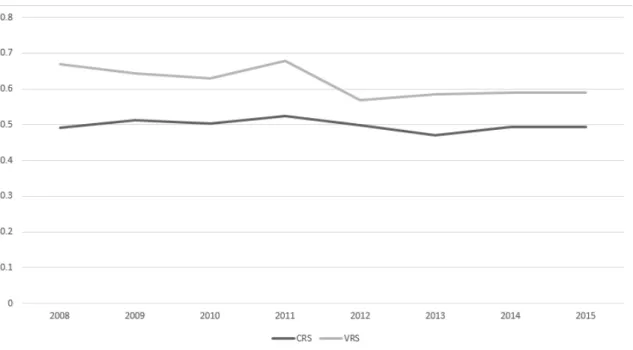
Figure 1 shows the average efficiency of the banks under CRS and VRS from 2008 to 2015. The efficiency of the bank was increasing and decreasing till 2011. This could be explained by the changes in the inputs and output over the years. The inputs such as Interest Expenses and Non-Interest Expenses have been increasing and decreasing over time
Fig. 1. - Efficiency of the banks in 15 EU countries over time under Constant Returns to Scale and Variable Returns to Scale
Fig. 2. - Efficiency of the banks in 15 EU countries over time under Constant Returns to Scale
Scale of Returns P-value Null Hypothesis Rejected Null Hypothesis Level
CRS 0.05 FALSE 0.844
VRS 0.01 TRUE 0.936
Table 9: Returns to Scale Test for DEA models.
till 2011. The outputs are increasing and decreasing as well during this time. However, after 2011, the efficiency of the banks is decreasing till 2013. During this time, the inputs such as Deposits and Costs are decreasing while the outputs such Loan and Other earning assets are decreasing as well. However, the efficiency scores increase from 2013. The inputs such as deposit, equity and interest expenses are increasing whereas the outputs such as Other Earning Assets and Loans are increasing. The efficiency of the banks becomes steady from 2014 onwards. The changes in the inputs and the outputs while increasing and decreasing are not drastic. The EBA capital exercise made the banks to reconsider their activities. As a result, there was decrease in the efficiency of the banks which lasted till 2013. However, after 2014, the efficiency of the banks has become steady which reflects the activity of the bank is steady in terms of the inputs and outputs. But, this was not the case before the 2011 capital exercise announcement.
The Global Financial Crisis hit the Europe in 2008. The efficiency of the banks fell to the lowest level during this time. In the following year, the efficiency of the banks started improving. However, in 2010, the Sovereign Debt Crisis hits the Europe. This has resulted in the efficiency of the banks to decrease again. After the capital exercise is announced, the efficiency of the banks have fell down. This is because the banks have to restructure their balance sheets and maintain the required targets which have been set by the EBA. The efficiency of the banks continue to fall because of the crisis in Ireland. But, in the following years, it starts to improve. This is helped by improvement in the stock market. The EBA capital exercise requirements have helped the bans maintain their efficiency levels in the following years. During these years, the Europe was once again on the brink of recession. With Greece starting to cause panic. Furthermore, this was accompanied by inflation falling to record low in the Eurozone and collapse of the oil price. The EBA capital exercise requirements have contributed in allowing the banks to maintain their efficiency levels during the years of turmoil. Additionally, the inputs and outputs of the banks became steady because of the capital exercise.
In this study, CRS scores are used for conducting the Second stage analysis. Simar and Wilson (2002)’s Returns to scale(RTS) test is performed. Table 12 shows the returns to scale test for DEA models. The RTS test show that under CRS, the null hypothesis is not rejected at 5% significance level. But, under VRS, the null hypothesis is rejected at 1%
significance level.
4.3.
Second-stage Analysis – Tobit Regression
In the second stage of the analysis, we investigate the determinants of the efficiency by estimating an econometric model using the DEA efficiency scores as the dependent variable. In the earlier studies, due to the limited nature of our efficiency measure that ranges between 0 and 1, this study uses a Tobit regression rather than OLS. F-test has been used in the study for measuring the significance of the model. The p-value of F-test is less than 5% in all the models. This shows the model is a better fit. Following Pasiouras et al. (2006) and Pasiouras (2008b), QML (Huber/White) standard errors and covariates are calculated. This is because heteroskedasticity can emerge when estimated parameters are used as dependent variables in the second stage analysis.
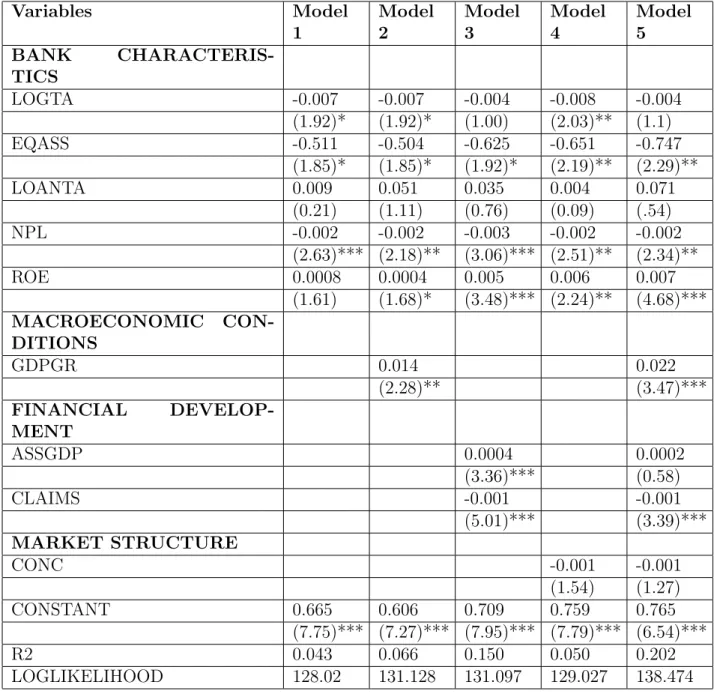
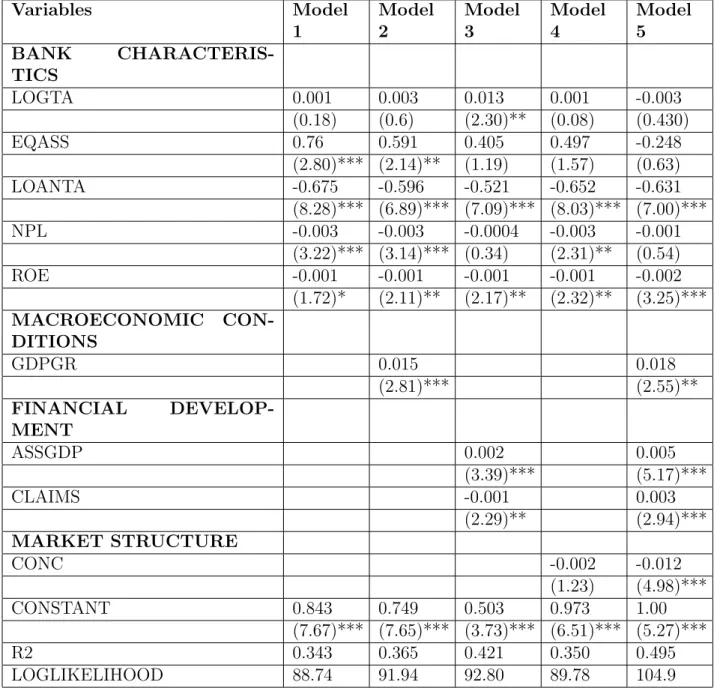
4.3.1. Controlling for bank-specific characteristics
Tables 10 and 11 presents the regression results when controlling only for bank-specific characteristics. The results provide with evidence in favour of the capital exercise used by the EBA to promote the efficiency of the banks using the determinants of the efficiency. Before the announcement, ROE is not having an impact on the inefficiency of the bank. After the announcement, ROE is having a negatively significant impact on the efficiency of the bank. This finding indicates that the more profitable banks have lower inefficiency. This corroborates with similar findings of the other studies (Pastor, Perez, and Quesada, 1997; Das and Ghosh, 2006). Banks which are reporting higher profitability ratios are usually preferred by the clients. Therefore, they attract the biggest share of deposits along with the best potential credit worthy borrowers. Moreover, this implies that the banks might be having a higher ROE by either having a higher leverage (debt) or higher risk taking. The capital exercise has aimed to reduce these activities of the banks. As a result, these conditions create a favourable environment for the profitable banks to be more efficiency from the point of view of their intermediation activities. Before and after the capital exercise, NPL is having a highly negative significant impact on the inefficiency. This is consistent with the earlier finding by among other, Kwan, Eisenbeis, et al. (1995); Resti (1997). These results imply that the banks be focusing on the credit risk management which has been proven to be problematic in the past. Serious banking problems have arisen from the failure of the banks to recognize impaired assets and create reserves for writing off these assets. Before the announcement, EQASS exhibits negative relationship with bank efficiency. The findings imply that the more efficient banks, use less equity compared to its peers. The results seems
Variables Model 1 Model 2 Model 3 Model 4 Model 5 BANK CHARACTERIS-TICS LOGTA -0.007 -0.007 -0.004 -0.008 -0.004 (1.92)* (1.92)* (1.00) (2.03)** (1.1) EQASS -0.511 -0.504 -0.625 -0.651 -0.747 (1.85)* (1.85)* (1.92)* (2.19)** (2.29)** LOANTA 0.009 0.051 0.035 0.004 0.071 (0.21) (1.11) (0.76) (0.09) (.54) NPL -0.002 -0.002 -0.003 -0.002 -0.002 (2.63)*** (2.18)** (3.06)*** (2.51)** (2.34)** ROE 0.0008 0.0004 0.005 0.006 0.007 (1.61) (1.68)* (3.48)*** (2.24)** (4.68)*** MACROECONOMIC CON-DITIONS GDPGR 0.014 0.022 (2.28)** (3.47)*** FINANCIAL DEVELOP-MENT ASSGDP 0.0004 0.0002 (3.36)*** (0.58) CLAIMS -0.001 -0.001 (5.01)*** (3.39)*** MARKET STRUCTURE CONC -0.001 -0.001 (1.54) (1.27) CONSTANT 0.665 0.606 0.709 0.759 0.765 (7.75)*** (7.27)*** (7.95)*** (7.79)*** (6.54)*** R2 0.043 0.066 0.150 0.050 0.202 LOGLIKELIHOOD 128.02 131.128 131.097 129.027 138.474 Table 10: Regression results before capital exercise. Model 1 controls for the bank charac-teristics. Model 2 controls for bank characteristics and Macroeconomic Conditions. Model 3 controls for bank characteristics and financial development. Model 4 controls for bank char-acteristics and Market structure. Model 5 controls for bank charchar-acteristics, macroeconomic conditions, financial development and market structure. QML (Huber/White) standard errors and covariates have been calculated to control for heteroscedacity (***statistically significant at 1% level, **Statistically significant at 5% level, *Statistically significant at 10% level)
Variables Model 1 Model 2 Model 3 Model 4 Model 5 BANK CHARACTERIS-TICS LOGTA 0.001 0.003 0.013 0.001 -0.003 (0.18) (0.6) (2.30)** (0.08) (0.430) EQASS 0.76 0.591 0.405 0.497 -0.248 (2.80)*** (2.14)** (1.19) (1.57) (0.63) LOANTA -0.675 -0.596 -0.521 -0.652 -0.631 (8.28)*** (6.89)*** (7.09)*** (8.03)*** (7.00)*** NPL -0.003 -0.003 -0.0004 -0.003 -0.001 (3.22)*** (3.14)*** (0.34) (2.31)** (0.54) ROE -0.001 -0.001 -0.001 -0.001 -0.002 (1.72)* (2.11)** (2.17)** (2.32)** (3.25)*** MACROECONOMIC CON-DITIONS GDPGR 0.015 0.018 (2.81)*** (2.55)** FINANCIAL DEVELOP-MENT ASSGDP 0.002 0.005 (3.39)*** (5.17)*** CLAIMS -0.001 0.003 (2.29)** (2.94)*** MARKET STRUCTURE CONC -0.002 -0.012 (1.23) (4.98)*** CONSTANT 0.843 0.749 0.503 0.973 1.00 (7.67)*** (7.65)*** (3.73)*** (6.51)*** (5.27)*** R2 0.343 0.365 0.421 0.350 0.495 LOGLIKELIHOOD 88.74 91.94 92.80 89.78 104.9 Table 11: Regression results after capital exercise. Model 1 controls for the bank character-istics. Model 2 controls for bank characteristics and Macroeconomic Conditions. Model 3 controls for bank characteristics and financial development. Model 4 controls for bank char-acteristics and Market structure. Model 5 controls for bank charchar-acteristics, macroeconomic conditions, financial development and market structure. QML (Huber/White) standard errors and covariates have been calculated to control for heteroscedacity (***Statistically significant at 1% level, **Statistically significant at 5% level, *Statistically significant at 10% level)
to suggest that the less efficient banks could have been involved in riskier operations and in the process tend to hold more equity, voluntarily or involuntarily, i.e., the reason might be banks’ deliberate efforts to increase safety cushions and in turn decrease the cost of funds or perhaps regulatory pressures that mandate riskier banks to carry more equity. However, after EQASS has a significant positive impact on the efficiency. By having a higher capital, the EBA has aimed in improving the confidence of depositors in bank’s security. Additionally, it would be creating an environment for careful lending and better bank performances. It would be reducing the likelihood of financial distress faced by the banks (Pasiouras et al., 2009).LOANTA has a significantly negative impact on the technical efficiency of the bank. This is in line with the findings of Havrylchyk (2006)who found a negative relationship between LOANTA and efficiency. This ratio is considered as a proxy for Liquidity risk. Therefore, the negative relationship could indicate that less efficient banks are also less liquid. Before the capital exercise took place, EQASS and NPL have a negative correlation with the Efficiency of the bank. A 1% increase in the bank efficiency would require the bank’s EQASS to reduce by 1.95%.Similiarily, a 1% increase in the bank efficiency would require the bank’s NPL to reduce by 5%.After the Capital Exercise, EQASS has a positive correlation with the efficiency. This means that to increase the bank efficiency by 1%, the bank would be required to improve EQASS by 1.31%. This reflects the significance of the contribution of the capital strength towards the bank efficiency. Furthermore, a 3% decrease in NPL would be contributing in 1% increase in the efficiency. LOANTA is having a negative impact after the capital exercise on the bank efficiency. These results indicate that the capital exercise is influencing the quantity and quality of lending made by the banks and the decision of the banks when allocating their asset portfolios. Therefore, Capital Exercise would be affecting the efficiency of the bank. These findings are in line with findings of Barth et al. (2013b) who found that the capital regulations have a significant role to play in relation to the incentives of the banks with depositors and other creditors. Additionally, the capital regulation would be contributing towards having less non-performing loans. Moreover, the capital requirements by the EBA would be reducing the likelihood of financial distress. As the balance sheet of the bank is getting more inclined towards liquidity than lower return assets (Pasiouras et al., 2009). The EBA announcement has contributed towards bank getting engaged in more profitable activities. As a result, they would be able to attract the best potential credit worthy borrowers who would be able to meet the obligations. This could be resulting in banks having less loan loss. Moreover, these conditions would be creating an environment for the banks to become more profitable and efficient.
4.3.2. Controlling for Macroeconomic Conditions
Table 10 and 11 shows the regression results when controlling for the macroeconomic conditions. The growth of the GDP in the model affects the other bank-specific variables. Before the announcement of the capital exercise was made, GDPGR does have a signifi-cant impact on the technical efficiency of the banks. However, after the capital exercise announcement, GDPGR has a statistically significant impact on the technical efficiency. This indicates that favourable economic conditions affect the extent, depth and quality of financial intermediation and banking services. This contributes towards making the financial institutions more efficient. Furthermore, by having a higher growth rate, it would be easier for the debtors to meet their obligations. The other variables having significant impact on the efficiency are EQASS, LOANTA ,NPL and ROE. Before the capital exercise, GDPGR was positively correlated with the efficiency. This meant that to increase the bank efficiency by 1%, the bank would be required to reduce GDPGR by .7%. After the Capital Exercise, the magnitude of GDPGR is positive. This means that to increase the bank efficiency by 1%, the bank would be required to improve GDPGR by .6%. This reflects the significance of the contribution of the real GDP growth towards the bank efficiency. After capital exercise, there is a marginal decrease in the contribution of GDPGR towards the bank efficiency. However, the results reflect that significance of favourable economic conditions towards the banking activity (Chortareas et al., 2011). This would be making the bank become more efficient.
4.3.3. Controlling for financial development
The regression results indicate that after controlling for the financial development for before the capital announcement, CLAIMS and ASSGDP are having significant impact on the efficiency. Both CLAIMS and ASSGDP continue to have a significant impact after the capital exercise. The results show that both the activity in the market and size of the market have an impact on the efficiency. CLAIMS has a negative impact while ASSGDP has a positive impact on the efficiency. The capital regulations influences the decision of the banks regarding the mix of deposits and equity. The deposits and equity bears different costs for the bank. Furthermore, the capital requirements would be leading to careful lending and better performance. The results indicate that the capital requirements would be reducing the bank risk, but not be a highly significant benefit for the efficiency gains. When the capital regulations are placed, the banks are looking to substitute the loans with alternative forms of assets. The banks are looking to for different asset portfolios which would be generating better returns and requires the different resources to be managed. Additionally, the capital
requirement by the EBA would be preventing the banks for excessive risk-taking. It would requiring the banks to for different asset portfolios which would be generating better returns and requires the different resources to be managed. Furthermore, it would contributing towards the banks having a decline in non-performing loans(Berger and DeYoung, 1997). The EBA capital announcement has made the banks consider their activity in the banking sector and to manage their portfolios. As a result, the banks would be having less likelihood of having a financial distress.
4.3.4. Controlling for market structure
The results when controlling for the market structure are quite similar to the results when controlling for the financial development. CONC does not have any significant impact on the efficiency of the bank before and after the capital announcement. However, after the announcement, LOANTA and NPL have a negatively significant impact while ROE has a positive significant impact on the efficiency of the bank. Before the capital exercise, the CONC was negatively correlated with efficiency of the bank. This meant that to increase the bank efficiency by 1%, the bank would be required to reduce CONC by 10%. After the Capital Exercise, CONC is still negatively correlated with efficiency of the bank. This means that to increase the bank efficiency by 1%, the bank would be required to improve CONC by 5%. This reflects the contribution of the EBA capital exercise towards the efficiency of the bank. Additionally, the less concentrated markets are associated with increase in efficiency. 4.3.5. Controlling for all the variables
When controlling for Bank characteristics, Macroeconomic conditions, Financial Devel-opment and Market Structure, the results before the announcement are quite similar to the results of controlling for market structure. However, the results changes after the announce-ment. GDPGR, ASSGDP AND CLAIMS are statistically significant and positively related to the technical efficiency of the bank. ROE is negatively significant to the technical effi-ciency of the bank. However, LOANTA and CONC have significantly negative impact on the efficiency of the bank. LOANTA is proxy for liquidity. If the bank is having a higher loan to assets ratio, then it would be having less liquidity. Also, less concentrate markets are associated with higher efficiency. The regression results indicate that CONC is statistically significant and negatively related to technical efficiency. This shows that the less concen-trated markets are associated with increased efficiency. This is consistent with the results of (Pasiouras, 2008a). The high concentrated banking systems exhibit levels of systemic risk potential higher than the less concentrated systems during the period 1993-2000, and this
relationship was strengthened during the 1997-2003 period (Nicol´o, Bartholomew, Zaman, and Zephirin, 2004).Pasiouras et al. (2006) reported a negative relationship between concen-tration and bank’s overall performance and soundness as measured by Fitch ratings. Before the capital exercise, the magnitude of EQASS was negative. This meant that to increase the bank efficiency by 1%, the bank would be required to reduce EQASS by 1.33%. The bank efficiency would be improved by 1% if the bank reduces NPL by 5%. GDPGR, CLAIMS and CONC has economic significance on the efficiency of the bank. After the Capital Exercise, the magnitude of EQASS is positive. But, it is not having economic significance on the efficiency of the bank. LOANTA, NPL and CONC are negatively economic significant on the efficiency of the bank while CLAIMS is a positively economic significant. The results indicate that the capital exercise would be creating favourable economic conditions. The banks would be becoming more involved in more careful lending. Additionally, the decision of the banks would be influenced when allocating their asset portfolios. The banks would be looking at different asset portfolios which would be generating better returns and requiring the different resources to be managed. The capital regulation would be contributing in banks having fewer non-performing loans. The results indicate that the capital exercise would be preventing banks from moral hazard incentives. This is in line with the findings of Berger and DeYoung (1997) who found that the banks with more capital would be involved in lower portfolio risk taking. This shows higher capital requirements would be contributing towards lower non-performing loans. This would be leading towards an increase in the efficiency of the bank. The EBA’s capital announcement has aimed to make the banking market less concentrated. This would be contributing in having banks less prone to potential systemic risk. Furthermore, it would improving the overall performance of the banks and the sound-ness of the banks The EBA announcement has contributed towards the banks increase their efficiency by careful lending practices. This would be improving their overall performance and prevent the banks from potential systemic risk.
5.
Conclusion
This study employs data envelopment analysis and Tobit regression to examine the im-pact of the EBA’s capital exercise on the bank’s technical efficiency. The sample consists of 194 commercials banks operating in 15 European countries from 2008-2015. The results of the DEA indicate that the average bank in the sample could improve its technical efficiency by 51.12%. But, before the announcement, it was 49.48%. The results indicate that the capital exercise has led to a slight increase for the average bank in the sample for improving its technical efficiency. After the capital exercise, the efficiency of the banks in the most
countries have declined. The most efficient banks are in Belgium and the worst in Portugal. In Denmark, the change of the efficiency of the banks is negligible. After the capital exercise, the efficiency of the banks in 15 EU countries has become more stable. However, there is high differences in the efficiency changes in the different countries such as Belgium.
Following the DEA results, Tobit model is used while controlling for the bank-specific charac-teristics and country-level characcharac-teristics accounting for macroeconomic conditions, financial development and market structure. The capital exercise announcement has led to change in the bank-specific characteristics which determine the technical efficiency of the bank. The study found that the profitability ,real GDP growth has a significant effect on the effi-ciency of the bank. While controlling for the macroeconomic conditions, real GDP growth have a positive significant impact on the technical efficiency of the bank. Also, the capital, Non-performing loans, ROE and Loan Activity have a significant impact on the technical efficiency. When controlling for the financial development, the activity in the banking sector and banking market size have significant and positive relationship with the efficiency. While Loan Activity and ROE has a negative impact. While controlling for the market structure, LOANTA, ROE and NPL have a negatively significant impact on the efficiency of the bank. Finally, when controlling for all the factors, GDP growth, activity in the market and the market size are affecting the efficiency of the bank positively. However, LOANTA and CONC have significantly negative impact on the efficiency of the bank. .
The empirical results suggests that the capital requirements not only strengthen financial stability , but also make the technical efficiency of the banks more stable. The results will be helpful for the EBA and the other regulators to make the relevant policies. The results show the capital exercise would be preventing the banks from excessive risk-taking activities. Furthermore, it would be allowing the banks to withstand the financial distress. Although, the capital requirements would not be a highly significant benefit for the efficiency gains. But, it would be creating favourable economic conditions which would be affect the extent, depth and quality of financial intermediation and banking services. The paper highlights the role of the capital exercise requirement on the technical efficiency of the banks and how the bank characteristics and environmental variables play a role on the efficiency.
This paper raises important questions which are left for future research. An important ques-tion is whether the change in the technical efficiency is something that was particular to this increase in the capital requirements. Another question is the role of the capital exercise on the profit and cost efficiency of the banks. As the stricter capital requirements reduces the likelihood of financial distress but, the profits may decline. Further research is required on the role of the post-crisis capital and liquidity requirement on the technical efficiency of the banks.