3
A geospatial assessment of urban tree canopy and policy
recommendations for its equitable distribution in Durham
and Chapel Hill, North Carolina
By Carl Kolosna
PID: 714706805
Masters Project Submission for
UNC-Chapel Hill
Department of City and Regional Planning
4
Contents
INTRODUCTION ... 7
Why does the urban tree canopy matter? ... 7
Connection with environmental justice ... 9
How is the distribution of UTC regulated?... 10
LITERATURE REVIEW ... 13
Evidence that UTC is beneficial ... 13
Environmental Justice and UTC ... 15
Evidence that distribution of UTC is variable ... 17
Existing policy guidance for UTC – National ... 20
Emerging high resolution data for assessing UTC ... 21
Census ubiquity and geographic limitations ... 23
Ordinance and Plan Quality ... 24
METHODOLOGIES ... 26
Region, state, and municipal selection criteria ... 26
Neighborhood selection criteria ... 27
Assessment of development ordinances relating to UTC ... 28
Neighborhood boundary collection ... 31
Quantitative UTC assessment ... 31
5
Neighborhood demographic collection ... 32
Neighborhood zoning collection ... 33
Clustered regression between select variables and UTC ... 33
RESULTS ... 33
Chapel Hill and Durham Comprehensive Plans and UTC ... 34
Development Ordinance Analysis ... 34
Establish a base of rationale for preservation or enhancement of UTC? ... 36
Have a goal related to UTC coverage? Is it a detailed goal? ... 36
Mention or recognize potential UTC disparities within the Town or City? ... 37
Discern between UTC on public or private lands, including right-of-way? ... 37
Include specific requirements or considerations for UTC within neighborhoods? ... 40
Include regulations that are designed to increase UTC from its pre-development status? ... 41
Have procedures for the replacement of trees that the ordinance requires to be removed? ... 41
Racial Demographics and UTC coverage ... 41
Zoning districts within neighborhoods ... 42
Cluster Regression ... 44
Percent of population non-white and UTC coverage ... 45
6
Binary presence of residential zoning and UTC coverage ... 46
Binary presence of nonresidential zoning and UTC coverage ... 46
DISCUSSION... 47
Development ordinances and environmental justice ... 47
Quantitative UTC ... 49
Policy recommendations ... 51
CONCLUSION ... 52
REFERENCES ... 53
7
INTRODUCTION
Why does the urban tree canopy matter?
The composition of built and natural elements can substantially affect the health of people that live within a city. A primary mechanism that relates human health impacts and the built environment is the “urban heat island” effect – a phrase derived from the “island” of hotter air that is situated around an urban environment. The urban heat island
phenomenon is characterized by empirical observations of higher temperatures within built environments when compared to more natural environments. Although many variables affect the magnitude of the UHI, the urban tree canopy (UTC) is one of the most influential. The UHI effect presents a serious hazard to human health, as increased
temperature can cause respiratory difficulty, increase the chance of heat-stroke,
exhaustion, and heat-related mortality. Just as planning operations can influence the UTC, they can also influence the level of impact that temperature increase will have on people by implementing measures (like preserving or increasing UTC) that mitigate the heat island effect.
Trees provide a number of important functions. They provide shade on a hot day. They stabilize the temperature around us. Through the process of photosynthesis they absorb carbon dioxide and produce oxygen. They are a critical component of the natural systems that works, constantly, to keep our natural systems in order. In a built
8 area that is covered by leaves, trees and branches – and excludes areas that only covered by grasses and small-scale vegetation like shrubbery.
The journey from seedling to maturity for a tree can take decades and is particularly arduous for urban trees. As populations grow, the available space for development
diminishes. Further population growth drives the need for additional space, which in turn causes densification and for development to push farther into natural and undeveloped areas. These natural and undeveloped areas often take the form of forested land.
Municipalities have regulations and policies that may require the replacement of vegetation removed during development - but these regulations may not require that vegetation is replaced up to the same level that existed prior. Additionally, structures are largely static and, in contrast, trees continue to grow. A tree deemed acceptably
unobtrusive in its early years may grow to such a size that it becomes a hazard to the property beneath it. In most cases, regulations provide mechanisms for the removal of trees that pose a danger to public or private property. As utility lines and other
infrastructure crisscross and fragment the natural environment, regulatory deference is given to the built environment.
Just as people are not evenly distributed across a city, the UTC is not uniformly distributed across municipal boundaries. People who live in areas with a relative lack of UTC will experience worse health outcomes such as increased rates of cardiovascular distress, heat stroke, higher energy costs for air conditioning, and higher instances of poor air quality. All of these effects are in part due to increase temperature from UHI – but they are also due to lack of access to the vital ecological functions that trees provide like
9 Due to their long lifespan and fragile young years, the intentional preservation or placement of trees within an area will affect its UTC for years to come (USDA Forest Service, 2015). The canopy coverage within an area will directly affect its perception, and consequentially, its valuation (Schwarz, 2015). Indicating its association with trees, the phrase “urban blight” - hinges on a descriptor of disease and decay, originally used in ecology to describe the devastating effect of disease and mortality on trees. The
overwhelming presence of barren landscapes, lacking in vegetation, and made of metal, concrete, asphalt, and other non-natural materials is now associated with urban blight, and consequentially undesirability1.
Connection with environmental justice
Racial minorities experience worse outcomes when compared to whites across most quantifiable metrics. Patterns of segregation are driven by planning decisions and
continual, systematic discrimination has fostered segregation within cities across racial and class lines. Planning has the ability to shape the built environment, make
determinations about where people will live, and what degree of access they have to the basic components necessary for a healthy and productive life. The UTC is no exception. It is well documented that, even within a city, town, or neighborhood, there can be significant differences in the attributes and quality of the built environment and the prevalence of harmful, locally unwanted land uses (LULU).
Communities of racial minorities are more often proximal to LULUs when compared to white communities. Even a cursory review of major planning interactions over time
1 “Urban blight” itself is a phrase that is deeply problematic with respect to racial disparity -- emblematic of
10 reveals that planning has contributed to perpetuating racial inequality and discrepancies in the quality of the built environment. Some particularly prescient planning examples
include, but are not limited to:
● Disintegration of minority communities via highway expansions
● Disproportionate siting of hazardous and/or otherwise toxic land uses in minority communities
● Systematic exclusion of minority populations from access to basic amenities like water, sewer lines, parks, and infrastructure improvements
● Systematic exclusion of minority populations from access to lines of credit and the ability to buy homes, exemplified in the Home Owners Loan Corporation “Redline” maps
Locally, the planning operations within Durham and Chapel Hill have, at times, mirrored these examples. Durham engaged in the disintegration of the historically black community Hatyi in the 1970s with the expansion and realignment of Highway 147. In Chapel Hill, the historic Rogers-Eubanks community was promised improved access to basic sewer and water infrastructure in return for allowance of the siting of a landfill near their community. To this day, promises about the expansion of services like sewer
connections have largely been unfilled, despite the initial building and subsequent expansion of the landfill.
How is the distribution of UTC regulated?
11 is not all-encompassing. Within limits, there is some behavior, such as removing a tree on private property, which are not prohibited by planning regulations. Trees on private land are only loosely under the regulatory control of a town or city.
Trees take many years to grow and developing an urban canopy can take decades. This temporal lag means that the provision of trees now will have a direct and significant impact on Durham and Chapel Hill’s preparedness to mitigate the UHI, and overall human health and quality of life, going into the future. Similarly, the geospatial distribution of this urban canopy will be locked in for many decades to come, meaning that equitable
distribution of these replanting efforts now is critical for fostering long term environmental equity.
Even though the UTC may not be distributed evenly across a municipality,
regulations and policy associated with tree canopy may treat it as such. In doing this, policy or guidance may perpetuate or widen the gap between qualities of the built environments across cities. To ground this analysis in a observable settings, Chapel Hill and Durham, North Carolina were selected to observe and assess the municipal efforts related to UTC coverage.
In 2015 the Durham City-County Environmental Affairs Board released a report entitled “Recommendations for Sustaining a Healthy Urban Forest in Durham, NC” In it, the board recommended the planting of at least 1,680 trees per year. The board also noted that the current funding mechanisms in place to replace trees were likely not adequate, and that a comprehensive assessment of UTC, to date, had not been completed.
12 years. The report also noted that this estimate was only a rough calculation, and that the value could, in reality, be higher going into the future.
During the 1930s Durham experienced a wave of plantings through depression-era PWA activities. Due to this timing, the majority of Durham’s urban canopy is now entering the end of its natural life cycle. The report notes that “Currently, the locations of newly planted trees in Durham are allocated based on requests from and the financial support of economically-advantaged residents.” More recently, the Durham has called for a
comprehensive assessment of the urban canopy.
Currently, both Chapel Hill and Durham have sections within their development ordinances that regulate the provision, protection, and enhancement of the tree canopy. The development ordinances represent a direct tool that can be used to manage this critical ecosystem service. Guidance and requirements given by the ordinances will directly
contribute to the built and natural environment.
Overall, the goal of this study is threefold; To quantitatively assess the UTC for a number of mature neighborhoods; To qualitatively assess the degree to which
13
LITERATURE REVIEW
Evidence that UTC is beneficial
The term “ecosystem services” was popularized in the 2000s by the Millennium Ecosystem Assessment – an initiative created via the United Nations to assess the benefits that humans gain from natural systems (Fisher, 2009). Broadly, the term encompasses four categories that include provisioning, regulating, supporting, and cultural aspects. With respect to the UTC and human health, the regulating and cultural categories are the most applicable. Regulating elements include temperature reduction and associated reduction in air conditioning and electricity demand, and regulation of airborne pollutants. Cultural aspects include the psychological and health benefits of proximity to vegetation.
Increasingly, these quantitative and qualitative benefits are being associated with monetary values to allow policy-makers to justify decisions around preservation.
With respect to mitigation of the heat island effect, temperature reduction is one of the strongest benefits of the UTC. Yuan and Bauer found that surface level temperature within urban environments was linearly and positively correlated with impervious surface coverage. The presence of vegetation, calculated in the form of the normalized difference vegetation index (NDVI), was found to be negatively correlated with surface temperature (Yuan, 2007).
14 provided by trees over two modeled houses within Sacramento California yielded energy savings of 30% for air conditioning units when compared to non-shaded baselines (1997).
The removal of airborne pollutants produced by urban activity like tailpipe emissions are a vital component of the health benefits of the UTC. Urban trees are
estimated to have removed 711,000 metric tons of ozone, particular matter – 10, nitrogen dioxide, sulfur dioxide, and carbon monoxide at a valuation of $3.8 billion across fifty-five US cities in 1994 alone (Nowak, 2006). All five of these pollutants are recognized by the National Air Ambient Air Quality Standards via the Clean Air Act of 1970 as detrimental to human health. Additionally, trees uptake and store carbon dioxide, a significant greenhouse gas. It is estimated that urban trees in the US stored 700 million tonnes of carbon at a valuation of $14,300 million in 1994 (Nowak, 2002).
There is evidence that vegetation bears psychological benefits, particularly when vegetation is viewable from within built structures. A study conducted in six apartment communities found that resident wellbeing and satisfaction with their neighborhood was positively correlated with the presence of window-viewable vegetation (Kaplan, 2001).
15
Environmental Justice and UTC
The majority of literature on environmental racism focuses on expression in terms of racial minorities’ disproportionate proximity, or exposure, to hazards, noxious uses, or otherwise negative environmental attributes (Szasz, 1997). This study attempts to quantify and assessing the presence or absence of positive environmental factors, specifically UTC coverage. In this way, the work will attempt to supplement the comparatively smaller body of work surrounding the provision of basic amenities and other positive factors of the built environment.
16 ownership and property values were less significant as an explanatory variable when compared to race alone (Arnold, 2007).
With regard to racial minorities and proximity to locally unwanted land uses
(LULUs) such as landfills, sewer treatment plants, and highway corridors, some critics have argued that the disproportionate correlation between race and hazardous land uses may come about as people move in to areas after the installation of LULUs. Pastor and
colleagues worked explicitly to provide evidence that disproportionate siting of LULUs in existing minority communities was a more significant factor than disproportionate ex-post-facto minority move-in. T-test and retroactive temporal geospatial analysis for tract
geography over three decades in Los Angeles, confirmed this hypothesis (Pastor, 2016). In addition to the disproportionate siting of LULUs proximal to minority
communities, there are numerous examples of denial of basic city services to minority communities. Most directly comparable to UTC, these basic amenities may take the form of parks, open, and green spaces. In these environments, residents do not have adequate opportunities for exercise and recreation which negatively impacts both mental and physical health. Additionally, there are environmental health impacts of highly impervious and low-vegetation coverage areas. The proximity and distribution of these ecosystem services are a direct result of municipal land use decisions (Arnold, 2007).
The West End Revitalization Association (WERA) in Alamance County North
17 drinking water (Wilson, 2008). The communities that WERA represents were established shortly after the civil war by formerly enslaved peoples. A main focus of WERA efforts revolve around access to basic amenities in the context of racial segregation. For example, sewer lines being extended into majority white and higher income communities, but not into black and lower income communities – despite roughly equal distance from the main city. Given the health and economic benefits of UTC, there are parallels between the access to basic amenities and access to UTC. The UTC essentially is a basic amenity, although one that has not been as formally recognized.
Finally, the increase in temperature and widening variability of temperature fluctuations from climate change will exacerbate existing inequality in increasingly urbanized areas. A majority of the US population lives in urban environments, and this number is expected to increase (US Census Bureau, 2012). Even if all people do not live within urban areas, there is growing evidence that suburban and even rural communities exhibit heat island characteristic (Cox, 2014). Furthermore, impacts from climate change are predicted to disproportionately affect minority and low-income populations (US Global Change Research Program, 2015).
Evidence that distribution of UTC is variable
Generally, studies were selected that assessed UTC or other land uses that impact the UHI and reviewed the distribution of these land uses with regard to sociodemographic or racial characteristics of populations. The disciplines of economic geography,
18 their intersectional perspective on geographic and natural features, and human health. The overall finding from this literature review is that UTC coverage is variable on both large and small scale geographies (e.g. between cities across the US and also within cities), and that this variation can, at least in part, be attributed to sociodemographic characteristics like income and race.
Schwarz and colleagues found that the median income was positively correlated with UTC cover within seven major cities in the US (2015). There was a negative
correlation with regard to race and UTC cover, but the same negative correlation was not observed in multivariate regression when additional variables like income, education, and housing age were included. However, the analysis was performed across the entire city, on the census block level.
Jesdale, Morello-Frosch, and Cushing define heat-risk related land cover (HRRLC) as areas where at least half of the population does not live within UTC, and more than half of the ground is covered in impervious surface. In an assessment that covered the entire US, the researchers found that non-Hispanic blacks were 52% more likely to live in HRRLC areas compared to non-Hispanic whites. The unit of analysis for the research was the block group level, leaving the potential for obscuring effects influencing the results – given
19 assessment of the National Landcover Dataset indicate that accuracy for assessing urban canopy coverage can be as low as 78%. Single-pixel classification accuracy ranges from 73-77% (Whickham, 2010).
Heyen, Perkins, and Roy concluded that there is an inequitable distribution of the urban forest within the city of Milwaukee. Analysis was performed on the census tract level Non-Hispanic white populations were found to be more likely to have higher tree canopy, compared to non-Hispanic black and non-white Hispanic populations. Importantly, the authors conclude that racial and ethnic factors interplay with the distribution of the urban canopy independently of political and economic factors.
The prevailing conclusion from academic research is that the UTC is not distributed evenly across urban areas. A number of studies have quantitatively assessed whether UTC has a correlation with sociodemographic variables such as income and race. Studies have assessed the spatial distribution of UTC, with respect to segregation of populations. The results from these studies generally indicate that there is evidence of spatial and
sociodemographic-UTC-disparity within urban environments. The majority of these studies use the entire extent of the city as their study area, which may obscure finer-scale
20
Existing policy guidance for UTC – National
In response to the growing concern around health impacts from the UHI, Louisville Kentucky published an urban heat management study in 2016. The study acknowledges that trees and other vegetation have a direct impact on the UHI effect within the city. Notably, the study incorporates some discussion of the uneven distribution of the UTC within the city, and on neighborhood scales. Neighborhoods within the west side of the city often “lack sufficient street tree cover, contributing to elevated temperatures.” The study recommends the adoption of a “green area ratio” within the zoning ordinance. This tool would set a minimum green cover target for all residential, commercial, and industrial parcels. The study additionally recommends the creation of target street tree coverage percentages, with values as high as 50% for local streets, of which neighborhoods are primarily comprised of. Finally, the study finds that tree planting’s impact on reducing the UHI would be most effective for residential areas, where population exposure to heat is greatest.
21 current funding mechanisms were inadequate to increase, or even maintain the existing UTC coverage. The report recommended to increase the street tree population by 50% over the next 20 years. The report notes that historic planting patterns have emphasized some neighborhoods over others, in terms of UTC coverage. Although the study reports tree canopy coverage by neighborhood, it does not contain explicit policy recommendations targeted to increase UTC coverage for those neighborhoods with low coverage. Rather, the goal of 50% increase in UTC is proposed to be distributed relatively evenly across the entire city.
In 2008 the US Conference of Mayors published a 135-city survey of policy efforts to protect and develop the UTC. The survey found that 95% of surveyed cities have adopted ordinances related to UTC, and that 84% of the cities viewed trees as critical to their sustainability and/or climate protection efforts. 85% of surveyed cities require the
replacement or maintenance of existing trees when development occurs. Just under half of the surveyed cities have made increasing the UTC an explicit goal in their environmental ordinance. The survey did not include questions relating to the spatial distribution of UTC, or the possibility of inequality in that distribution. The study indicates that most cities have ordinances related to the UTC, but the quality or effectiveness of those ordinances may not line up with the stated goals of the city to preserve or enhance UTC.
Emerging high resolution data for assessing UTC
22 data acquisition and technical capacity are barriers to UTC assessment. Over the years, the feasibility of UTC assessment has become greater as spatial resolution and low or zero-cost data availability increases.
There is high cost and expertise associated with obtaining high-resolution remotely sensed and GIS-based datasets that are most useful for assessing UTC, such as LIDAR datasets. In contrast, Landsat satellite imagery is available in high temporal resolution, and is freely available to the public. Landsat also contains a wide spectral resolution, including color, near infrared, shortwave infrared, and thermals bands. This spectral resolution is particularly well suited to picking up variations in vegetation. However, the spatial resolution of Landsat is 60-meters, resampled down to 30-meters. This resolution is not desirable for fine-scale analysis, such as within neighborhood geographies, as the entire extent of a neighborhood may only contain a few dozen pixels. Furthermore, the spatial resolution means that a pixel may contain various discrete land features, such as a road, a house, and trees. The spectral signature from these land features are averaged together within the pixel, washing out fine-scale variation. As free, easily obtainable data becomes more available, so too does ability to asses UTC at finer scales.
In 2003 the USDA’s National Agricultural Imagery Program (NAIP) began. NAIP provides 1-meter resolution imagery collected from aircraft on a yearly basis, during the “leaf-on” growing season. “Leaf-on” means that the imagery is collected during peak
23 additional to the traditional red, green, and blue bands. The near-infrared wavelength is particularly sensitive to vegetation, making it ideal to use for distinguishing between vegetation and non-vegetation. The high resolution of NAIP makes it appropriate for assessing UTC on a neighborhood, and even sub-neighborhood scale.
Census ubiquity and geographic limitations
A benefit of higher resolution data is that it allows analysis on a scale that can untangle social and political units from larger, aggregated units of analysis. For example, UTC coverage is available through EPA’s EnviroAtlas database as a percentage of the total area of all census block group. However, the issue still remains that census blocks do not always encompass social or political units in a discrete or contiguous manner. Moving down to the smaller geographic census units will, to at least some extent, allow for more discrete analysis of residential patterns.
Census data, due to its standardized nature, high temporal resolution, ease of
accessibility, and comprehensive spatial scale, is a natural choice for researchers who want to assess sociodemographic characteristics of populations. As reported by the US Census Bureau, census blocks, and the associated larger geographies like census block groups and tracts, are determined using features of the built and natural environment, like roads and waterbodies. Standardization and ease of accessibility to surveying techniques are a main driver for the determination of census geographies. While this method is good for
24 Census blocks may not always line up with traditional or historic social boundaries, such as neighborhoods. What this means is that census geographies may combine or merge disparate populations. For example, a census block may be split between multiple
neighborhoods, meaning that its summary estimations, while useful for city-wide analysis, and not as useful for assessing characteristics within those neighborhoods. This limitation of census geographies directly influence the results of studies that use it. The near
ubiquitous application of census data in studies assessing UTC and sociodemographic variables means that finer-scale variations, such as on the neighborhood level, may be lost.
Within the body of literature, there is a need for spatial assessment of populations that do not conform exactly to predefined census geographies. Given their social and political relevance, which directly ties to historic segregation and discrimination, neighborhoods are an attractive geography to perform this assessment.
Ordinance and Plan Quality
Literature around the quality of plans and ordinances delineates three generalizable elements that influence effectiveness of implementing a desired outcome: establishment of fact base, establishment of goals, and establishment of policies (Berke, 1994). For the purposes of this study, the desired outcome is the equitable distribution of UTC within cities, and specifically their distribution among neighborhoods.
In a meta-analysis of plan quality evaluation, Berke and Godschalk identified
25 consistency. The general purpose of the internal characteristics are to provide logical
linkages between the different elements of the plan or ordinance.
A strong fact base for policies that would create such a distribution should recognize the human health benefits in line with the previously identified benefits of the UTC.
Additionally, a strong fact base would rely on a comprehensive assessment of the UTC within the municipality, or call for its creation if such an assessment has not been
performed. This assessment will then be used to provide the base of rationale for goals and implementation policies. Berke and Godschalk consistently found that the weakest element of plans and ordinances are a lack of substantial fact-base (2009). In contrast, internal consistency and linkages between goals and implementation items were found to the strongest elements among reviewed plan quality analysis.
Goals related to the UTC should strive for the enhancement or increase of UTC wherever feasible. More specifically, goals should draw from the assessment of the UTC to identify and require enhancement of the UTC for areas that have lower than average amounts of coverage. Goals should be detailed and go beyond simply stating that UTC should or will be increased.
Policies related to the UTC should be specific, measurable, and implementable. The spatial nature of UTC coverage makes their assessment a matter of proper data collection, and if feasible with the required expertise in geospatial assessment. Differentiation or modification of UTC requirements by land use type should be justified (Berke, 2007).
26
METHODOLOGIES
The project is divided into two main phases. Preceding both phases is the selection of regional, state, and local levels of geography – which were identified to be the US
southeast, the state of North Carolina, the municipalities of Durham and Chapel Hill, and finally six neighborhoods within each municipality for a total of twelve neighborhoods. Phase one encompasses the collection and assessment of ordinances and plans related to UTC within the selected sites. A modified plan quality and ordinance quality tool was used to assess the degree to which plans and ordinances that have jurisdiction over the selected sites preserve, protect, or increase the UTC – and the degree to which they acknowledge potential disparity in the UTC distribution and provide detailed rationale for preservation or enhancement. Phase two encompasses the land classification exercise to quantitatively assess the UTC within a number of neighborhoods. This includes collection and processing of aerial imagery, and collection and processing of georeferenced sociodemographic information. Additionally, statistical least-squares regression between the variables non-white population, presence of residential and non-residential land uses, and right of way- all using census blocks as the unit of analysis and clustered by neighborhood - were calculated.
Region, state, and municipal selection criteria
The southeast region is a natural selection for analysis of UTC and racial minorities, given the historic prevalence of black populations (“the black belt”) and associated
27 specifically Durham and Chapel Hill are more than a century old, making it possible to identify historic neighborhoods that have been in place for timescales in congruency with the lifespan of trees. Additionally, Durham underwent historic Home Owners’ Loan Corporation (HOLC) “redline” mapping processes in the 1930s – making correlation and comparison between historic black and white neighborhoods possible. Chapel Hill has a history of denial of basic services in the Rogers-Eubanks community, going back to the 1970’s, as well as historically black neighborhoods that are currently undergoing erasure due to development pressure.
Neighborhood selection criteria
Neighborhood were selected with specific consideration for their racial population characteristics – being borne largely from HOLC designation in Durham’s case. For Chapel Hill, the selected neighborhoods with large non-white populations were the only
neighborhoods existing within the town, each with their own history of black and low income populations that have been exploited by activity within Chapel Hill and the
28 hookups have been largely unfilled to date. For Durham, neighborhoods that were
originally delineated as the highest risk (red) in the Home Owner’s Loan Corporation
“Redline” maps were selected. Newly built neighborhoods were excluded from the study, as greenfield or wholesale development of a residential neighborhood is usually associated with a significant change (e.g. removal) of the UTC. The intent of the site selection was to choose neighborhoods that were mature, and relatively racially homogenous. All Chapel Hill neighborhoods, with the exception of Roger-Eubanks, are designated as neighborhood conservation overlay districts in the land use ordinance – which serves as the closest proxy to neighborhood designation in lieu of an official designation by the town. Chapel Hill’s neighborhood conservation overlay district are designed to protect unique neighborhood characteristics, and allows modification of land use ordinances such as tree protection standards to fit with community-identified attributes of that neighborhood.
Assessment of development ordinances relating to UTC
Both Durham and Chapel Hill have ordinance subsections that directly relate to tree canopy coverage. This makes discrete assessment of those subsections relatively
comprehensive in terms of assessing the impact that the development ordinance will have on UTC. The Chapel Hill tree protection ordinance was codified in November 2011. The Durham tree protection and tree coverage standards were codified in 2006.
Working off of the findings of the Berke and Godschalk meta-analysis of plan quality, an assessment protocol was created that was modeled off of the internal plan quality
29 base was generally found to be the weakest element of plans and ordinances, the protocol questions were weighted to assess whether or not a substantial understanding of the current UTC existing within the community and were used to drive the regulations and policies within the document.
The assessment protocol was used to perform analysis of the development ordinance sections relating to preservation of the UTC. This assessment tool seeks to answer the following questions, and qualitatively assess how the development ordinances regulate UTC, with a particular focus on neighborhood geographies are equity in
distribution. For both Chapel Hill and Durham ordinances, a purpose statement was included at the beginning that listed rationale for the creation of the ordinance. These statements were assessed for the presence of rationale related to racial or socioeconomic equity, UHI, and neighborhood composition. Additionally, differentiation between the mere existence of a goal or element and detailed reasoning behind the creation of that goal was considered. The following questions were posed to each development ordinance:
Does the ordinance:
● Establish a base of rationale for preservation or enhancement of UTC? ● Have a goal related to UTC coverage? Is it a detailed goal?
● Mention or recognize potential UTC disparities within the Town or City? ● Discern between UTC on public or private lands, including right-of-way?
● Include specific requirements or considerations for UTC within neighborhoods? ● Include regulations that are designed to increase UTC from its pre-development
30 ● Have procedures for the replacement of trees that the ordinance requires to be
31
Neighborhood boundary collection
For Chapel Hill, neighborhood boundaries were collected from officially designated neighborhood conservation zoning overlay districts, with the exception of Rogers-Eubanks, which was selected using information from the Rogers-Eubanks Neighborhood Association. For Durham, neighborhood boundaries were collected from the city’s official web portal. Neighborhood boundaries for both municipalities were collected as GIS shapefiles.
Quantitative UTC assessment
Four-band (red, green, blue, and infrared) NAIP imagery was collected for June 19th, 2014 for both Orange and Durham County. The neighborhood boundaries collected
previously were used to clip the NAIP tiles, resulting in RGBI images for the extent of each of the 12 neighborhoods (See Appendix for RGB images of each neighborhood).
To facilitate supervised classification, training samples were collected in each neighborhood for the following land classes:
1. Tree 2. Grass
3. Road/Impervious 4. Building
5. Bare Earth
The training samples were evenly spread throughout the geography of the neighborhood, to account for slight variations in atmospheric conditions and lighting.
32 appropriate class. For some neighborhoods, not all class types were present. Grass and Bare Earth were the least common class-types. Bare earth is generally most common in new developments, which were excluded from this study. Grass is generally covered up within areas of high UTC and nonexistent in areas with high impervious surface coverage.
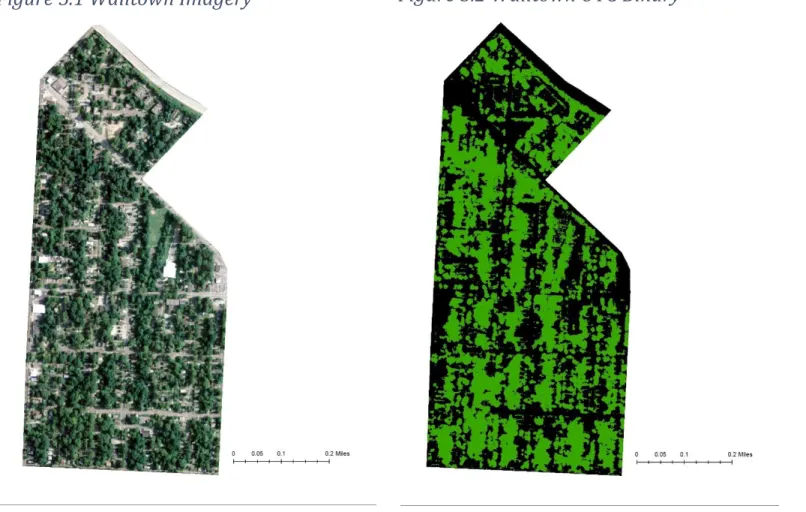
For the purposes of analysis, all non-tree classes were then combined into a single class. The result was binary raster with all pixels classified as either tree canopy, or non-tree canopy (See appendix). Zonal statistics were used to sum the ratio of non-tree to non-non-tree pixels within each block, to assess UTC on the block level.
Limitations
The supervised classification process using the NAIP imagery is a rough
approximation of the UTC, exclusively relying on two-dimensional analysis. This analysis does not differentiate between tree types, nor does it assess the volume or health of existing trees. This analysis could be performed with the introduction of full-cloud point classified LIDAR datasets – which can identify and classify different tree species. The
volume of an urban tree canopy is a more accurate assessment of its overall health benefits, compared to two dimensional area. LIDAR data would also largely remove the problem with the current methodology of not being able to assess land classification underneath the UTC. For example, impervious surface that is blocked by the two-dimensional envelope of the UTC in NAIP satellite imagery could be revealed with LIDAR data.
Neighborhood demographic collection
33 within the neighborhood boundary, it was counted towards the demographics. In some instances, the small size of neighborhoods meant that any blocks overlapping the neighborhood geography were counted, to achieve adequate n values.
The non-white population was calculated using the following equation: Percentage non-white = 1-(white population/total population)
Neighborhood zoning collection
Georeferenced zoning districts were collected from the Chapel Hill and Durham GIS portal. Zoning districts were selected and clipped out using the neighborhood boundaries to export base zoning districts by neighborhood. See results for zoning designations by neighborhood.
Clustered regression between select variables and UTC
Regression analysis was performed between the variables UTC and % nonwhite, clustered by neighborhoods, using the block as the unit of analysis. Additionally, the percentage of the block’s area designated as right-of-way was compared to UTC coverage. Finally, a binary indication of whether or not a block contained residential and non-residential zoning districts was calculated.
RESULTS
The following section first reports the results of assessment of Durham and Chapel Hill’s comprehensive plans with regard to their discussion on UTC distribution and
34 breakdown of each protocol analysis question. The final section reports the results of non-white populations, UTC percentage, and zoning districts by selected neighborhoods within Durham and Chapel Hill.
Chapel Hill and Durham Comprehensive Plans and UTC
Chapel Hill’s Comprehensive Plan includes limited mention of UTC. The “extensive tree canopy” is noted as a tangible asset for the community. Protecting existing tree canopy is listed as a “connecting quality” among neighborhoods within Chapel Hill. However, there are no policies or objectives that are directly associated with tree canopy. Increasing the tree canopy is not listed as a goal with the plan.
Durham’s Comprehensive Plan also contains limited mention of UTC. Within the Conservation and Environment chapter, the only stated policy related to UTC relays that the City-County Planning Department shall “research and propose development
regulations and/or programs to increase and target” UTC. This policy is nested within the objective of preserving and enhancing air quality, and the rationale for increasing or preserving UTC is consequentially referenced in terms of the air quality benefits of trees.
Development Ordinance Analysis
Analysis Question - Does the ordinance...
Chapel Hill Result Durham Results
Establish a base of rationale for preservation or enhancement of UTC?
Yes. Public health, safety, welfare, and enhancement of quality of life are listed.
35 environment, and
attractiveness are listed. Have a goal related to
UTC coverage? Is it a detailed goal?
Yes, but not detailed. States intention to maintain maximum practical tree canopy cover over all land uses within the town.
No.
Mention or recognize potential UTC
disparities within the Town or City?
No. Existing spatial patterns of UTC within the community are not referenced.
No. Existing spatial patterns of UTC within the community are not referenced.
Discern between UTC on public or private lands, including right-of-way?
Variable. Private owners may voluntarily register rare trees. Calculations for the minimum canopy coverage may include right-of-way, if deficient from the standard. However, initial UTC calculation for canopy minimum does not include public right-of-way. Minimum canopy coverage only triggers for development applications.
Yes. Right-of-way dedication for the widening of existing road right-of-way is excluded from UTC coverage
calculation. Include specific requirements or considerations for UTC within neighborhoods?
Yes, but in a generalized manner. The ordinance allows
modification of UTC coverage requirements, at the discretion of a neighborhood conservation district “consistent with the
existing neighborhood character.”
No. Compact Neighborhoods are not referenced in the section.
Include regulations that are designed to increase UTC from its pre-development status?
No. Existing standards, at best, will maintain minimum canopy coverage requirements, but only for areas undergoing
development. Removal of trees are explicitly required for a number of scenarios (hazard to public safety, interference with infrastructure).
If proposed development preserves 20% or less of tree coverage area, it is required to increase that percentage, up to 25%. Final tree
coverage is always greater or equal to preserved tree coverage. However, this only applies to development activity. There is no
36 Have procedures for
the replacement of trees that the
ordinance requires to be removed?
No. There is no mechanism for the replacement of trees removed due to hazardous designation or natural mortality
No. Only conditions for removal are defined. Remediation measures are not defined or required.
Establish a base of rationale for preservation or enhancement of UTC?
The general purpose of the Chapel Hill provision is to “preserve, maintain, and increase tree canopy to protect the public health, safety, and welfare and enhance quality of life in Chapel Hill.” See table above for listed rationale for preservation of UTC in Chapel Hill and Durham. While similar in the nature, the Durham provision includes a larger number of preservation rationale. However, in both cases, the rationale is simply listed, with no
further explanation as to how exactly elements of the provision address specific rationale.
Have a goal related to UTC coverage? Is it a detailed goal?
Chapel Hill states that UTC coverage should be maintained to the “maximum extent practical” over all land uses within the town. It is notable that the phrase “practical” is used, as it allows for modifications of the UTC coverage in cases where it is deemed to be
37 coverage. Notably, neither municipalities have an overall goal for UTC coverage within their jurisdiction.
Mention or recognize potential UTC disparities within the Town or City?
Neither Chapel Hill nor Durham either explicitly or implicitly acknowledge the presence or possibility of disparity in UTC coverage within either their overall jurisdiction, or within sub-jurisdictions such as neighborhoods. The lack of a comprehensive
assessment of UTC for either municipalities (part of their fact-base) makes recognition of such a disparity difficult.
Discern between UTC on public or private lands, including right-of-way?
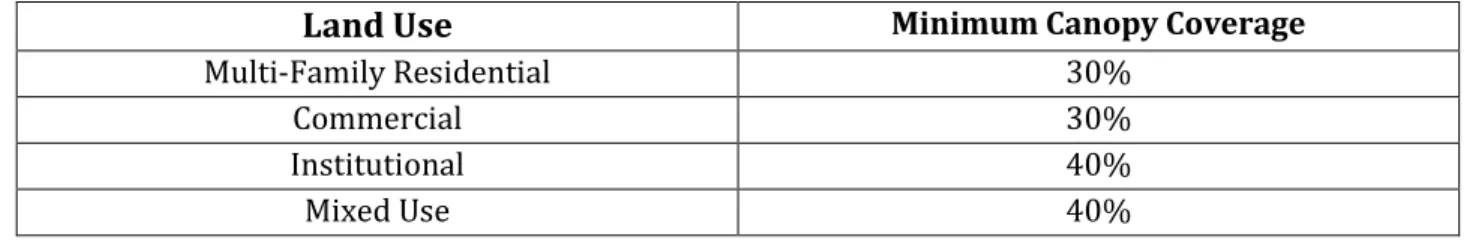
The Chapel Hill Tree Protection Ordinance regulates the following minimum canopy coverage to be maintained for the following land uses:
Table 1: Chapel Hill Tree Protection Ordinance Minimum Canopy Coverage Requirements by Land Use
Land Use Minimum Canopy Coverage
Multi-Family Residential 30%
Commercial 30%
Institutional 40%
Mixed Use 40%
Modification of these requirements is allowed when “public purposes are met, and canopy removal supports other goals of the town.” These other goals include, but importantly, are not limited to:
● Goals of the comprehensive plan
38 ● Stormwater management
● Community character of adjoining property and established managed landscapes
Given the financial cost associated with tree maintenance and replacement, it is likely that modification request generally asks for less coverage, rather than more.
The CH minimum canopy coverage regulation is not a requirement for the total UTC within these land uses, but rather applies specifically to the development tract on which the application proposes tree removal.
The CH ordinance references the possibility that UTC for a site, even prior to
development, may already be below the allowed threshold for that land use. Compliance with the minimum coverage standards “shall” be established, but the mitigation
mechanisms to establish compliance include actions that may still reduce the overall UTC. In the case where the existing tree canopy is less than the minimum standard, the
regulation allows for trees in the right-of-way to be counted toward the standard calculation, even though the initial calculation for minimum canopy coverage explicitly excludes right-of-way. Additionally, trees within parking lot shading areas and town buffers may be counted toward the minimum coverage, even though they are not counted in the original calculation.
The ordinance says that one replacement tree per 500 square feet of UTC deficit shall be planted. Even assuming the largest tree possible, this ratio will fall well below the
39 Furthermore, the minimum canopy coverage standards for these land uses explicitly exclude public right-of-way, and only apply to the zoning lot boundary. Trees in public rights-of-way are not assigned a minimum canopy coverage.
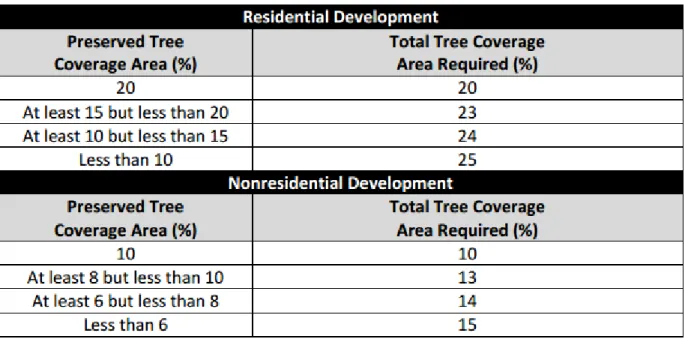
Like the Chapel Hill ordinance, the Durham UDO does not provide or require an overall UTC coverage for the city, or within smaller geographies such as zoning districts or neighborhoods, similarly the Durham UDO distinguishes between residential and non-residential development for its requirements related to UTC.
Table 2 Durham Minimum Canopy Coverage by Land Use
In contrast to the CH ordinance, the Durham UDO further distinguishes between
40 There is a negative correlation between the values of the preserved and total tree coverage areas. This means that the less coverage preserved in a development proposal, the more replacement trees will be required to fulfill the higher total tree coverage requirement, and vice-versa.
The magnitude of the ranges for the preserved and total, however, are different. This difference is particularly pronounced for residential development. The full range of difference between the highest and lowest threshold for residential preserved is 10%, while the associated total tree coverage range is only 5%. In the most extreme case, a development could preserve only 1% of existing coverage, and only be required to increase the coverage up to 25%.
Include specific requirements or considerations for UTC within
neighborhoods?
In Chapel Hill’s case the following text is includes relating to UTC requirement for Neighborhood Conservation Districts:
“For residential Neighborhood Conservation Districts, the district may request from the Town Council that Tree Protection regulations apply as per Section 5.7 using canopy
coverage standard consistent with neighborhood character”
41 designations, but the ordinance does not include and special requirements or elements that relate to neighborhoods.
Include regulations that are designed to increase UTC from its
pre-development status?
Both ordinances have requirements to preserve a variable percentage of a lot’s UTC coverage in the case of development. However, these values range from 10-40%, meaning that greenfield development will always contain less UTC coverage after development. In all cases, the ordinances minimize reduction of UTC, rather than calling or requiring for its increase.
Have procedures for the replacement of trees that the ordinance requires to
be removed?
Both ordinances have strong language requiring the removal of trees that pose a risk to property or human health. Risk to both city and private property are included as valid ownership for the removal of trees. Neither ordinance requires the replacement of trees removed for this reason.
Racial Demographics and UTC coverage
Neighborhood Name Average % non-white (all 2000 census blocks)
Average % non-white (all 2010 census blocks)
UTC Percentage (2014)
Durham
Forest Hills 21% 18% 76%
Duke Park 42% 37% 69%
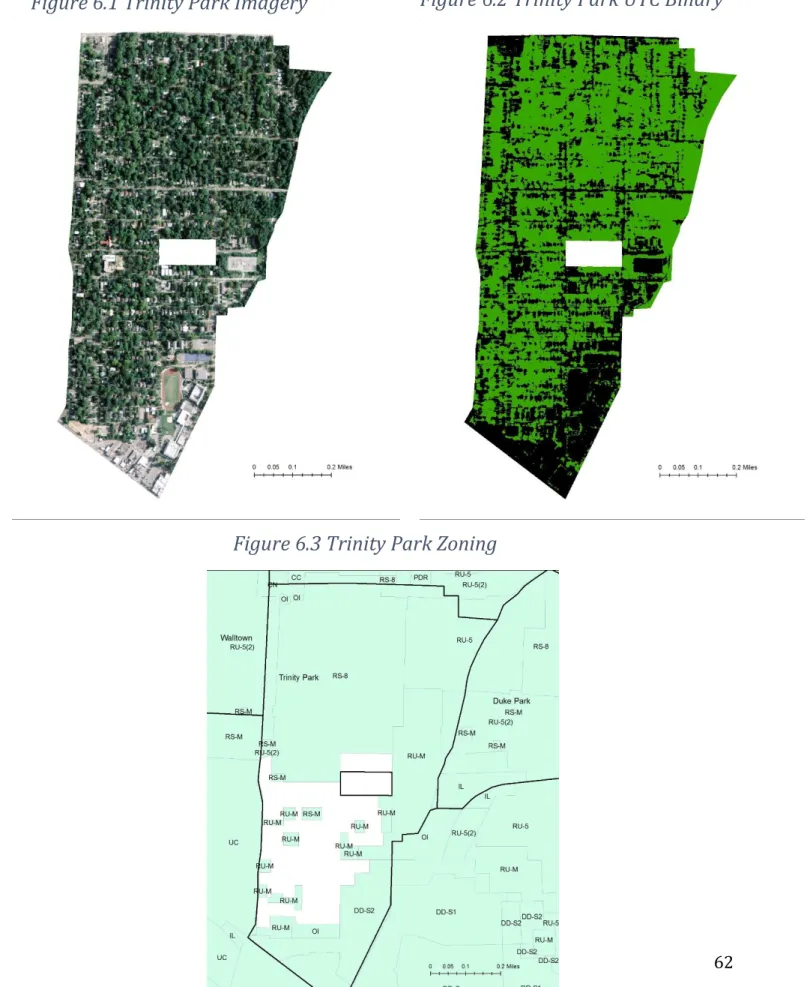
Trinity Park 20% 17% 62%
42
Walltown 67% 63% 56%
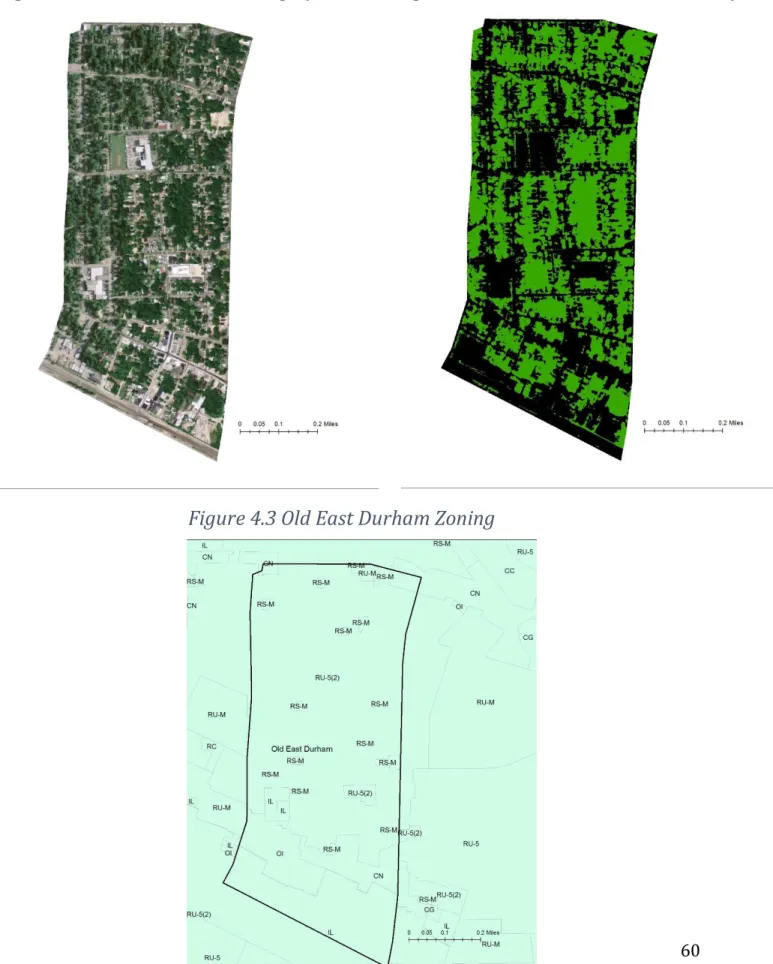
Old East Durham 77% 82% 48%
Chapel Hill
Coker Hills 10% 8% 91%
Kings Mill / Morgan Creek
9% 24% 89%
Rogers-Eubanks 32% 31% 83%
Gimghoul 2% 0% 82%
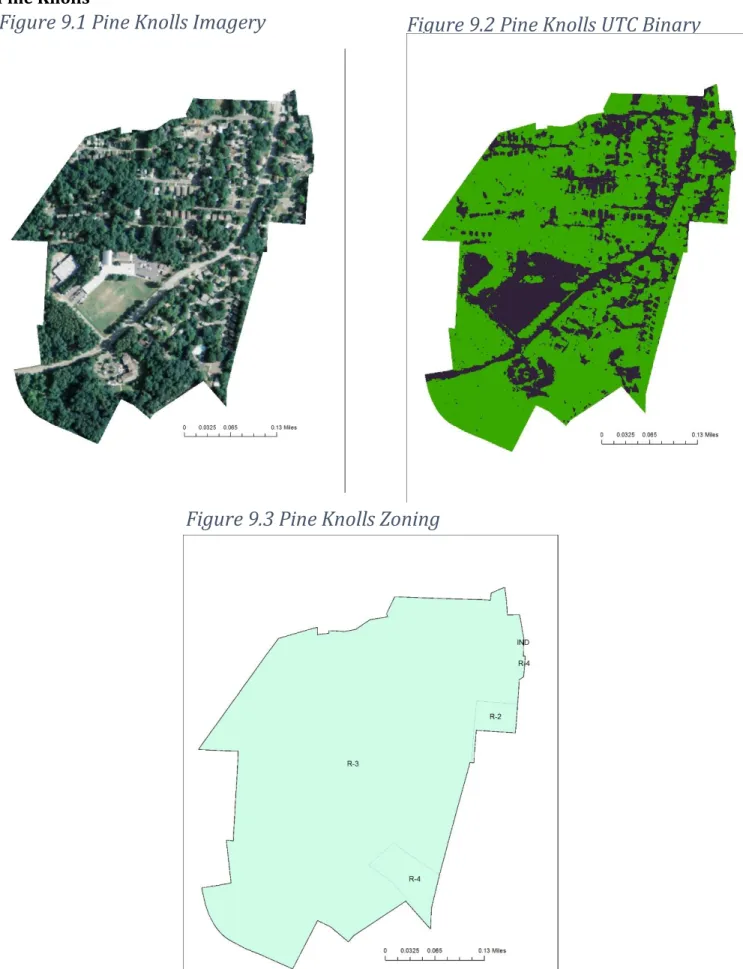
Pine Knolls 70% 60% 70%
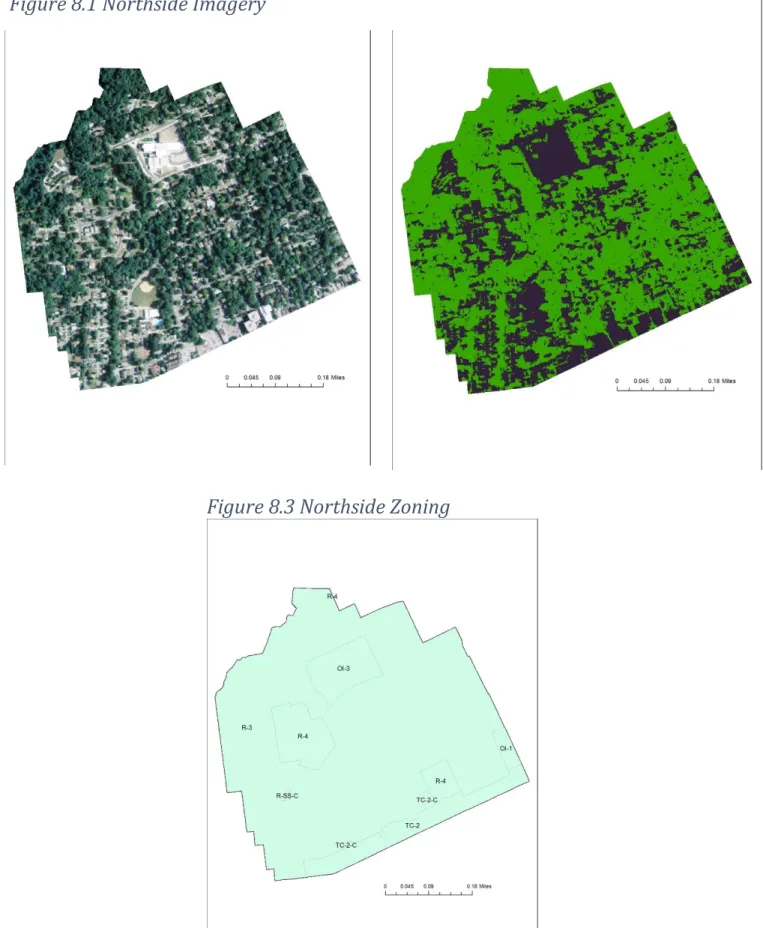
Northside 56% 42% 66%
UTC coverage percentages ranged from just under 50% by area to nearly 92% within Durham and Chapel Hill. Notably, between 2000 and 2010 the racial composition of nearly every neighborhood tended towards more white residents, indicating the effects of
gentrification. Two notable exceptions were Old East Durham, which saw an increase in non-white population – and also contained the lowest UTC coverage of any of the
neighborhood. Kings Mill / Morgan also saw an increase in non-white populations
Zoning districts within neighborhoods
Neighborhood Name Zoning Districts Present
Durham
Forest Hills Residential: RS-8, RS-10, RS-20, RU-5, RU-5(2), RS-M Duke Park Residential: RS-8, RS-M, RU-5, RU-5(2), RU-M.
Nonresidential: CN, IL
Trinity Park Residential: RS-8, RU-5, RU-5(2), RS-M, RU-M Nonresidential: CN, OI
Planned: DD-S2
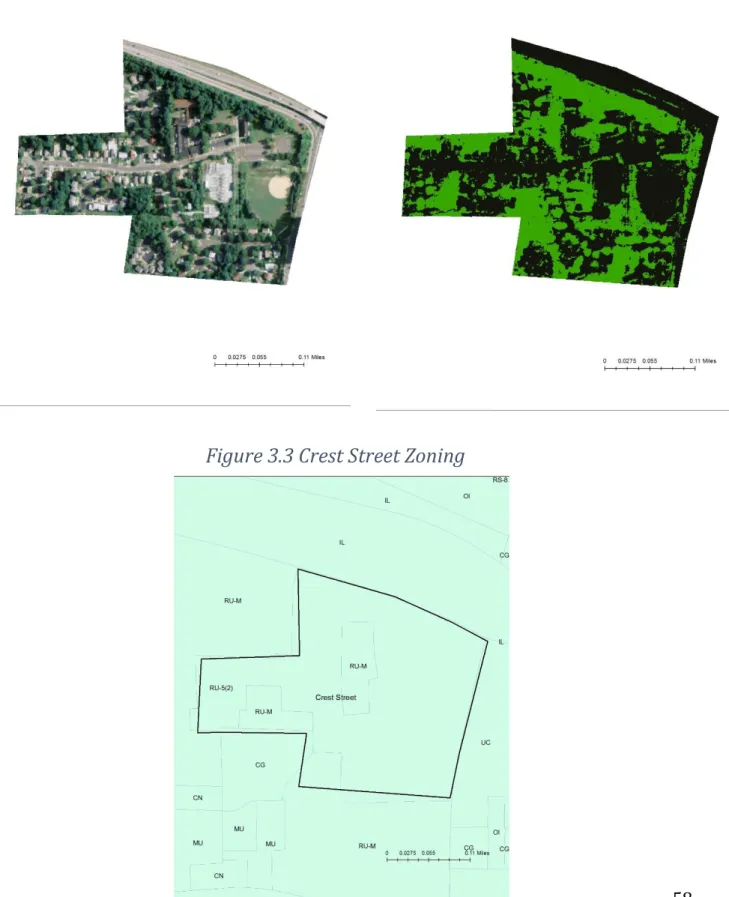
Crest Street Residential: RU-M, RU-5(2) Nonresidential: CG
Walltown Residential: RU-5, RU-5(2), RS-M Nonresidential: CN, OI
43
Chapel Hill2
Coker Hills Residential: R-1
Overlay: Neighborhood Conservation Kings Mill / Morgan Creek Residential: R-1
Overlay: Neighborhood Conservation Rogers-Eubanks Residential: R-1, R-5-C,
Gimghoul Residential: R-1
Overlay: Historic District Pine Knolls Residential: R-2, R-3, R-4
Overlay: Neighborhood Conservation Northside Residential: R-3, R-4, R-SS-C,
Nonresidential: OI-1, OI-3 Planned: TC-2, TC-2-C
Overlay: Neighborhood Conservation
Both Durham and Chapel Hill tree protection ordinances define varying canopy coverage requirements based on zoning district and/or land use. Thus, the zoning districts present within each neighborhood directly impact the UTC coverage requirements. The Durham UDO defines four broad zoning districts: Residential, Nonresidential, Planned, and Design. RS and RU districts are organized by density allowance (e.g. RU-5, RU-10). CN stands for commercial residential and allows neighborhood level commercial uses such as convenience stores within the district. OI stands for office/institutional and IL stands for light industrial. The planned district DDS-2 denotes a downtown design district and appears due to the southern portion of Trinity Park overlapping with Durham’s core downtown area. Generally, the table differentiates between residential and non-residential districts because of their varying requirements laid out in the tree protection ordinance. Generally, non-residential uses have lower minimum canopy coverage requirements, and
2 The Chapel Hill Zoning Ordinance contains significantly less zoning districts compared to Durham. For
44 indicate the presence of areas that will have higher impervious surface coverage, lower tree canopy coverage, and more noxious uses in terms of air-quality-reducing emissions from commercial and industrial facilities and associated supporting infrastructure like trucks – when compared to purely residential areas.
The Chapel Hill Zoning Ordinance contains significantly less zoning districts compared to Durham. For comparison purposes, they are organized by the following categories: Residential, Nonresidential (includes Office/Institutional), Overlay (includes neighborhood conservation districts and historic districts), and Planned (includes Town Center – TC).
For Chapel Hill, the majority of neighborhoods exclusively contained residential zoning districts. The exception was Northside neighborhood, which contained
office/institutional and school zoning districts. For Durham, zoning was more variable. Although the Durham neighborhoods, by area, generally contained a majority of residential zones, there was a significant amount of office/institutional, light industrial, and non-residential commercial neighborhood zones. It should be noted that a portion of the Chapel Hill Rogers-Eubanks neighborhood falls outside of the town boundaries, and thus a portion of the neighborhood does not have zoning districts.
Cluster Regression
For all regression statistics, the dependent variable was UTC coverage – calculated as a ratio of area covered by UTC and the total size of the block. Right of way was calculated as a ratio of the area of right-of-way within the block to the total area of the block.
45 calculation. If a zone overlapped any part of the block geography it was assigned a value of 1. This was performed for both residential and non-residential zones.
Percent of population non-white and UTC coverage
46
Binary presence of residential zoning and UTC coverage
47
DISCUSSION
The following section details conclusions made from the analysis of the results. The first section details ways in which the Durham and Chapel Hill development ordinances related to UTC coverage may increase UTC disparity and disproportionately affect low income and populations of color. The second section discusses findings related to land classification of raster imagery for UTC coverage by neighborhood.
Development ordinances and environmental justice
Both Durham and Chapel Hill do not have a municipality-wide minimum canopy coverage requirements. Where standards are in place, they have varying applicability based on land uses, and include explicit allowances for modifications, either in
methodology to calculate UTC or the standard values themselves. These modifications mean that the actual UTC for a development site can actually be lower than the minimum standards. Overall, the existing regulations allow the possibility of UTC reduction.
The Durham UDO and the Town of Chapel Hill ordinance both allow less tree coverage within non-residential zoning districts when compared to residential districts. Overall, there is 30 or 40% percent minimum tree coverage for residential zones and as little as 15 or 20% for non-residential zones (including commercial and industrial).
Having a non-residential use within your neighborhood means that the threshold for minimum canopy coverage is lower, compared to a neighborhood where the uses are entirely residential.
48 where the existing development lot is out of compliance with the standards, and gives modifications procedures to reduce the strictness of the standard. Overall the ordinances give significant leeway in a developer’s ability to modify (reduce) the UTC coverage requirement, if needed.
These regulations may minimize the damage in terms of UTC reduction, but may still allow reduction of UTC over time. For example, a greenfield site in Chapel Hill that contains as much as 100% UTC is allowed to be reduced down to as little as 30%, depending on the land use. Although the site is not permitted to be reduce below 30%, there has still been a substantial reduction in the overall UTC. Without an overall, town-wide UTC requirement, this regulation may allow for systematic degradation of the UTC over time.
If an area is not designated as a Neighborhood Conservation District then it will not be afforded allowances or protections under the ordinance. Non-designation of
Neighborhood Conservation Districts means reduced protection for UTC. Notably, to this date, the historically black Rogers-Eubanks neighborhoods has not been granted official designation by the town of Chapel Hill.
49 Both ordinances define conditions where a tree must be removed, as it poses a threat to human health or public infrastructure. However, neither ordinance contains provisions nor requirements for the replacement of these trees, meaning that trees removed will not be replaced.
If a neighborhood contains less canopy coverage, there are no mechanisms that increase that coverage offered by the development ordinance.
Right-of-way makes up a larger proportion of smaller lots, compared to larger lots. The explicit allowance of right-of-way to be removed from the tree canopy calculation means that smaller lots, in absolute terms, are allowed to have less canopy coverage as a function of their total area.
Overall, an assessment of the ordinances finds that there is no minimum UTC coverage requirement, that the ordinance does not take into consideration the fact that differing land use UTC coverage requirements will affect neighborhoods with varying land uses covers differently, and that current policies in place for UTC coverage requirements are inadequate in the face of natural tree mortality and strong allowances for the removal of trees that pose a risk to property. Additionally, UTC requirements far below 100% will necessarily mean overall reduction when developing largely forested lots.
Quantitative UTC
The binary-raster shows distributions of the UTC within each neighborhood.
50 However, there is variation in UTC between the neighborhoods. Qualitative comparison indicates that non-residential uses, such as light industrial and office/institutional contain less UTC compared to residential zones. This is in line with the UTC requirements by zoning district for both Durham and Chapel Hill.
Regression analysis reports a coefficient of -0.2809 with non-white populations and UTC coverage, indicating that increased representation of non-white populations is
51
Policy recommendations
This study recommends the amendment or creation of the following policies and actions for the Durham and Chapel ordinances relating to tree protection.
Perform a comprehensive UTC coverage assessment across the entire municipality (See the San Francisco Urban Forest Plan (San Francisco Planning Department, 2014).
Adoption of a municipality-wide UTC coverage minimum, against which all development decisions relating to UTC would be weighed against (See Baltimore, MD goal to reach 40% UTC coverage by 2037 (Tree Baltimore, 2017).
Adoption of parcel-level UTC coverage minimums to supplement the existing zoning district requirements (See Watershed Forestry Resource Guide on augmenting UTC ordinances (Watershed Forestry, 2017).
Increase minimum UTC coverage requirements for residential land uses and zoning districts to at or above 50%
Eliminate or reduce allowances for leeway in the UTC coverage requirements, such as inclusion variable inclusion of the ROW in UTC coverage calculations. Chapel Hill should eliminate the ability to modify UTC minimum coverage requirements under overly generous considerations such as “goals of the comprehensive plan,” given that the comprehensive plan does not contain goals related to UTC.
52
CONCLUSION
The results of this study indicate that the existing development regulations in Durham and Chapel Hill are not adequate to maintain or increase existing UTC. The
presence of disproportionate UTC along racial lines within the study neighborhoods is less conclusive. Further work is needed to tease out the sociodemographic factors that might contribute to UTC coverage disparity.
The literature review found that model ordinances related to the UTC are relatively uncommon. Given the influence on human health and economic activity, further work is needed in the planning realm to strengthen UTC ordinances.
Climate change presents an additional pressure that will affect the health of both residents and trees. As the planet warms, tree mortality rates will increase (Allen, 2009). The conventional loss of urban trees, coupled with the looming threat of increased
temperature and drought from climate change, in sum, present a serious threat to UTC, and by extension, human-health, across the county. Evidence suggests that heat-wave related deaths will increase under RCP 4.5 through RCP 8.5, which are likely to be reached (Wu, 2013). Fortunately, planning’s sphere of influence is well aligned to tackle this problem, as regulations put in place and decisions can substantially alter the built or natural
53
REFERENCES
Akbari, H., Kurn, D. M., Bretz, S. E., & Hanford, J. W. (1997). Peak power and cooling energy savings of shade trees. Energy and Buildings, 25, 139–148. doi:10.1016/S0378-7788(96)01001-8
Anderson, L. M., & Cordell, H. K. (1988). Influence of trees on residential property values in Athens, Georgia (U.S.A.): A survey based on actual sales prices. Landscape and Urban Planning, 15(1-2), 153–164. doi:10.1016/0169-2046(88)90023-0
Arnold, C. A. (2007). Fair and healthy land use: Environmental justice and planning. Planning Advisory Service Report, (549), III,V,VI,VII,1-29,31-51,53-89,91-99,101-135,137-141,143-145,147-159. Retrieved from
http://libproxy.lib.unc.edu/login?url=http://search.proquest.com/docview/23284 7470?accountid=14244
Allen, C. D., Macalady, A. K., Chenchouni, H., Bachelet, D., McDowell, N., Vennetier, M., … Cobb, N. (2010). A global overview of drought and heat-induced tree mortality reveals emerging climate change risks for forests. Forest Ecology and Management, 259(4), 660–684. doi:10.1016/j.foreco.2009.09.001
Berke, P. R., & French, S. P. (1994). The influence of state planning mandates on local plan quality. Journal of planning education and research, 13(4), 237-250.
Berke, P., & Godschalk, D. (2009). Searching for the Good Plan: A Meta-Analysis of Plan Quality Studies. Journal of Planning Literature, 23(3), 227–240.
doi:10.1177/0885412208327014
Cooper, Gregory, Anne Liberti, and Michael Asch. “Replanting Durham’s Urban Forest”. Duke University Master’s Project. Nicholas School for the Environment. April 26 2016. Print.
Cohen, Darryl T. “Population Trends in Incorporated Places: 2000 - 2013.” Population Estimates and Projections: Current Population Reports . US Census , Mar. 2015. Web. 30 Sept. 2016.
<http://www.census.gov/content/dam/Census/library/publications/2015/demo/ p25-1142.pdf>.
Cox, Jennifer Renee, "Suburban Heat Islands: The Influence Of Residential Minimum Lot Size Zoning On Surface Heat Islands In Somerset County, New Jersey" (2014). CUNY Academic Works. http://academicworks.cuny.edu/gc_etds/28
54 Fisher, B., Turner, R. K., & Morling, P. (2009). Defining and classifying ecosystem services
for decision making. Ecological Economics, 68(3), 643–653. doi:10.1016/j.ecolecon.2008.09.014
Heyen, N., Perkins, H. a, & Roy, P. (2006). The Impact of Political Economy on Race and Ethnicity on Producing Environmental Inequality in Milwaukee. Urban Affairs Review 42(1), 3–25.
Jesdale, B. M., Morello-Frosch, R., & Cushing, L. (2013). The racial/ ethnic distribution of heat risk-related land cover in relation to residential segregation. Environmental Health Perspectives, 121(7), 811–817. doi:10.1289/ehp.1205919
Kaplan, R. (2001). The Nature of the View from Home: Psychological Benefits. Environment and Behavior, 33(4), 507–542. doi:10.1177/00139160121973115
Newkirk II, Vann R. “Fighting Environmental Racism in North Carolina.” The New Yorker. 16 Jan. 2016. Web. 30 Sept. 2016. <http://www.newyorker.com/news/news-desk/fighting-environmental-racism-in-north-carolina>.
Nilsson, K., Sangster, M., Gallis, C., Hartig, T., De Vries, S., Seeland, K., & Schipperijn, J. (Eds.). (2010). Forests, trees and human health. Springer Science & Business Media.
Nowak, D. J., & Crane, D. E. (2002). Carbon storage and sequestration by urban trees in the USA. Environmental Pollution, 116(3), 381–389.
doi:10.1016/S0269-7491(01)00214-7
Nowak, D. J., Crane, D. E., & Stevens, J. C. (2006). Air pollution removal by urban trees and shrubs in the United States. Urban Forestry and Urban Greening, 4(3-4), 115–123. doi:10.1016/j.ufug.2006.01.007
Pastor, M., Sadd, J., & Hipp, J. (2001). Which came first? Toxic facilities, minority move-in, and environmental justice. Journal of Urban Affairs, 23(1), 1-21.
Rachel, Baird. “The Impact of Climate Change on Minorities and Indigenous Peoples.” Minority Groups Rights International, Mar. 2015. Web. 30 Sept. 2016.
<http://www.ohchr.org/Documents/Issues/ClimateChange/Submissions/Minority _Rights_Group_International.pdf>.
San Francisco Planning Department. “San Francisco Urban Forest Plan.” Fall 2014. http://default.sfplanning.org/plans-and-programs/planning-for-the-city/urban-forest-plan/Urban_Forest_Plan_Final-092314WEB.pdf
55 Streutker, David R. “Satellite-measured Growth of the Urban Heat Island of Houston,
Texas.” Remote Sensing of Environment 85 (200): 282–289. Print.
Szasz, A., & Meuser, M. (1997). Environmental Inequalities: Literature Review and
Proposals for New Directions in Research and Theory. Current Sociology, 45(3), 99– 120. doi:10.1177/001139297045003006
TreeBaltimore. (2017). About TreeBaltimore. Retrieved from http://www.treebaltimore.org/about/#.WOvPhGkrLRY
United Church of Christ Commission for Racial Justice, Toxic wastes and race in the United States: A national report on the racial and socio-economic characteristics of
communities with hazardous waste sites, Public Data Access, 1987
US Census Bureau (2012). Growth in Urban Populations Outpaces Rest of Nation, Census Bureau Reports. Retrieved March 31, 2017, from
https://www.census.gov/newsroom/releases/archives/2010_census/cb12-50.html
USDA Forest Service (2017). Tree Canopy Assessment. Retrieved from gis.w3.uvm.edu US Global Change Research Program (2015). US National Climate Assessment.
Watershed Forestry. (2017). Urban Tree Canopy: Conducting UTC Assessments and Goal Setting. Retrieved from http://forestsforwatersheds.org/urban-tree-canopy/ Wickham, J.D., Stehman, S.V., Fry, J.A., Smith, J.H., and Homer,
C.G., 2010, Thematic accuracy of the NLCD 2001 land cover for the conterminous United States: Remote Sensing of Environment, v. 114, no. 6, p. 1286–1296
Wilson, O. R. & Bumpass, N. G. & Wilson, O. M. & Snipes, M. H. (2008). The West End
Revitalization Association (WERA)’s Right to Basic Amenities Movement: Voice and Language of Ownership and Management of Public Health Solutions in Mebane, North Carolina. Progress in Community Health Partnerships: Research, Education, and Action 2(3), 237-243. The Johns Hopkins University Press. Retrieved April 1, 2017, from Project MUSE database.
Wilson, S. M., Wilson, O. R., Heaney, C. D., & Cooper, J. (2008). Community Driven Environmental Protection: Reducing the PAIN of the Built Environment in Low Income African American Communities in North Carolina. Social Justice in Context, 3, 41.
Wu, J., Zhou, Y., Gao, Y., Fu, J. S., Johnson, B. a, Huang, C., … Liu, Y. (2013). Estimation and Uncertainty Analysis of Impacts of Future Heat Waves on Mortality in the Eastern United States. Environmental Health Perspectives, 10(1), 1–6.
56 Yuan, F., & Bauer, M. E. (2007). Comparison of impervious surface area and normalized
difference vegetation index as indicators of surface urban heat island effects in Landsat imagery. Remote Sensing of Environment, 106(3), 375–386.