Brian D. Leaf. Developing a Visualization Tool for Archived Social Science Research Data. A Master's Paper for the M.S. in L.S degree. April, 2011. 40 pages. Advisor: Joanne Gard Marshall
When researchers access electronically-archived datasets, is the information readily comprehensible? For survey research, this is often not the case. When online surveys use skip patterns, the path respondents take through the survey will vary depending on how each question is answered. Such skip logic programming is not always obvious when looking at the linear version of the survey instrument. Using the Workforce Issues in Library and Information Science (WILIS) surveys as test cases, a schema was designed to visualize the flow and logic of complex surveys. Wireframes were created to illustrate the schema's potential use as an analysis tool within the open-source Dataverse Network maintained by the Odum Institute for Research in Social Science. Focus groups were used to explore responses to the survey visualization tool by researchers.
Headings:
Librarians
Librarians -- Archivists
DEVELOPING A VISUALIZATION TOOL FOR ARCHIVED SOCIAL SCIENCE RESEARCH DATA
by Brian D. Leaf
A Master‘s paper submitted to the faculty of the School of Information and Library Science of the University of North Carolina at Chapel Hill
in partial fulfillment of the requirements
for the degree of Master of Science in Library Science.
Chapel Hill, North Carolina April 2011
Approved by
Acknowledgments
The WILIS 1, 2 and 3 studies were supported by grants from the Institute of Museum and Library Services. The primary research team for the WILIS3 study at the University of North Carolina at Chapel Hill includes: Joanne Gard Marshall, School of Information and Library Science, Lead Principal Investigator; Jennifer Craft Morgan, Co-Principal
Investigator, UNC Institute on Aging; Jonathan Crabtree, Co-Investigator, Odum Institute for Research in Social Science; Susan Rathbun-Grubb, University of South Carolina, Co-Investigator; Cheryl A. Thompson, Project Manager; Marshica Stanley, Social Research Assistant; Brian D. Leaf, Graduate Research Assistant.
Table of Contents
Acknowledgements i
1. Introduction 1
2. Literature Review 3
3. Methodology 7
4. Focus Group Results 15
5. Conclusion 17
Appendices 19
Bibliography 32
*Supplement 1 *Supplement 2
1. Introduction
As the roles of library and information professionals continue to evolve in the digital age, there has been increasing interest among library and information
professionals in data archiving as a new area of practice. This master‘s paper explores the development of a value-added tool to support survey data analysis. The work was
undertaken as part of the Workforce Issues In Library and Information Science (WILIS) program of research funded by the Institute of Museum and Library Services (IMLS). The first phase of WILIS, known as WILIS 1, involved an in-depth survey of graduates of five library and information science (LIS) programs in North Carolina from 1964 to 2007. WILIS 2 enlarged the recent graduates‘ portion of the WILIS 1 web-based survey so that it could potentially be used as a tool for alumni tracking by all LIS programs in North America. Each of the 39 LIS programs that participated in the WILIS 2 study gathered data were given the opportunity to gather from up to 250 alumni who had graduated in the last five years (2004-2009). The WILIS 3 project, which will be completed in 2012, is focusing on preparing and archiving the WILIS 1 and 2 data for future use by researchers, educators and other stakeholders. WILIS 3 will also produce a toolkit to assist other LIS researchers to prepare and archive their own data for ongoing use.
2) Develop an interactive web interface that allows participating LIS programs to analyze data and benchmark their results with other programs. 3) Explore partnerships with stakeholders such as ALISE to integrate educational data collected from LIS programs with career-tracking and program evaluation data collected by the WILIS 2 project.
4) Explore ways to sustain and expand these data collection efforts among all LIS programs for the long-term, supporting data sharing, LIS educational research, and longitudinal analysis.
5) Document the process of data archiving and create a toolkit or guide that other LIS researchers can use as they design their studies and/or make the data they collect publicly accessible.
6) Disseminate findings and publicize the availability of the career tracking model and accompanying datasets.
(Workforce Issues In Library and Information Science 3: Sustaining the Career Tracking Model through Data Sharing [Grant Proposal], 2009)
As they become increasingly involved in data archiving, LIS professionals will need to develop a variety of tools to assist researchers and others who want to access and use data. The use of such data represents a particular problem for researchers who did not gather the original data and will not be as familiar with its structure. As the WILIS research team considered what was needed to assist researchers in this situation, the idea for a visual tool that represented the structure of the survey instrument emerged. The author was asked to experiment with the creation of such a tool and this master‘s paper is
2. Literature Review
While archives have primarily been the domain of archivists, librarians may be called upon to interact with archives in order to assist others with research and, in this case, enhance access by means of a visualization tool. What roles do librarians and archivists play in the context of archives and repositories? Next, what is truly being visualized, and what sort of knowledge or information does that produce? Information and visualization as they relate to each other are explored. Focus groups are also examined in this review of the literature.
2.1 Archives
The nature of archives and the work of archivists have changed drastically in the past forty years. The ―protectors‖ of knowledge have been considered the domain of both archivists and librarians (Owens, 2003). However, others speak of the ―keepers‖ of information being solely archivists (Samuels, 1986). Sometimes a schism is apparent, as illustrated by an article in The American Archivist in which the state of filling both roles is considered an ―advanced schizoid condition‖ (Horn, 1952).
Other authors have noted that archivists are more crucial than librarians in the research process because of their specialized nature (Ruth, 1988). Jimerson (1989) called for a redefinition of archival duties to encompass not only preservation responsibilities, but a focus on the user in order to satisfy needs for information—a role traditionally held by librarians. To archive was to preserve within a physical space; it was to be ―attached to repositories of public records‖ (Miller, 1976, p. 409). Documents were placed in ―stone or metal boxes‖ or placed ―in folders between pieces of acid-free paper‖ (Voss and
The Internet has not changed the human desire to keep knowledge for posterity, but it has certainly changed the way people can access and use information. The Linking EAD to Electronically Retrievable Sources (LEADERS) project at the University College London is demonstrative of one program focused on the provision of information to users from remote location—something that would have required a lot of time and energy half a century ago. Preservation today has been defined as a ―communication with the future‖ though does not just deal with the physical any longer (Moore, 2008, p. 64), and
archivists are now asked to take on additional roles, including involvement in institutional repositories (Watterworth, 2009).
2.2 Institutional Repositories
The institutional repository (IR) is defined by Clifford Lynch (2003) as ―a set of services that a university offers to the members of its community for the management and dissemination of digital materials created by the institution and its community members.‖
It is essentially a web-based storage and management system for digital works, rooted in the idea of ―open access.‖ In electronic publishing, this essentially refers to the provision
of full-text scholarly research electronically for free (Suber, 2004).
In the literature regarding IRs, both librarians and archivists have been called upon to providing access and contributing to how information is accessed in repositories in addition to their traditional ―custodial roles‖ (Chan, Kwok, & Yip, 2005; Crow, 2004;
Bastian, 2004). It is no surprise that archivists are generally perceived or expected as being active players in IR; their understanding of its physical counterpart would translate well to the IR (Watterworth, 2009). However, they are not solely the domain of
such repositories (Bailey, 2006). The Health Sciences Library and Informatics Center at the University of New Mexico in Albuquerque, New Mexico is an example of an institution that delegated repository responsibilities to Reference and User Support Services because of the view of the web as a ―public service rather than a collection‖
(Phillips, Carr, & Teal, 2005, p. 4). Another example is the Hong Kong University of Science and Technology Library, where all reference librarians assisted in building their institutional repository (Chan et al., 2005).
Archivists‘ roles do not stop with management. Technology has not only allowed
new efficient means of storage, but has enabled research to be shared and built upon without physical boundaries. This unfettered interdisciplinary research is sometimes called ―e-science‖ or by the broader term ―e-research” (Brandt, 2007 p. 365). However, one issue that has arisen from this is the ―data deluge,‖ which refers to the sheer amount
of unorganized data that exists and is ultimately lost (Hey & Trefethen, 2003). A possible solution presented by Purdue Libraries in 1994 was to utilize librarians‘ knowledge, which includes the ―ability to collect, organize, describe, curate, archive, and disseminate
data and information‖ (Brandt 2007, p. 367). 2.3 Knowledge and Visualization
What are data and information? What differentiates the two, and are there further distinctions when discussing knowledge? Ackoff (1989) classifies ―the content of the human mind‖ into five categories: Data, Information, Knowledge, Understanding, and
Wisdom. ‗Data‘ is considered raw—that is, it exists but does not inherently carry
relational database). ‗Knowledge‘ follows as a collection of information that is useful (i.e. ―2 x 2 = 4‖).
Understanding is the ability to take Knowledge and apply it in other contexts. Knowing that ―2 x 2 = 4‖ does not guarantee being able to complete the operation ―2 x 3.‖ However, Bellinger, Castro, & Mills (2004) do not consider understanding as
independent from other categories. In their model, ‗data‘ is a fact such as: It is raining (Bellinger et al., 2004, p. 2). This statement stands alone and does not convey meaning beyond itself. ‗Information‘ suggests a relational connection such as causation: The
temperature dropped 15 degrees and then it started raining (Bellinger et al., 2004, p. 3). ‗Knowledge‘ implies some sort of pattern that might be predictable: If the humidity is
very high and the temperature drops substantially the atmospheres is often unlikely to be able to hold the moisture so it rains (Bellinger et al., 2004, p. 3). All the types of
information within their model are considered to be ‗understood.‘ Regardless of their differences, both schools of thought concur that information requires that data be connected in some way.
Using these two models of information and knowledge, survey research data can be thought of as inherently raw. Data are typically thought of as quantitative (numeric) or qualitative (comments by respondents) and serve in the aggregate as the basis for some sort of analyses (Sandelowski, 2000). It does not become information until it is served in a greater context—such as the questions to which it belongs, and how it functions in relation to other data. Purcell (2009) writes that some of the major challenges of using archival records are ―finding, access, and then understanding the material‖ (p. 46).
the original research was not necessarily intended for. Depending on how the data are archived, it may not be clearly interpreted by third parties.
One way of understanding survey research data and transforming it into information is by visualization. Visualization of knowledge acts as a form of
documentation, and data sets can be difficult to interpret without good documentation (Waters, cited in Green, Dionne, & Dennis, 1999, p. vii). Visualizing knowledge makes knowledge ―explicit and better usable‖ (Keller & Tergan, 2005, p. 2). Visualizations can
help learners cope with ―subject-matter complexity.‖ (Holley & Dansereau, 1984 and Jonassen, Reeves, Hong, Harvey & Peters, 1997, cited in Keller & Tergan, 2005, p. 2). They also assist in the retrieval of ―information structures in large repositories‖ (Keller &
Tergan, 2005, p. 2). Pattern finding comes naturally to humans, and visualizations take advantage of that inclination. By mapping survey questions and data to a visual object, the underlying content is more accessible. Literature for visualizations in archives tend to lie along those that store data such as media objects or GIS, which is visual by definition (Michael, Todorovic, & Beer, 2009; Ozimec, Natter, & Reutterer, 2010). Lacking a visualization tool for survey data, researchers have previously been limited to exploring large scale datasets with statistical analysis software such as SPSS, SAS, and Stata (Vartanian, 2011).
3. Methodology
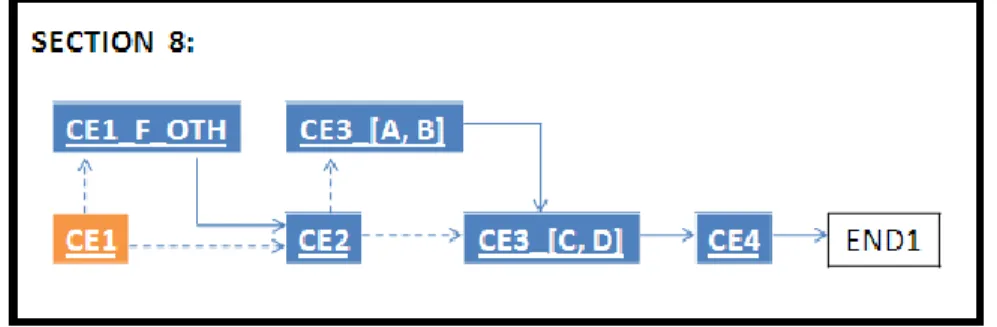
provide answers for an entirely new set of questions about those classes. However, the logic of a survey is not always obvious when looking at the raw programming of a survey. At the beginning of Fall 2010, the author was asked by the WILIS Project Team to come up with a visual diagram of the survey that might explain the logic and flow a little more clearly. The team thought this would help the WILIS research facilitate use of the data by other LIS researchers. One of the few parameters provided by the WILIS team was to not show how the programming in the survey worked, only how the flow of the survey itself worked. For instance, the survey programming in the WILIS 2 alumni survey checks every question against certain criteria. This is not obvious in the diagram. It only shows the possible paths a user can take. The author initially created a diagram using the WILIS 2 alumni survey because of it was shorter in length compared to the more in-depth WILIS 1 career survey, yet still possessed complex programming. An example of the diagram created using Microsoft PowerPoint is shown in Figure 1.1. A key can be found in Appendix A. Each individual shape represents a question in the survey. The solid lines represent mandatory paths, while the dotted lines indicate that a path that is dependent upon how a question is answered.
Figure 1.1 Section 8 of WILIS 2 Flow Chart
WILIS 3 project. Over the next several weeks, the schema was revised incorporating feedback from the various stakeholders. There were three work meetings to discuss the original diagram. The first meeting resulted in one modification of how the one type of question was visualized (See Appendix B). In the second meeting, the diagram was critiqued on its aesthetics and it was suggested that shapes would serve to better
distinguish the types of questions represented in the diagram (See Appendix C). The third meeting highlighted some ambiguity in diagram regarding the logic of the survey, and one more level of granularity was added (See Appendix D).
3.1 Schema Development
The design of the original diagram was informed by Entity-Relationship Diagram (ERD) standards and to a small extent, flow chart symbols. Originally, only rectangles were used to represent questions. In ERD standards, rectangles represent entities or objects between which relationships can be formed (Elmasri & Navathe, 2011). Given that questions are related to other questions in a survey by their possible influence, this seemed to be an appropriate representation. A single question is generally represented by a single rectangle. Each shape contains the question number as written in the raw survey. Lines in the diagram represent paths. They move in straight lines and are only able to move up, down, right, and left. This particular behavior was a decision by the author to make the diagram look ―clean.‖ Indicating alternate paths by using dotted instead of solid lines was also an arbitrary decision.
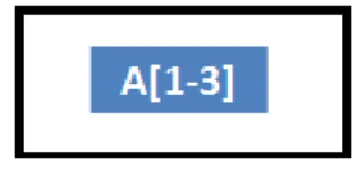
consolidated into a single shape. For instance, a survey question may look similar to this made-up example:
A. Considering your experiences in this field, rate the following items on a scale from 1-10:
A1: Interaction with co-workers
A2: Individual contributions to team projects A3: Effectiveness of project lead
In the diagram, it would be represented similarly to what‘s shown in Figure 1.2.
Figure 1.2 Individual Questions
However, in the revised diagram, the questions were condensed into a single shape, as shown in Figure 1.3.
Figure 1.3 Consolidated Questions
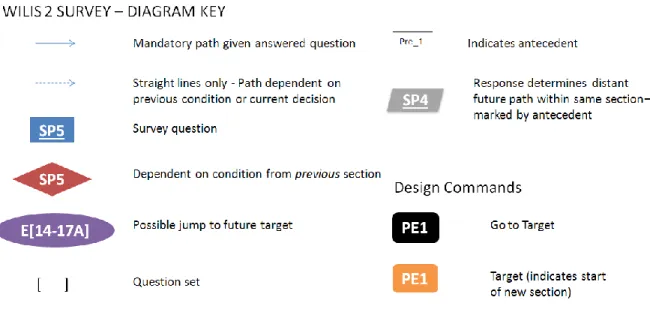
parallelograms were added to the schema. Diamonds represent ―relationships‖ in ERD and ―decisions‖ in flow charts (Hebb, n.d.). The other two shapes were present in other
standards and included in the schema, but their functions in those systems did not have any influence on the type of questions they represented in the context of a survey. The final key can be found in Appendix D.
The Odum Institute, a partner in the WILIS 3 project is considered a leader in data preservation. Odum uses an open source data archiving application for social science research data known as the Dataverse Network (Dataverse), This application allows researchers to ―publish, share, reference, extract and analyze‖ data (―Learn About the Project,‖ n.d.). Such data repositories are created with the goal or making data accessible
for secondary data analysis and solving problems with that are not always available, organized, or may have been previously archived data and then lost (King, 2007). Cataloging and citation practices may differ, or research becomes inaccessible once the researcher is no longer involved in the study. This application is a solution chosen by WILIS 3 presented for the problem of data loss. The Dataverse has an interactive web interface that researchers can easily use to analyze data without downloading and inputting into a local software package. Its visual theme and functions were used to design the framework for the visualization tool. Focus groups were then used to gather feedback and revise the tool.
3.2 Focus Groups
Focus groups were intended to be the main data source for evaluating the
studies of focus groups to address the needs of designers have proved to be effective for ―providing inspiration‖ (Bruseberg & McDonagh-Philp, 2002, p. 36). Fern (1982) lists
four commonly-held assumptions regarding focus group interviewing:
(1) the focus group‘s output is in some way better than the output of individual interviews,
(2) moderators are crucial to the focus group process,
(3) focus groups should be composed of eight to 12 members, and (4) group participants should be strangers (p. 2).
While these are generally accepted guidelines, there is evidence that focus groups may not be an effective means of production. In a study by Taylor, Berry, and Black (1958), undergraduate men were not as prolific in groups as their individual counterparts. This was replicated again several years later by Dunnette, Campbell, and Jaastad (1963) with research scientists and advertising personnel. There is a dearth in the literature regarding two-person groups; however, Fern (1990) did find that while groups did not produce as many ideas as the same number of individuals working alone, larger focus groups (eight members) produced more ideas than smaller focus groups (four members).
For this visualization tool, the focus groups were comprised of WILIS researchers and Odum staff. Each group was given an overview of how the extended tool works, a chance to review the wireframe, and then led in a discussion by the author. The feedback was categorized and summarized, and significant changes were incorporated into the schema based on that feedback. Originally, a single 8-person group of stakeholders comprised of the following were targeted to participate in a focus group:
Odum Institute Staff affiliated with WILIS
The type of qualitative data recorded: Perceived ease of use
Perceived usefulness of data
Design feedback
This data would inform:
Needs that researchers may have
Ways of improving the tool based on those needs
Ways of improving the tool based on how they perceive the tool is used
A Doodle poll was sent out to researchers asking for their availability during a three-week window of time (See Appendix J). They were given a single week to list their availability. Six out of eight responded; however, their schedules were rather restrictive and given the time frame of the project, there was no way to look beyond those three weeks. While it would have been possible to schedule a group of four or three at certain times, the remainder of the researchers would not be available except as individuals. In order to address this, three groups of two researchers each were assembled. It should be recognized these did not meet all focus group expectations or assumptions and should not be accepted as normal practice. In order to foster a normative environment, concepts and ideas from previous groups were presented to each subsequent group if it had not yet been broached. While the expected criteria in terms of numbers were not met, the focus groups were conducted as normal otherwise.
on my personal laptop. Each participant was required to sign consent forms for their participation in the focus group (See Appendix I). Generally, each focus group session went as follows: First, the history and function of the visualization tool leading up to the design of the current tool were explained. Supplemental handouts with which participants could follow along were provided. Second, the tool was demonstrated to the focus group participants on an overhead projector. The tool was a series of wireframes, which in aggregate, comprise the schematics for possible development. This was followed by a short amount of time for general feedback before moving into the discussion questions. Notes were also taken by hand. Two focus groups took place in one day, while the other was conducted two days later.
4. Focus Group Results
The written notes were recorded into an Excel Spreadsheet. Then, the audio was reviewed to record anything that might have been missed. The purpose of collecting this data was to come up with changes that could be made to the design of the visualization tool either in its documentation or mock-up (if the change could be visually illustrated). Each idea can be attributed to one or more participant in either a single focus group or across focus groups. However, the goal was not to analyze the discussion and
1. Researcher Needs
Participants mentioned that the only supplement tool usually found with secondary datasets was the codebook. However, there was general agreement that codebooks lack the contextual and intrinsic information needed to truly understand the research. The ability to improve ―learning‖ a survey was cited as an important quality for a new tool.
2. Extended Uses of the Tool
While reception of the visualization tool was generally positive, participants stated that researchers typically are looking for very specific information when looking at datasets. Participants found the idea of being able to examine typical uses of the data or easily parse out common themes to be an attractive feature.
3. Barriers to Access
Something that was criticized throughout the groups was the learning curve involved with the diagram. It employs different shapes and colors to in order to fully explain a survey such as the WILIS survey. Having to switch back and forth between the key and the diagram was undesirable.
4. Shallow Exploration
5. Audience
Two out of the three focus groups also had a concern with the user. It was suggested that graduate students and novice researchers might derive more benefit out of its use.
Another group suggested that this may be a tool linked to popular media and news, and discernible consumers might use this to examine reported research more closely. 6. Feasibility
Conceptually, participants did not have a problem with the tool. However, the question of its actual development and implementation was mentioned by two out of the three
groups. Manually drawing each screen would be too time-consuming and leave too much room for error. Automation would require more technical expertise.
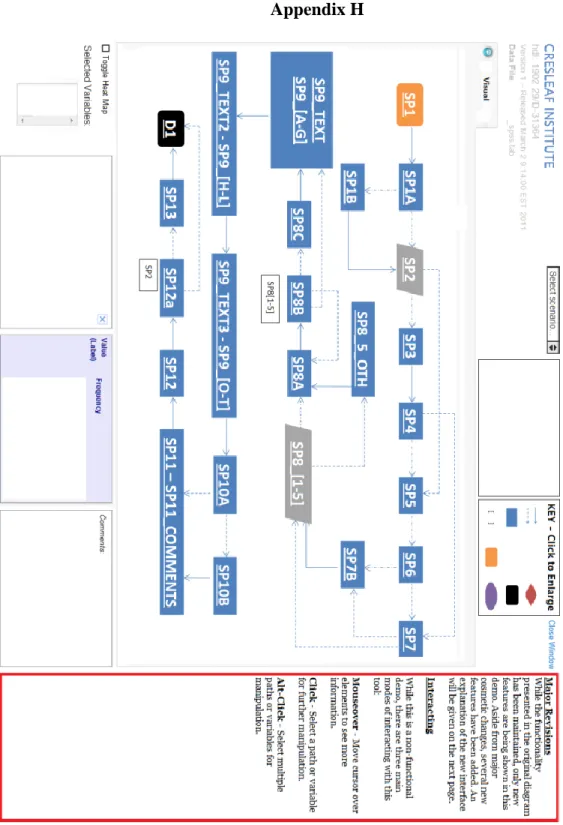
These themes and other feedback elicited from the groups translated into a heavy revision of the tool. The tool is presented in three parts. The first is in Appendix D, which lays out the key (otherwise known as the schema) of the diagram. The second is in a series of screenshots presented to the focus groups. Examples of both can be found in Appendix F and H, where there are web links to the actual, full-color demonstrations.
5. Conclusion
Appendix A
Appendix B
Figure B1. First Revised Key. Revisions:
Indication of conditional loops are removed.
Color (green) indicatin g that text of each question is asked for each subsquent
Appendix C
Figure C1. Second Revised Key.
Figure C2. Example of diagram. Revisions:
Appendix D
Figure D1. Final Revision of Key. Revision:
1. Antecedent indicator and complementary shape added to diagram for another level of granularity.
Appendix E – Focus Group Guide
Instrument Title: Focus Group: Usability Total Participant time required: 1 hour
Total focus group time: 1 hour
Break: 0 minutes
PURPOSE OF FOCUS GROUP DISCUSSIONS:
The focus groups will collect data on the perceived usability and usefulness of the tool, and feedback on the tool aesthetics.
2.1I. Introduction (5 m)
Welcome participants and introduce yourself.
Explain the general purpose of the discussion and why the participants were chosen.
Discuss the purpose and process of focus groups
Explain the presence and purpose of recording equipment
Outline general ground rules and discussion guidelines such as the importance of everyone speaking up, talking one at a time, and being prepared for the moderator to interrupt to assure that all the topics can be covered.
Address the issue of confidentiality.
Inform the group that information discussed is going to be analyzed as a whole and that participants' names will not be used in any analysis of the discussion. First, let’s find out some more about each other by going around the room one at a time. Tell us your name and job.
This group is convened to generate a list of actionable items that can be used to improve the current design of this visualization tool. This tool is not functional, but rather a series of wireframes that can fully demonstrate its potential as a prototype. The design decisions behind both the original and extended tool will be fully explicated before moving onto questions to that will guide the discussion.
2.2 II. Tool Demonstration (10 minutes)
Presentation materials will also be available in hard cover for perusal during the session.
Design decisions for survey diagram Demonstrate extended visualization tool
2.3 II. Discussion (40 minutes)
Focus Group Guidelines:
These questions are designed to establish background on researcher needs and elicit specific information regarding the function, look, and usefulness of the tool. The
discussion should be informal. In fact, we encourage you to respond directly to the comments other people make. A discussion may be stopped abruptly in order to move on to the next question
As discussed in the consent form, we will be tape recording the discussion, because we don’t want to miss any of your comments. No one outside of this room will have access to these tapes and they will be destroyed after the analysis has been completed.
Focus Group Questions:
1. What are some obstacles that you have encountered in using secondary data sets? 2. What features have you desired in other visualization and/or analysis tools?
3. Can you recall supplemental tools that researchers have provided with their deposited data sets?
4. After seeing this tool demonstrated, do you perceive that it meets its intended purpose?
5. How would you evaluate its use? 6. Is the information presented logically?
7. How frequently might you use this tool in the context of research? 8. What features seem most useful to you? In what contexts?
9. What features seems least useful, or in need of re-evaluation? 10.Do you have any further recommendations?
2.4 V. Closing (5 m)
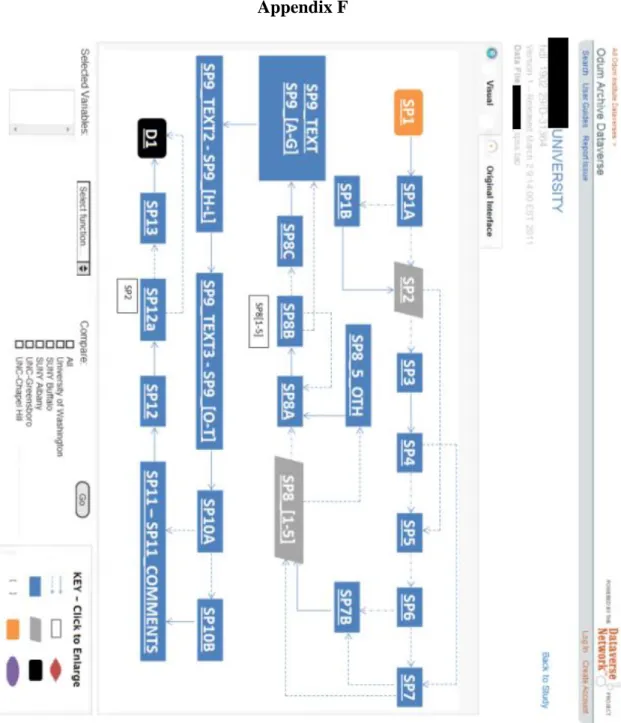
Appendix F
Figure F1. Wireframe Example. This image has been rotated to fit the page. This is the first screenshot of the visualization tool presented to the focus groups. The full
Appendix G
Recorded Responses from Notes and Audio
Functionality of Tool Possible Change in Diagram Final Revision
Search function Search/controlled vocabulary/subject headings Not visible.
Stops Indication of where survey can stop "Status Window" reveals information
Selecting multiple paths Selecting paths with feedback. I.e. these two paths cannot be selected
Highlighting and "Status Window" alerts user.
Information Produced
Most frequented paths "Heat map" Heat Map toggle
Common scenarios Drop down menu Scenarios menu added to top of
tool.
Key themes Technical: metadata on key themes Revealed in various spots in tool; input not visible.
Contextual knowledge More information about survey or sections as a whole.
"Status Window" and "Comments" box
Manual to accompany schematics
Guide to tool. All diagrams in Appendices have
been annotated. Tool Design
Learning curve to diagram
Key should pop up with other information in entity instead of displayed as a separate pop-up.
"Status Window" reveals information regarding particular questions. It can still be accessed as a separate key.
Mouse-over/clicks Utilize mouse-over to allow additional information.
Added to diagram.
Selectors not obvious Double line instead of red selector Double line instead of red selector
Branding Banner not visible in screenshots, but DVN allows branding
Survey separated from tools
Visualization of survey pops up as separate window instead of embedded; so analysis tools are still visible and interface doesn't change in case you don't need it. Plus, no way to show all possibilities
Not a cosmetic change, but tool can be considered a pop-up window.
Visibility of paths Not obvious in screenshot; limitation of graphics N/A
Appendix H
Appendix I
University of North Carolina-Chapel Hill
Consent to Participate in a Research Study
Adult Participants Developing a Visualization Tool for Archived Social Science Survey Research
Social Behavioral Form
________________________________________________________________________
IRB Study #05-0590
Consent Form Version Date: March 26, 2011
Title of Study: Workforce Issues in Library and Information Science
Focus Group Facilitator (Research Assistant): Brian Leaf
UNC-Chapel Hill Department: Institute on Aging, School of Information & Library Science
UNC-Chapel Hill Phone number: (919) 966-9444
Funding Source: Institute for Museum and Library Services (IMLS)
Facilitator phone number: (919) 370-1534 Facilitator email: [email protected]
_________________________________________________________________
What are some general things you should know about research studies?
You are being asked to take part in a research study. To join the study is voluntary. You may refuse to join, or you may withdraw your consent to be in the study, for any reason, without penalty.
Research studies are designed to obtain new knowledge. This new information may help people in the future. You may not receive any direct benefit from being in the research study. There also may be risks to being in research studies.
Details about this study are discussed below. It is important that you understand this information so that you can make an informed choice about being in this research study. You will be given a copy of this consent form. You should ask the researchers named above, or staff members who may assist them, any questions you have about this study at any time.
What is the purpose of this study?
This group is convened to generate a list of actionable items that can be used to improve the current design of this visualization tool. The focus group and interview questions are designed to establish background on researcher needs and elicit specific information regarding the function, look, and usefulness of the tool.
How many people will take part in this study?
If you decide to be in this study, you will be one of approximately 12 people participating in this part of the study.
How long will your part in this study last?
This session should last approximately one hour, and a follow-up interview will take approximately 15 minutes.
What will happen if you take part in the study?
During the course of this interview, the following will occur: The interview will be conducted one-on-one with a trained interviewer who will be asking questions regarding a revised visualization tool that will be sent to the participant prior to the interview. This interview may take place over the telephone. If you are not located in a private room, the interview will be rescheduled. The interview will be digitally recorded, however, only project staff will have access to the audio file. You may request that the recorder be turned off at any time during the interview. Audio files will be destroyed upon completion of the analysis.
What are the possible benefits from being in this study?
Research is designed to benefit society by gaining new knowledge. You may not benefit personally from being in this research study. However, societal benefits include improved workforce and educational planning.
What are the possible risks or discomforts involved from being in this study?
We do not think you will experience any discomfort or risks by participating in this study.
How will your privacy be protected?
You will not be identified in any report or publication of this study or its results. Your name will not appear on any transcripts. You will not be identified in any presentation or written reports about this study. We might use direct quotes from you, but these would only be quoted as coming from ―a person‖ or like ―one woman said.‖ There will be no way to identify individual participants.
University, research sponsors, or government agencies for purposes such as quality control or safety.
Will you receive anything for being in this study?
You will not receive an incentive for this study.
Will it cost you anything to be in this study?
There will be no costs for being in the study
What if you have questions about this study?
You have the right to ask, and have answered, any questions you may have about this research. If you have questions, or concerns, you should contact the researchers listed on the first page of this form.
What if you have questions about your rights as a research participant?
All research on human volunteers is reviewed by a committee that works to protect your rights and welfare. If you have questions or concerns about your rights as a research subject you may contact, anonymously if you wish, the Institutional Review Board at 919-966-3113 or by email to [email protected].
- - -
Participant’s Agreement:
I have read the information provided above. I have asked all the questions I have at this time. I voluntarily agree to participate in this research study.
_________________________________________ _________________ Signature of Research Participant Date
_________________________________________ Printed Name of Research Participant
_________________________________________ _________________ Signature of Person Obtaining Consent Date
Appendix J
Automated Doodle Email to Schedule Focus Groups
SUBJECT: WILIS/Odum Focus Group for Brian Leaf's Master's Project
Thank you for your previous feedback and encouragement on the visual diagram I created for the WILIS program archive. To complete my master's paper, I would greatly appreciate your participation in 1-2 focus groups (depending on availability) designed to gather additional usability feedback on this analysis tool.
This session(s) will take approximately an hour, and will start no sooner than April 4th. Please respond by next Tuesday, March 29th, 2011, if possible. I will announce the times shortly after.
Sincerely,
Bibliography
Workforce Issues in Library and Information Science 3 (WILIS3): Sustaining the Career Tracking Model through Data Sharing. (2009). Grant Proposal. Institute of Museum and Library Services. Principal Investigator: JG Marshall. Co-Principal Investigator: J Craft Morgan. Co-investigators: S Rathbun-Grubb, J Crabtree, D Sheaves, C Thompson, S Crawford.
Ackoff, R. L. (1989). From Data to Wisdom. Journal of Applies Systems Analysis, 16, 3-9.
Arzberger, P., Shroeder, P., Beaulieu, A., Bowker, G., Casey, K., Laaksonen, L., Moorman, D., Uhlir, P., and Wouters, P. (2004). Promoting Access to Public Research Data for Scientific, Economic, and Social Development. Data Science Journal, 3, 135-152.
Bailey, C.W. (2006). Institutional Repositories (SPEC Kit 292). Association of Research Libraries. Retrieved from http://docs.lib.purdue.edu/lib_research/104
Bastian, J.A. (2004) Taking Custody, Giving Access: A Postcustodial Role for a New Century. Archivaria, 53(1), 76-93.
Bellinger, G., Castro, D., & Mills, A. (2004). Data, Information, Knowledge, and Wisdom. Retrieved from http://www.systems-thinking.org/dikw/dikw.htm. Brandt, D. (2007). Librarians as partners in e-research: Purdue University Libraries
Bruseberg, A., McDonagh-Philp, D. (2002). Focus groups to support the
industrial/product designer: a review based on current literature and designers‘
feedback. Applied Ergonomics, 33, 27-38.
Brown, Dan M. (2010). Communicating Design: Developing Web Site Documentation for Design and Planning, Second Edition. Berkeley: New Riders Press.
Chan, D.L.H., Kwok, C.S.Y. & Yip, S.K.F. (2005). Changing roles of reference librarians: the case of the HKUST institutional repository. Reference Services Review, 33(3), 268-282.
Couper, M., Traugott, M., & Lamias, M. (2001). Web survey design and administration. Public Opinion Quarterly, 65, 230-253.
Crow, R. (2002). The case for institutional repositories: a SPARC position paper.
Association of Research Libraries. Retrieved from http://.arl.org/sparc/IR/ir.html Learn About the Project. The Dataverse Network Project. (n.d.). Retrieved from
http://thedata.org/book/learn-about-project
Elmasri R. & Navathe S.B. (2010). Fundamentals of Database Systems (6th edition). Boston: Addison Wesley.
Fern, E.F. (1982). The Use of Focus Groups for Idea Generation: The Effects of Group Size, Acquaintanceship, and Moderator on Response Quantity and Quality. Journal of Marketing Research, 19(1), 1-13.
Green, A., Dionne, J., & Dennis, M. (1999). Preserving the whole: A two-track approach to rescuing social science data and metadata. Retrieved from
Hebb, Nicholas. (n.d.). What is a Flow Chart? Retrieved from http://www.breezetree.com/articles/what-is-a-flow-chart.htm
Hey, A. J. G., & Trefethen, A. E. (2003). The data deluge: An e-science perspective. In F. Berman, G. C. Fox, & A. J. G. Hey (Eds.), Grid computing: Making the global infrastructure a reality, (pp. 809–824). Wiley and Sons.
Holley, C.D., & Dansereau, D.F. (1984). The development of spatial learning strategies. In C.D. Holley & D.F. Dansereau (Eds.), Spatial learning strategies. Techniques, applications, and related issues (pp. 3-19). New York: Academic Press.
Horn, A.H. (1982). The University Archivist and the Thesis Problem. The American Archivist, 15(4), 321-331.
Jonassen, D.H., Reeves, T.C., Hong, N., Harvey, D., & Peters, K. (1997). Concept mapping as cognitive learning and assessment tools. Journal of Interactive Learning Research, 8(3), 289-308.
Keller, T. & Tergan, S.O. (2005). Visualizing Knowledge and Information: An Introduction. In T. Keller & S.O. Tergan (Eds.), Knowledge and Information Visualization: Searching for Synergies (pp. 1-23). Berlin: Springer-Verlag. King, G. (2007). An Introduction to the Dataverse Network as an Infrastructure for Data
Sharing. Sociological Methods & Research, 36, 173-99.
LEADERS. (n.d.). . Retrieved from http://www.ucl.ac.uk/leaders-project/
Lynch, C.A. (2003). Institutional repositories: Essential infrastructure for scholarship in the digital age. Association of Research Libraries. Retrieved from
Michael, C., Todorovic, M., & Beer, C. (2009). Visualizing Television Archives. Bulletin of the American Society for Information Science & Technology, 35(5), 19-23. Miller, W.E. (1976). The Less Obvious Functions of Archiving Survey Research
Data. American Behavioral Scientist, 19(4), 409-418.
Moore, R. (2008). Towards a Theory of Digital Preservation. The International Journal of Digital Curation, 3(1), 63-75.
Odum Institute. (1998). 1998 Fall Georgia Poll. [Data file]. University of Georgia: Survey Research Center. Retrieved from http://hdl.handle.net/1902.29/D-31364 Odum Institute Dataverse Network. (n.d.). . Retrieved from http://arc.irss.unc.edu/dvn/ Owens, B. (2003). The safeguarding of memory: The divine function of the librarian and
archivist. Library & Archival Security, 18 (1), pp. 9–41
Ozimec, A., Natter, M., & Reutterer, T. (2010). Geographical Information Systems-Based Marketing Decisions: Effects of Alternative Visualizations on Decision Quality. Journal of Marketing, 74(6), 94-110.
Phillips, H., Carr, R. & Teal, J. (2005). Leading roles for reference librarians in institutional repositories. One library's experience. Reference Services Review, 33(3), 301-311.
Purcell, A.D. (2009). Making the Most of Your Historical Assets. Information Management, 43(1), 46-48.
Samuels, H.W. (1986). Who Controls the Past. American Archivist, 49, 109-124. Sandelowski, M. (2000). Focus on Research Methods: Combining Qualitative and
Stern, D. (2003). New knowledge management systems: The implications for data discovery, collection development, and the changing role of the librarian. Journal of the American Society for Information Science and Technology, 54, 1138–1140. Suber, P. (2004) Open Access Overview. Available from
http://www.earlham.edu/~petes/fos/overview.htm
Szybillo, G. & Berger R. (1979). What advertising agencies think of focus groups. Journal of Advertising Research, 19, 29-33.
Theodorou, R. (2010). OA Repositories: the Researchers' Point of View. Journal of Electronic Publishing, 13(3).
Vartanian, T. (2011). Secondary data analysis. New York, NY US: Oxford University Press.
Vicente, P., & Reis, E. (2010). Using Questionnaire Design to Fight Nonresponse Bias in Web Surveys. Social Science Computer Review, 28(2), 251-267.
doi:10.1177/0894439309340751.
Voss, P. J. & Werner, M. L. (1999). The Poetics of the Archive. Studies in the Literary Imagination, 32(1).
WILIS Project. (n.d.). Retrieved from http://www.wilis.unc.edu/