EVALUATION OF CHITOSAN AS A COAGULANT FOR DRINKING
WATER PRETREATMENT USE WITH CERAMIC FILTER
Xinyu Chen
A Technical Report submitted to the faculty at the University of North Carolina at
Chapel Hill in partial fulfillment of the requirements for the degree of Master of
Science in Environmental Engineering in the Department of Environmental
Sciences and Engineering in the Gillings School of Global Public Health.
Chapel Hill
2015
Approved by:
Mark Sobsey
iii ABSTRACT
Xinyu Chen: Evaluation of chitosan as a coagulant for drinking water pretreatment use in ceramic filter
(Under the direction of Mark Sobsey)
ACKNOWLEDGEMENTS
First, I would like to thank my advisor, Dr. Mark Sobsey for his support and guidance throughout this research process. I would particularly like to thank postdoctoral fellow, Dr. Lydia Abebe for your constant support, guidance, and for reviewing these briefs, drafts and this technical report. I also wish to acknowledge the role of Dr. Glenn Walters and Dr. Pete Kolsky as examiners during my Master’s Defense of this report. I would also like to thank Javier
Sanchez, John Agres, Jessica Nelson, Stephanie Okonmah-Obazee and Wesley Johnson for their laboratory assistance and contributions to the experiments.
I would also like to thank Dr. Ampai Soros, and Dr. Lisa Casanova for the initial
screening of various chitosans for coagulation, flocculation and sedimentation that informed the initial design of this study by identifying the preferred candidate chitosans used in this project. I am grateful to my friend, Jitong Lou for his valuable help on statistical analysis.
v
TABLE OF CONTENTS
LIST OF TABLES... vii
LIST OF FIGURES ...viii
LIST OF ABBREVIATIONS ...ix
CHAPTER 1: INTRODUCTION ...1
CHAPTER 2: PROBLEM IDENTIFICATION ...2
Introduction...2
Global Drinking Water issue...2
Household water treatment...3
Ceramic water filter...4
Coagulation for pretreatment...6
CHAPTER 3: TECHNICAL OPTIONS DEVELOPMENT...6
Introduction...6
Coagulants for Water Treatment………6
Chitosan Background………9
Possible Options…...10
Technical Options Identification...11
CHAPTER 4: RESEARCH DESIGN ...13
Introduction...13
Materials & Methods ...13
CHAPTER 5: RESULTS & DISCUSSION...18
Results ...18
Discussion...22
CHAPTER 6: FUTURE WORK ...25
Introduction...25
Next Steps ...25
Marketing Plan...26
CHAPTER 7: CONCLUSIONS ...30
vii
LIST OF TABLES
Table 1: Description of Treatment Technologies and Methods ofWater Purification.………..…..4 Table 2: Chemical Coagulants for Water Treatment and Their
Advantages and Disadvantages ...8
Table 3: Summary of Performance & Parameters of Concern for
Possible Options………...11 Table 4 Ranges of Influent Turbidity and Initial Log10 Concentrations
of E.coli and MS2 in Three Chitosan Salts Experiments (Filtration
Without Chitosan) ...18 Table 5: Log10 Microbial Reductions and Final Effluent Turbidity of
Test Water by Chitosan HCl. Mean (±SD) for 3 Replicate
Experiments per Condition...19 Table 6: Log10 Microbial Reductions and Final Effluent Turbidity of
Test Water by Chitosan Lactate. Mean (±SD) for 3 Replicate
Experiments per Condition...20 Table 7: Log10 Microbial Reductions and Final Effluent Turbidity of
Test Water by Chitosan Acetate. Mean (±SD) for 3 Replicate
Experiments per Condition...21 Table 8: Summary of Microbial Reduction by Contribution of Chitosan
Candidates Only...24 Table 9: Raw Material Cost of Chitosan Acetate and P&G Purifier of
LIST OF FIGURES
Figure 1: Chitosan’s Structure ………..………..8
Figure 2: Examples of Modified Chitosan: Chitosan Lactate (a) and Chitosan Acetate (b) ………...………..………10
Figure 3: Effect of Chitosan HCl on E.coli removal………..………...19
Figure 4: Effect of Chitosan HCl on MS2 removal..………...19
Figure 5: Effect of Chitosan Lactate on E.coli removal..………..20
Figure 6: Effect of Chitosan Lactate on MS2 removal..………..………..20
Figure 7: Effect of Chitosan Acetate on E.coli removal..………..22
Figure 8: Effect of Chitosan Acetate on MS2 removal..………22
ix
LIST OF ABREVIATIONS
B2B Business to Business B2C Business to Customer
CDC Centers for Disease Control and Prevention CFU Colony Forming Units
CMWG Ceramics Manufacturing Working Group
CWF Ceramic Water Filter
EPA Environmental Protection Agency
GDWQ Guidelines for Drinking-water Quality
JMP Joint Monitoring Programme HWT Household Water Treatment NTU Nephelometric Turbidity Unit
POU Point of Use
SODIS Solar water disinfection
SAL Single Agar Layer
TSA Tryptic Soy Agar
TSB Tryptic Soy Broth
CHAPTER 1: INTRODUCTION
2
CHAPTER 2: PROBLEM IDENTIFICATION Introduction
Safe drinking water is a major concern in developing countries due to inadequate access to improved sources of drinking water. In order to address shortfalls in access to safe drinking water, household water treatment has been widely promoted as a solution to increasing the quality of drinking water. Several household water treatment technologies have been evaluated based on technical effectiveness and experiences in user households; ceramic water filters have been identified as a promising technology due to their low cost, technical performance, and sustainability in long term use (Sobsey, Stauber & Casanova et al., 2008). While ceramic water filters are effective at removing turbidity and large microorganisms (e.g. bacteria and protozoa), the filters are not capable of substantially removing viruses without sacrificing flow rate below practical levels. Additionally, rapid clogging of filters in regions with highly turbid water can be a negative consequence that deters the use of filters. To address this shortfall, a pretreatment process before filtration can be used in combination with filters to enhance the removal of
viruses. Hence, finding suitable coagulants for the drinking water pretreatment becomes a key to solve this problem. Natural coagulants may be of great interest because they are naturally
occurring, low-cost products, characterized by their environmentally friendly characteristics. Among natural coagulants, chitosan may be considered as one of the most promising coagulation materials because of its non-toxicity, biocompatibility, and biodegradability.
Safe drinking water is a major concern in developing countries. More than 700 million people around the world lack access to improved sources of drinking water and nearly half of this population lives in sub-Saharan Africa. Each year, there are nearly 1 million diarrheal deaths related to unsafe water and sanitation, and the majority of them are children age under 5 years in developing regions. In 2012, 89% of the world’s population, approximately 6.1 billion people, used improved sources of drinking water (WHO, UNICEF, 2014). Improved sources of drinking water are defined as types of technology and levels of services that are more likely to provide safe water than unimproved systems or sources, which include household connections, public standpipes, boreholes, protected dug wells, protected springs, and rainwater harvesting. Other sources, including unprotected wells, unprotected springs, vendor-provided water, bottled water (unless water for other uses is available from an improved source) and tanker truck-provided water are considered unimproved water sources.
According to the JMP report (WHO, UNICEF, 2014), there is a large water access gap between urban and rural areas in the world. While 96% of the urban population uses improved sources of drinking water, only 82% of the rural population has access. The gap is even larger between developed and developing countries. In high-income regions, both urban and rural population have 100% access to an improved source of drinking water, while in low-income regions, 87% of the urban population uses improved sources of drinking water and only 61% of the rural population has access.
Household Water Treatment
4
promoted as a promising solution. There are a variety of such technologies available for use including physical, chemical and biological treatments to improve the microbial quality of drinking water. Table 1 provides a summary of household water treatment technologies and descriptions of their method of purification.
Table 1: Description of treatment technologies and methods of water purification
Treatment Purpose
Disinfection. Chlorination with Safe Storage.
Chorine added to drinking water followed by storage in containers designed to reduce the risk of contamination. Combined Coagulant-Chlorine
Disinfection Systems.
Commercial units that combine dry coagulation and chlorine as tablets or sachets.
SODIS (Solar Disinfection)
Transparent polyethylene terephthalate (PET or PETE) bottles filled with aerated source water and left in the
sun to disinfect the water by solar UV and increased temperature.
Filtration Ceramic Filter. Porous ceramic (fired clay) filters to remove microbes from drinking water by size exclusion.
Biosand Filter
A household version of the slow sand filter where potentially pathogenic microorganisms are removed by a biofilm layer, which forms in the top few centimeters
of the filter.
Ceramic Water Filter
Ceramic water filters (CWFs) are a low-cost technology that can be locally produced in the countries where they are intended for use using locally sourced clay, soil and fine sized organic materials such as sawdust or rice hulls. The combined material is fired in a kiln burning away the organic material and leaving behind small pores. The pore sizes and surface charge of the ceramic determine the ability of the filter to remove pathogens and other particles from the water.
However, because this silver leaches out of the filters over time, the long-term pathogen removal may be based primarily on the filtration characteristics (Sobsey et al., 2008).
Field studies suggest CWFs are able to overcome many practical obstacles such as water quantity produced, ability to treat a range of water qualities, ease of operation, time to treat and cost per liter by requiring only one-time initial purchase. They produce sufficient water for daily household use with little time and effort. Further more, with the existence of supply chain for necessary replacement, they can achieve large scale adoption and continued, long-term use (Lantagne, Quick & Mintz, 2006; Sobsey et al., 2008; Hunter, 2009). Therefore, CWFs are a promising technology for household treatment.
Previous studies have measured the removal of protozoans, bacteria, and viruses by CWFs. In studies on CWFs without silver the microorganism removal can be attributed to filtration. Brown (2007) found 1.8–2.4 log removal of Escherichia coli and 1.3–1.9 log removal of MS2 bacteriophage, respectively. In Van Halem’s (2006) study, log removals of 2–5.99, and 1.06–2.31 were achieved for E. coli, and MS2, respectively, for filters without sliver. In addition, several previous studies also measured the pore size in CWFs. CWFs from the Potters for Peace factory in Nicaragua showed a pore size range from 0.6 to 3 µm in areas of the filters without cracks (Lantagne, 2001); and 0.02–200 µm with 14 µm the predominant size (Van Halem, 2006). The pore sizes in ceramic disks produced in the lab from flour, grog, and clay were primarily 0.02–15 µm, with a few 100–490 µm (Oyanedel-Craver and Smith, 2008). These results indicate that filtration-based removal of viruses (<0.1 µm) should be poor, particularly because the bulk of the water is likely to flow through the cracks or larger pores. Additionally, the US
Environmental Protection Agency requires a POU to be capable of a 6 log10 (99.9999%), 4 log10
6
1998). Therefore, it is necessary to improve the performance of CWFs on virus removal for better dealing with microbial threats.
Coagulation as Pretreatment
Adequate virus removal performance for CWFs can be achieved through adding
coagulation as a pretreatment process. Coagulation is a commonly applied process in the primary purification of water and wastewater treatment. Coagulation using chemical coagulants consists of combining insoluble particles and/or dissolved organic matter into large aggregates by
physical-chemical reactions with an added chemical coagulant, thereby facilitating their removal in subsequent sedimentation, floatation/filtration stages.
CHAPTER 3: TECHNICAL OPTIONS DEVELOPMENT Introduction
In Chapter 2, adding a coagulation process as drinking water pretreatment use with ceramic filters is proposed. This chapter overviews the commonly used chemical coagulants and compares chitosan (novel application), alum (commonly used coagulants), and P&G Purifier of Water 1(a commercial product), as possible coagulants for household use (Lantagne et al., 2006, Crittenden, Trussell & Hand et al., 2012). After the comparison, three chitosan salts, chitosan hydrochloride, chitosan lactate and chitosan acetate are identified as technical options for further exploring.
Coagulants for Water Treatment
The coagulants frequently used are mineral additives including metal salts (i.e.
polyaluminium chloride) and synthetic polymers (i.e. polyacrylamide). Table 2 lists the 4 main types of chemical coagulants that are commonly used for water treatment and their advantages and disadvantages (Sobsey, 2002; Crittenden et al., 2012).
However, lime and soda ash are infeasible for household practice because the pH
neutralization is too difficult to perform without specific devices. Also, soluble synthetic organic polymers are usually used as additional aids to enhance the effect of coagulation with inorganic salts instead of primary coagulants. Therefore, only aluminum or iron salts and natural polymers
1
8
are potential coagulants for the pretreatment use with ceramic filters. Among natural polymers, biopolymers are particularly promising due to their low-cost and biodegradability and chitosan may be may be considered as one of the most promising coagulation materials (Bratby, 2006). Table 2: Chemical coagulants for water treatment and their advantages and disadvantages
Coagulant Household Use Advantages Disadvantages
Alum/alum potash &
Iron salts Rare-moderate Simple technology
Difficult to optimize without training and equipment Lime (Ca(OH2)),
lime+soda ash (Na2CO3), caustic
soda (NaOH)
Rare-moderate Simple technology
pH control and neutralization a problem; hazardous
chemicals
Soluble synthetic
organic polymers No-rare
Improve coagulation with alum and iron
salts
Hard to dose; need training & equipment; hazardous
chemicals Natural polymers
(carbohydrates) from seeds, nuts, beans,
etc.
Yes (in some developing
countries)
Effective, available
Source plant required; training and skill required;
may be toxic
Chitosan Background
Chitosan is one of the world’s most plentiful and low-cost biopolymers that can be chemically described as a nontoxic, heterogeneous, linear, cationic and biodegradable polysaccharide with high molecular weight (Riva et al., 2011) (Figure 1).
Figure 1: Chitosan’s structure2
2
Chitosan is produced from the alkaline de-acetylation of chitin, which is the second most abundant polysaccharide worldwide. It can be extracted from fungal species or from the
exoskeleton of sea creatures such as crayfish, lobster, prawns, crab and shrimp (Muzzarelli, Ilari, & Tarsi et al., 1994). In this process, the acetyl groups of chitin are hydrolyzed and converted to free amine groups (Rinaudo, 2006). When dissolved, the amino groups on the glucosamine units protonate along the chitosan chain, resulting in increasing solubility and positive charge.
A coagulant with high positive charge density in water at or near neutral pH is more efficient for turbidity and microbial removal than a lower positive charge density or negatively charged coagulant. This is because most natural colloids in water, for example, fine clay, bacteria, silts etc., carry a negative charge over a pH range typical of natural waters, approximately pH 5-9. (Crittenden, Trussell, & Hand, et al., 2012) The combination of the previously mentioned chemical properties contributes to making chitosan a unique adsorbent and coagulant and an ideal candidate for use in water treatment. The specific properties of chitosan such as cationicity, high adsorption capacity, macromolecular structure (Figure 1), abundance and low price (Muzzarelli, Boudrant & Meyer et al., 2012) contribute to make it a unique coagulant and ideal candidate for use in water treatment.
However, the insolubility in water of chitosan polymers means it has to be dissolved in weak acid first before applying, which adds steps to the treatment process and potentially
increases cost. Therefore, chemical modification is an effective solution to produce water-soluble chitosans. In chemical modification, reactions occupy functional groups, mainly amino groups, in which aldehydic functions react with the amino groups (Rinaudo, 2006).
10 Chitosan salts
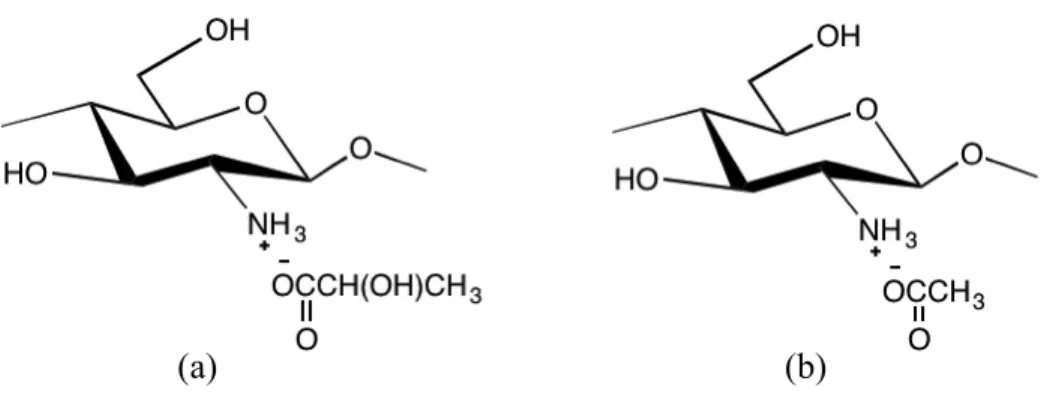
Chitosan salt is the simplest form of modified chitosan for higher solubility in water. Modified chitosan dissolves in water over a wide pH range. In order to make a chitosan salt, chitosan polymer is treated with acid so that acid functional groups (e.g. lactate group (CH3CH(OH)COO- or acetate group (CH3COO-)) are added into chitosan chains (Figure 2),
resulting in a chitosan polymer becoming a chitosan salt bearing specific functional groups from the acid used to modify de-acetylated chitosan.
Figure 2: Examples of Modified Chitosan: Chitosan Lactate (a) and Chitosan Acetate (b) Alum
Alum has been used for purification of drinking water and industrial process water at
least since the Roman Empire (Faust & Aly, 1998) and is commonly used as coagulant in
drinking water treatment in modern facilities. Alum is both a specific chemical compound and a class of chemical compounds. The specific compound is the hydrated potassium aluminum sulfate (potassium alum) with the formula KAl(SO4)2·12H2O. More widely, alums are double
sulfate salts, with the general formula A2(SO4).M2(SO4)3·24H2O, where A is a monovalent
cation such as potassium or ammonium and M is a trivalent metal ion such as aluminum or chromium(III) (Austin,1984).
P&G Purifier of Water
P&G Purifier of Water is a small sachet of powdered ingredients that make contaminated water potable through coagulation and disinfection. It uses the same approach and ingredients as many municipal water-treatment facilities — the two primary components are ferric sulfate, a widely used coagulant, and calcium hypochlorite, a disinfectant. The powder also contains clay and polymer served as a buffer to provide thorough coagulation and flocculation.
Analysis of Possible Options
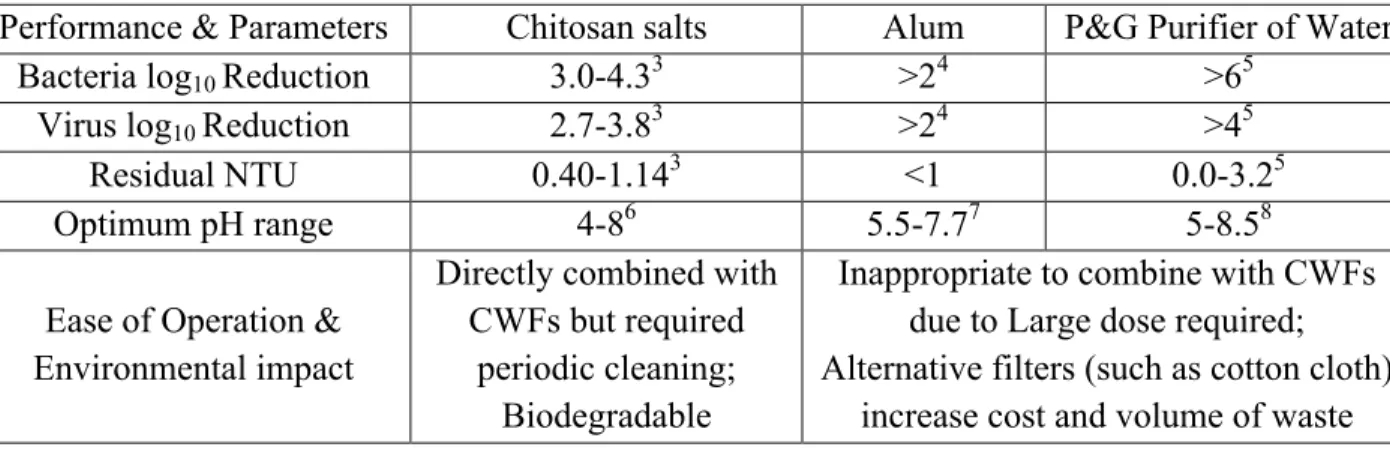
Table 3 is a summary of performance and parameters of concern of the possible options. Chitosan salts have a competitive performance on virus reduction but less effective on bacteria reduction when compared to P&G Purifier of Water. All the options are effective in turbidity removal and have a similar optimum pH range. When considering ease of operation and
environmental impact, chitosan salts are preferable thanks to their biodegradability and low dose required.
Table 3: Summary of Performance & Parameters of Concern for Possible Options
Performance & Parameters Chitosan salts Alum P&G Purifier of Water
Bacteria log10 Reduction 3.0-4.33 >24 >65
Virus log10 Reduction 2.7-3.83 >24 >45
Residual NTU 0.40-1.143 <1 0.0-3.25
Optimum pH range 4-86 5.5-7.77 5-8.58
Ease of Operation & Environmental impact
Directly combined with CWFs but required
periodic cleaning; Biodegradable
Inappropriate to combine with CWFs due to Large dose required; Alternative filters (such as cotton cloth)
increase cost and volume of waste
3 Results of jar tests on Soros’ report (2014)
4 Sproul (1974), Leong (1982), Payment and Armon (1989) cited in Sobsey (2002)
5 Results of laboratory test, source: http://www.pghsi.com/pghsi/safewater/pdf/International_PPOW_handout.pdf, accessed Dec 8, 2015
6Fabris, Chow, & Drikas (2010)
12 Technical Options Identification
According to Table 3, chitosan salts are quite promising as coagulants for household use in combination with ceramic filters. Therefore, we identify chitosan hydrochloride, chitosan lactate and chitosan acetate as candidate coagulants for use with ceramic water filters as three technical options, based on previous work that demonstrated effective coagulation and
CHAPTER 4: RESEARCH DESIGN Introduction
This chapter presents the research design to evaluate the three technical options, which includes materials and methods for experiments. The results of experiments are also presented in this chapter.
Materials & Methods Chitosan Salts
Chitosan hydrochloride (HCl), chitosan acetate (CH3COO−), and chitosan lactate (CH3CH(OH)CO2−) (Soros, 2014) were purchased from Heppe Medical Chitosan GmbH.
Ceramic Water Filters
The ceramic water filters were manufactured locally in Chapel Hill, North Carolina according to the Potters for Peace manufacturing process (CMWG, 2011). The filters were made of clay, sawdust, and water. A lower reservoir consisting of a 5-gallon plastic paint bucket served as a safe water storage unit and a spigot was attached at the bottom of the bucket to access the filtered water. The flow rate of 9 filters was tested by saturating the pores, then filling the filter with water up to the rim, allowing filtrate water to flow by gravity for 1 hr into the lower
14 Challenge Waters
Test water consisted of phosphate buffered saline and clay to model turbid, natural water. Phosphate buffered saline (PBS), pH 7.5 was prepared by adding the following to 1L of water: NaCl; KCl; Na2PHO4, anhydrous; and KH2PO4 were added according to EPA Method 1623. All
were purchased from Fisher Scientific. pH was adjusted using 1M HCl or NaOH. Kaolinite clay was added to yield turbidity in the range of 10 to 15 NTU.
Overview of Experiment
Each experiment consisted of three filters and one dose of chitosan. The doses chose are: 5 mg/L, 10 mg/L, 20 mg/L and 30 mg/L and the total volume of test water is 3L per filter.
Non-pathogenic surrogates for bacteria and virus removal evaluation were selected based on the WHO household water treatment evaluation list of recommended pathogens and
surrogates. Test microbes used were the following: Escherichia coli strain K011 (ATCC# 55124) as the model bacterium and male-specific (F+) coliphage MS2 (ATCC# 15597B1) as the model enteric virus. Stocks of microbes were diluted and then dosed into test water at initial
concentration of about 1 x 10⁶ to determine at least 6 log10 reductions (99.9999%) by water
treatment.
Challenge waters were spiked with kaolinite turbidity and test microorganisms at specified target levels. A total of 9 liters of challenge waters were separately prepared in 3 containers (3L per container) matching 3 filters and samples of the untreated water were taken from the 3 containers respectively (influent water) for microbial analysis. Chitosan powder at specified target concentration was dissolved into the spiked challenge water in each container by agitating the water vigorously for 30 seconds and allowed 30 minutes for coagulation,
precipitated water was passed through filters by gravity flow and filtrate samples of each filter were collected after 4h filtration (effluent water). Microbes were analyzed in the untreated influent water and the matched filtrate of each filter to determine concentrations and log10
microbe reduction values, which were calculated based on the difference between the log10
influent concentration and effluent concentrations. After finishing every experiment, filters were sterilized by autoclaving on a wet cycle at 121°C for ten minutes. The lower filtrate collection reservoir was sterilized using 70% ethanol and rinsed using deionized water to remove residual ethanol.
Microbiologic Methods
16
Virus propagation and enumeration. MS2 was propagated in log-phase host E.coli Famp
(ATCC # 700609) in TSB broth containing 15 µG/mL each of streptomycin and ampicillin by incubating at 37°C on a shaker set to 100 to 150 rpm overnight (18 to 20 hours). MS2 was harvested from infected overnight broth cultures by chloroform extraction with 5% chloroform by volume and centrifuging at 3000 RPM for 30min at 4°C. The recovered supernatant as virus stock was dispensed in 200-300 µL amounts and stored at -80°C. The Single Agar Layer (SAL) assay was used for detection and enumeration of MS2 in water samples according to EPA Method 1602 (APHA, 2001). Another batch of E.coli Famp was grown overnight for the purpose
of log-phase host preparation which was conducted on experiment days. On the day of water sample assay, autoclaved, molten 0.5X TSA was tempered to 55-65°C. Water sample volumes of 100µL were pipetted into 100 mm x 15 mm petri dishes. Log-phase host was prepared and optical density was measured to verify adequate growth. Molten agar medium was transferred to a to 45°C water bath. When the agar reached temperature, MgCl2, streptomycin and ampicillin
were added to achieve concentrations of 0.05M, 15 µG/mL and 15 µG/mL, respectively, and a 4% volume of log phase E. coli was added to the molten agar medium. This mixture was distributed in 12-15 mL volumes into petri dishes containing water samples, swirled to evenly mix, and the agar was allowed to solidify. Petri dishes were covered, inverted and incubated at 37°C for 18 to 24 hours, after which MS2 plaques were counted and recorded.
Physical-Chemical Parameters
Turbidity of pre-filtered and post-filtered water was measured using a Hach 2100N Turbidimeter. According to WHO guidelines, turbidity in treated water should not exceed 1 NTU (WHO, 2011a). pH was analyzed by a Denver Instrument Model 215 meter.
E. coli K011 and MS2 log10 concentrations were calculated on the basis of counts from
three replicates per dilution in both influent and effluent. Log10 reductions of E.coli K011 and
MS2 were calculated by subtracting effluent log10 concentrations from influent log10
concentrations, respectively. Parametric and nonparametric statistical tests were used to evaluate the difference between microbial reductions when data were normally and non-normally
distributed, respectively, as determined by a Shapiro-Wilk normality test (Shapiro & Wilk, 1965). All statistics were interpreted using an a priori significance of α=0.05. All statistical testing was performed in R. One-way ANOVA and Friedman test were used for parametric and nonparametric test, respectively, to evaluate the difference between filtration with no
18
CHAPTER 5: RESULTS & DISCUSSION Results
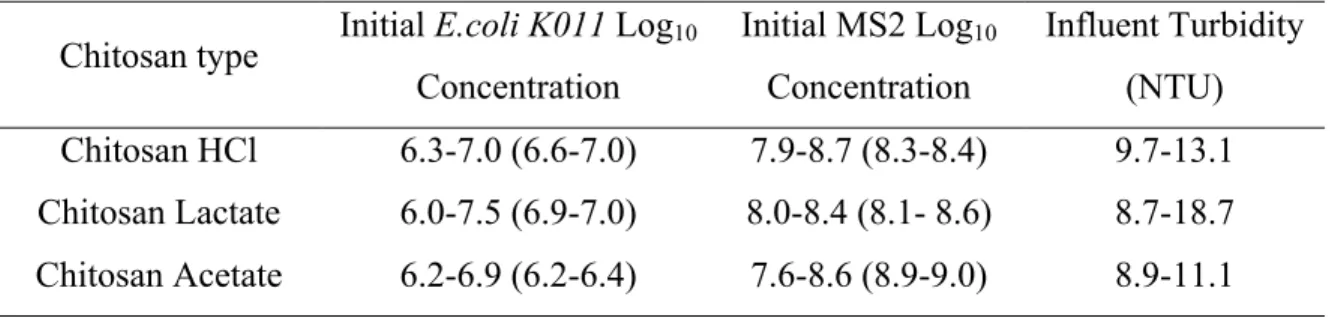
Table 4 demonstrates the ranges of influent turbidity and initial log10 concentrations of
both E.coli K011and MS2 in all the experiments. The influent turbidity ranges from 8.7 to 18.7 and the initial log10 concentration of E. coli K011 and MS2 ranges from 6.0 to 7.5 and 7.6 to 9.0,
respectively, in all experiments.
Table 4 Ranges of Influent Turbidity and Initial Log10 Concentrations of E.coli and MS2 in
Three Chitosan Salts Experiments (Filtration Without Chitosan)
Chitosan type Initial E.coli K011 Log10 Concentration
Initial MS2 Log10
Concentration
Influent Turbidity (NTU) Chitosan HCl 6.3-7.0 (6.6-7.0) 7.9-8.7 (8.3-8.4) 9.7-13.1 Chitosan Lactate 6.0-7.5 (6.9-7.0) 8.0-8.4 (8.1- 8.6) 8.7-18.7 Chitosan Acetate 6.2-6.9 (6.2-6.4) 7.6-8.6 (8.9-9.0) 8.9-11.1
Tables 5 -7 summarize microbial reductions and residual turbidity, including the results of statistical analysis of log10 reductions for each concentration of chitosan pretreatment plus
filtration compared to log10 reductions for filtration with no pretreatment.
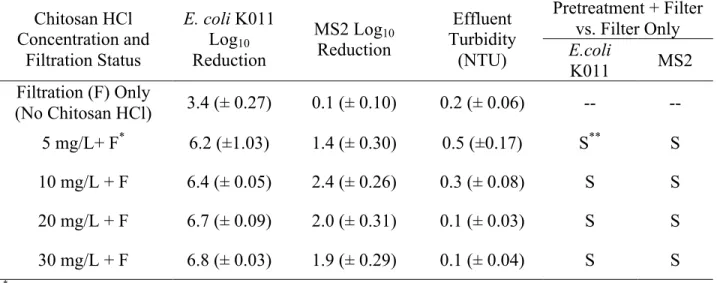
As demonstrated in Table 5 and Figure 3, filtration with no pretreatment resulted in a Log10 3.4 (± 0.27) reduction of E. coli, whereas the use of chitosan HCl pretreatment doses
ranging from 5 mg/L to 30 mg/L resulted in average log10 reductions ranging from 6.2 to 6.8.
Figure 3: Effect of Chitosan HCl on E.coli removal Figure 4: Effect of Chitosan HCl on MS2 removal
0.10 (± 0.10), while with chitosan HCl pretreatment at doses of 5 to 30 mg/L MS2 removal was much greater, ranging from 1.9 to 2.4 log10 (Table 5 and Figure 4). Also, pretreatment with
chitosan HCl resulted significant (P<0.05) reductions of MS2 when compared to filtration only.
9
The mean (±SD) is reported in all the results as it’s inappropriate to apply 95% CI since some of the data fails to meet normal distribution.
Table 5: Log10 Microbial Reductions and Final Effluent Turbidity of Test Water by
Chitosan HCl. Mean (±SD)9 for 3 Replicate Experiments per Condition Chitosan HCl
Concentration and Filtration Status
E. coli K011 Log10
Reduction
MS2 Log10
Reduction
Effluent Turbidity
(NTU)
Pretreatment + Filter vs. Filter Only E.coli
K011 MS2
Filtration (F) Only
(No Chitosan HCl) 3.4 (± 0.27) 0.1 (± 0.10) 0.2 (± 0.06) -- -- 5 mg/L+ F* 6.2 (±1.03) 1.4 (± 0.30) 0.5 (±0.17) S** S 10 mg/L + F 6.4 (± 0.05) 2.4 (± 0.26) 0.3 (± 0.08) S S 20 mg/L + F 6.7 (± 0.09) 2.0 (± 0.31) 0.1 (± 0.03) S S 30 mg/L + F 6.8 (± 0.03) 1.9 (± 0.29) 0.1 (± 0.04) S S
* Different baseline
** S = Statistically significant difference
No c
hitos
an
5 mg/L 10 mg/L 20 mg/L 30 mg/L
0 1 2 3
Chitosan HCl Dose Error Bars = SD
Log 10 Reduction No c hitos an
5 mg/L 10 mg/L 20 mg/L 30 mg/L
0 2 4 6 8
Chitosan HCl Dose Error Bars = SD
Log
10
20
However, there was no statistically significant difference in MS2 reductions between different pairs of chitosan doses. From an initial turbidity of 9.7 to 13.1 NTU in the untreated test water, final turbidity levels in all filtrate waters ranged from 0.09 to 0.7 and were below the
recommended 1 NTU level of WHO.
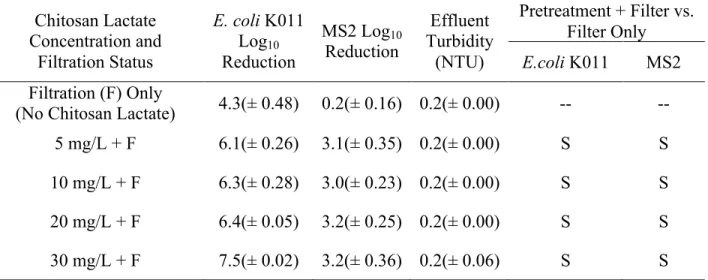
Table 6: Log10 Microbial Reductions and Final Effluent Turbidity of Test Water by
Chitosan Lactate. Mean (±SD) for 3 Replicate Experiments per Condition Chitosan Lactate
Concentration and Filtration Status
E. coli K011 Log10
Reduction
MS2 Log10
Reduction
Effluent Turbidity
(NTU)
Pretreatment + Filter vs. Filter Only E.coli K011 MS2 Filtration (F) Only
(No Chitosan Lactate) 4.3(± 0.48) 0.2(± 0.16) 0.2(± 0.00) -- -- 5 mg/L + F 6.1(± 0.26) 3.1(± 0.35) 0.2(± 0.00) S S 10 mg/L + F 6.3(± 0.28) 3.0(± 0.23) 0.2(± 0.00) S S 20 mg/L + F 6.4(± 0.05) 3.2(± 0.25) 0.2(± 0.00) S S 30 mg/L + F 7.5(± 0.02) 3.2(± 0.36) 0.2(± 0.06) S S
Figure 5: Effect of Chitosan Lactate on E.coli removal Figure 6: Effect of Chitosan Lactate on MS2 removal No c
hitos an
5 mg/L 10 mg/L 20 mg/L 30 mg/L
0 2 4 6 8
Chitosan Lactate Dose Error Bars = SD
Log 10 Reduction No c hitos an
5 mg/L 10 mg/L 20 mg/L 30 mg/L
0 1 2 3 4
Chitosan Lactate Dose Error Bars = SD
Log
10
As demonstrated in Table 6 and Figure 5, filtration with no chitosan pretreatment resulted in a log10 4.3 (± 0.48) reduction of E. coli. The use of chitosan acetate pretreatment doses ranging
from 5 mg/L to 30 mg/L resulted in average log10 E. coli reductions ranging from log10 6.1 to 7.5,
is more than 2 log10 greater than filtration alone. Additionally, all doses of chitosan lactate
resulted significant (P<0.05) reductions of E. coli when compared to no chitosan pretreatment. However, there were no statistically significance differences in reductions between different chitosan doses. MS2 log10 reduction with no pretreatment was 0.2 (± 0.16) (Table 6 and Figure
6). The log10 reductions of MS2 with chitosan lactate pretreatment at doses of 5 to 30 mg/L
followed by ceramic filtration ranged from 3.0 to 3.3 log10, which is about a 3 log10 increase in
MS2 reduction than by filtration alone. Also, all doses of chitosan lactate resulted a significant (P<0.05) reduction of MS2 when compared to filtration only, but no statistical significance between different doses. From an initial turbidity of 8.7 to 18.7 NTU in untreated test water, the average final turbidity levels were reduced to 0.2 NTU, well below the WHO recommended 1 NTU.
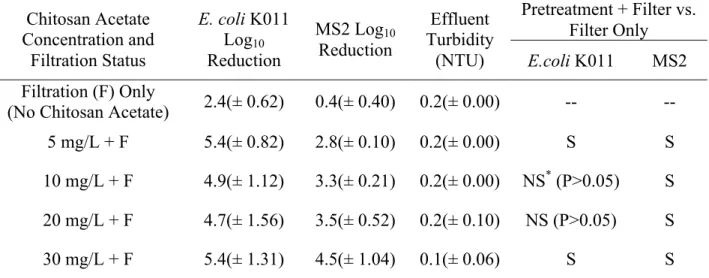
* NS = No statistically significant difference
Table 7: Log10 Microbial Reductions and Final Effluent Turbidity of Test Water by
Chitosan Acetate. Mean (±SD) for 3 Replicate Experiments per Condition Chitosan Acetate
Concentration and Filtration Status
E. coli K011 Log10
Reduction
MS2 Log10
Reduction
Effluent Turbidity
(NTU)
Pretreatment + Filter vs. Filter Only E.coli K011 MS2 Filtration (F) Only
(No Chitosan Acetate) 2.4(± 0.62) 0.4(± 0.40) 0.2(± 0.00) -- --
5 mg/L + F 5.4(± 0.82) 2.8(± 0.10) 0.2(± 0.00) S S
10 mg/L + F 4.9(± 1.12) 3.3(± 0.21) 0.2(± 0.00) NS* (P>0.05) S 20 mg/L + F 4.7(± 1.56) 3.5(± 0.52) 0.2(± 0.10) NS (P>0.05) S
22
As demonstrated in Table 7 and Figure 7, filtration with no chitosan acetate pretreatment resulted in a mean log10 2.4 (± 0.62) E. coli reduction. The use of chitosan acetate pretreatment at
doses ranging from 5 to 30 mg/L resulted in average log10 E. coli reductions ranging from 4.7 to
5.4, which are more than 2 log10 greater than filtration alone. Only two doses of chitosan acetate
(5 and 30 mg/L) resulted significant (P<0.05) reductions of E. coli when compared to no use of coagulant. However, there were no statistically significant differences in E coli reductions between different chitosan doses. MS2 log10 reduction by filtration with no pretreatment was 0.4
(± 0.40) (Table 7 and Figure 8), which is somewhat higher than the log10 reductions reported for
experiments with chitosan HCl (0.1 log10) and chitosan acetate (0.2 log10). However, with
chitosan acetate pretreatment at doses from 5 to 30 mg/L followed by filtration, MS2 reduction increased greatly to between 2.8 to 4.5 log10.All doses of chitosan acetate resulted in significant
reductions of MS2 and there was a statistically significant difference in MS2 reduction between the dose of 5 mg/L and 30 mg/L. From an initial turbidity of 8.9 to 11.1 NTU in test water, final turbidity levels in filtered effluent waters were 0.13 to 0.2 NTU, well below the recommended 1 NTU levels of WHO.
Figure 7: Effect of Chitosan Acetate on E.coli removal Figure 8: Effect of Chitosan Acetate on MS2 removal No c
hitos
an
5 mg/L 10 mg/L 20 mg/L 30 mg/L
0 2 4 6 8
Chitosan Acetate Dose Error Bars = SD
Log 10 Reduction No c hitos an
5 mg/L 10 mg/L 20 mg/L 30 mg/L
0 2 4 6
Chitosan Acetate Dose Error Bars = SD
Log
10
Discussion
In 2011, WHO developed performance targets for the evaluation of household water treatment devices based on health risk targets that are linked to log10 microbial reductions from
water. The recommended performance levels consist of a 3-tiered approach for the reduction of bacteria, viruses, and protozoa (WHO, 2011b). The top tier is designated highly protective with bacteria, virus and protozoan parasite log10 reductions of ≥ 4, ≥ 5, and ≥ 4, respectively. Second
tier is designated protective and specifies log10 bacteria, virus and protozoan parasite reductions
of ≥ 2, ≥ 3, and ≥ 2, respectively. The lowest tier, designated minimally protective, specifies achieving the “protective” log10 reduction levels for two of the three classes of microorganisms
as well as providing evidence of health protection, typically from diarrheal disease, by scientifically credible field epidemiological studies.
All three modified chitosans evaluated, chitosan HCl, chitosan lactate and chitosan acetate, achieved extensive reductions of bacteria and viruses. Filtration with chitosan pretreatment consistently produced filtrate water with <0.7 NTU turbidity, below the 1 NTU maximum turbidity limit recommended by the WHO GDWQ. However, filtration alone produced low filtrate water turbidity levels of about 0.2 NTU and therefore, pretreatment with any of the chitosan salts did not further improve turbidity reductions of the filtered water. Pretreatment with any chitosan type plus ceramic filtration achieved the over 4 log10 “highly”
protective level of reduction for bacteria set in the WHO HWT performance scheme. Both chitosan acetate and chitosan lactate achieved the 3 log10 reduction “protective” level of
performance for viruses of the WHO HWT scheme.
24
Table 8: Summary of Microbial Reduction by Contribution of Chitosan Salts Only.
improvement of E. coli of 3.4 (±0.27) was achieved with a dose of 30 mg/L of chitosan HCl and the greatest log10 reduction improvement of MS2 coliphage of 4.1(±1.38) was achieved with a
dose of 30 mg/L of chitosan acetate. However, there were no significant differences between different doses of any chitosan salt with regard to both E.coli and MS2 microbial reduction improvements. Hence, a further paired t-test was performed to compare any two chitosan types regardless of the dose. Results showed that there was no significant difference between any two chitosan types on E.coli removal, whereas with MS2 removal, both chitosan lactate and chitosan acetate had significant differences from chitosan HCl but no significant difference between each other. Our results demonstrate that, at varying doses of the three modified chitosans evaluated in this analysis, two types of modified chitosans, the acetate and lactate salts, provide the greatest capacity for significant microbial reductions from water by coagulation and flocculation prior to ceramic filtration, especially of viruses, and are worthy of further exploration.
Dose
E.coli K011 Log10 Reduction MS2 Log10 Reduction
Chitosan HCl
Chitosan Lactate
Chitosan Acetate
Chitosan HCl
Chitosan Lactate
CHAPTER 6: FUTURE WORK Introduction
In chapter 5, coagulation and flocculation with chitosan salts gave improved results for E.coli and MS2 removal by ceramic filtration. However, further research is required before chitosan salts become ready for use at the household level. This chapter proposes next steps for laboratory experiments and field study. In addition, a brief marketing plan was developed to describe how chitosan salts can reach the end-users for “real world” application, which includes the blueprints of production, distribution, education, sales etc.
Next Steps
Currently, this research investigated the effect of chitosan salts on E.coli and MS2, which are recommended bacterial and viral indicators, respectively, that are commonly used for household water treatment performance evaluation. However, these indicators only address two classes of microorganisms thereby neglecting protozoa surrogates. In addition, the test water used here was buffered water with clay to model turbidity and was created using a specific clay, kaolinite. While these previous tests allowed for screening chitosans to evaluate their
performance, it is necessary to evaluate chitosan salts in natural water and with a range of water quality characteristics by varying total organic carbon (TOC), turbidity, total dissolved solids (TDS), and pH.
26
experiments under natural water conditions and with a range of test water quality conditions. Future experiments may involve lake water in combination with 1% municipal sewage, which provides organic matters and turbidity and simulates highly contaminated natural water. Upon completion of dose optimization studies, field studies will follow and be performed in
households where ceramic filters are commonly used. A selection of pilot sites is required to assess success of integrating chitosan salts into household water treatment.
Furthermore, further physical-chemical characterization of the properties and performance of the three chitosan salts is required to better understand the mechanisms of microbial reduction. Therefore, floc size, density and electro-potential characteristics require further analysis to be performed and interpreted to characterize these floc properties of the three chitosan salts, which will inform the relationship between type of chitosan and performance outcomes.
Marketing Plan
Target Market and Customers
Because chitosan is proposed to be used in combination of ceramic water filters, the potential markets are all the regions where ceramic filters are widely used. Although not the focus of this assessment, more investigations are required to identify the target opportunities for augmenting the performance of household level filtration technologies other than ceramic filters, such as granular medium filters. Once the target markets are determined, then the next step is to identify the target customers. Assuming a new company is established to sell chitosan products, then there can be two possible business models:
Business to Customer (B2C) --- Filter end-users as target customers
For the scenario where the filter manufacturers are the target customers, Potters for Peace (PfP), the leading non-profit organization that has established ceramic water filter factories worldwide, would be one of the largest customers. Figure 9 demonstrates the locations of ceramic water filters factories of PfP across the world. The factory locations are in Latin America, Africa and Southeast Asia.
Figure 9: Locations of Ceramic Filters Factories across the World Production & Distribution
Currently, most suppliers of chitosan are in China’s coastal areas and in various parts of the United States. A market search should be conducted to contact and identify manufacturers who are interested in this new application. However, from the standpoint of reducing cost, Latin America and Africa may need local suppliers of chitosan, considering the relatively high
transport cost for importing chitosan. Because documentation of chitosan manufacturing
28
• Availability of raw material: the region should have a large consumption of crustacean
products so it is cost-effective and easy to get the exoskeleton as waste.
• Market size: the potential demand of chitosan product should be large enough to support
the operation of a local factory.
• Other aspects: the environmental burden of producing chitosan products, the
transportation convenience to dispatch products, the land use permission and power supply for a factory are all factors of concern.
Regardless of where to localize production and take PfP as our target customer for a B2B example, our company needs to consider bridging the chitosan factories and the filter factories of PfP. PfP would take charge of the sales to the end-users through their distribution chains and our company would provide technical support on education and promotion on product use.
For end-users of ceramic filters as the target customer, our company would be directly responsible for selling products to these customers. For a newly established company, it is likely to be preferable to join an existing filter manufacturer/supplier like PfP and use its network for distribution. Otherwise, a new chitosan company may consider approaching other distribution channels such as hardware stores, grocery stores, and pharmacies. Furthermore, for markets without existing retail channels, wholesalers and retailers may be developed and also serve as marketers, educators, and distributors.
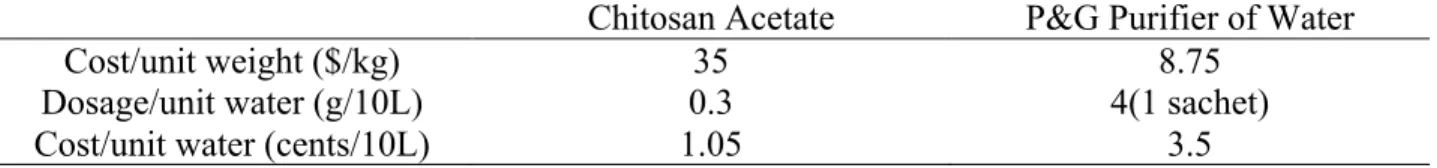
Cost Analysis
demonstrates a comparison between the raw material cost of chitosan acetate (30 mg/L is chosen as dosage for highest average virus removal) and P&G Purifier of Water.
Table 9: Raw Material Cost of Chitosan Acetate and P&G Purifier of Water
Chitosan Acetate P&G Purifier of Water
Cost/unit weight ($/kg) 35 8.75
Dosage/unit water (g/10L) 0.3 4(1 sachet)
Cost/unit water (cents/10L) 1.05 3.5
Typically, a four-gram packet of P&G Purifier of Water costs 3.5 cents to make, 4 cents to distribute, and sells for an average of 10 cents at retail. It is notable that the distribution cost
accounts for 40% of the sales price of P&G Purifier of Water. For a newly started business, the distribution cost will be much higher to establish a new sales channel. It may be difficult to compete with the established P&G network and achieve a lower distribution cost even through collaborating with PfP and their international distribution network. An important point is that the dosage per unit water of chitosan is much lower than that of P&G Purifier of Water, which may well reduce the transport cost but cannot assure a lower distribution cost.
Marketing Strategies
As a new application, education to encourage behavior change and product use is
necessary. To address product use, properly designed instructions are required, which include but
not be limited to pictographic material for filter manufacturers and end users in multiple languages based on each target market. Websites will be created with demonstration videos as well as other necessary information. To encourage behavior change, one feasible way is to give out free samples to the first-time users and convert them into regular customers. Other marketing
campaigns can be launched based on different markets. Obviously, any kind of promotion
30
CHAPTER 7: CONCLUSION
32
REFERENCES
Amirtharajah, A., & Mills, K. M. (1982). Rapid-mix design for mechanisms of alum
coagulation. Journal (American Water Works Association), 74(4), 210-216.
APHA (American Public Health Association). (2001). Method 1602: Male-specific (F+) and
somatic coliphage in water by single agar layer (SAL) procedure. Washington, DC:
United States Environmental Protection Agency, 20460.
Austin, G. T. (1984). Shreve's chemical process industries (5th edition). McGraw-Hill: New
York, 136-138.
John, B. (2006). Coagulation and flocculation in water and wastewater treatment. IWA.
Publishing London. Seattle, 1-401.
Brown, J.M. (2007). Effectiveness of Ceramic Filtration for Drinking Water Treatment in Cambodia. Ph.D. Dissertation. University of North Carolina at Chapel Hill. Chen, X. (2014). “Brief 1: Problem Identification Brief.” University of North Carolina at
Chapel Hill.
Chen, X. (2015a). “Brief 2: Solution Identification Brief.” University of North Carolina at Chapel Hill.
Chen, X. (2015b). “Brief 3: Implementation Brief.” University of North Carolina at Chapel Hill.
Crittenden, J. C., Trussell, R. R., Hand, D. W., Howe, K. J., & Tchobanoglous, G.
(2012). MWH's Water Treatment: Principles and Design (3rd edition). John Wiley &
Sons.
CMWG (Ceramics Manufacturing Working Group). (2011). Best practice recommendations for
USA: CDC.
EPA (Environmental Protection Agency), (1998). Small System Compliance Technology List for the Surface Water Treatment Rule and Total Coliform Rule. [Online article]. Retrieved on December, 2014, from http://www.epa.gov/ogwdw/standard/tlisttcr.pdf
Fabris, R., Chow, C. W. K., & Drikas, M. (2010). Evaluation of chitosan as a natural coagulant
for drinking water treatment. Water Science & Technology, 61(8),2119-2128.
Hunter, P. R. (2009). Household water treatment in developing countries: comparing different
intervention types using meta-regression. Environmental science & technology, 43(23),
8991-8997.
Lantagne, D. S., & Environmental, A. (2001). Investigation of the Potters for Peace Colloidal
Silver Impregnated Ceramic Filter Report 1: Intrinsic Effectiveness. Population
(millions), 4(5.1), 4-5.
Lantagne, D. S., Quick, R., & Mintz, E. D. (2006). Household water treatment and safe storage
options in developing countries: a review of current implementation practices. Wilson
Quarterly, Woodrow Wilson International Center for Scholars Environmental Change
and Security Program, 99(11), 17-38.
Lenore, S. C., Arnold, E. G., & Andrew, D. E. (1998). Standard methods for the examination of
water and wastewater. American Public Health Association. American Water Works
Association and World Environment Federation. 20th Edition, Washington DC.
Muzzarelli, R. A., Boudrant, J., Meyer, D., Manno, N., DeMarchis, M., & Paoletti, M. G. (2012).
Current views on fungal chitin/chitosan, human chitinases, food preservation, glucans,
pectins and inulin: A tribute to Henri Braconnot, precursor of the carbohydrate polymers
34
Muzzarelli, R. A., Ilari, P., Tarsi, R., Dubini, B., & Xia, W. (1994). Chitosan from Absidia
coerulea. Carbohydrate Polymers, 25(1), 45-50.
Oyanedel-Craver, V. A., & Smith, J. A. (2007). Sustainable colloidal-silver-impregnated ceramic
filter for point-of-use water treatment. Environmental science & technology, 42(3), 927-
933.
Rinaudo, M. (2006). Chitin and chitosan: properties and applications. Progress in polymer
science, 31(7), 603-632.
Riva, R., Ragelle, H., des Rieux, A., Duhem, N., Jérôme, C., & Préat, V. (2011). Chitosan and
chitosan derivatives in drug delivery and tissue engineering. Adv Polym Sci, 244, 19-44
Shapiro, S. S., & Wilk, M. B. (1965). An analysis of variance test for normality (complete
samples). Biometrika, 52 (3-4), 591-611.
Soros, A. (2014). Research Proposal: Chitosan Coagulation for Household Water Treatment in Developing Countries. University of North Carolina-Chapel Hill.
Sobsey, M. D. (2002). Managing water in the home: accelerated health gains from improved
water supply. Geneva: World Health Organization.
Sobsey, M. D., Stauber, C. E., Casanova, L. M., Brown, J. M., & Elliott, M. A. (2008). Point of
use household drinking water filtration: a practical, effective solution for providing
sustained access to safe drinking water in the developing world. Environmental science &
technology, 42(12), 4261-4267.
Vakili, M., Rafatullah, M., Salamatinia, B., Abdullah, A. Z., Ibrahim, M. H., Tan, K. B., ... &
Amouzgar, P. (2014). Application of chitosan and its derivatives as adsorbents for dye
removal from water and wastewater: A review. Carbohydrate polymers, 113, 115-130.
treatment in developing countries (Doctoral dissertation, UNESCO-IHE Institute for
Water Education).
WHO (World Health Organization) and UNICEFF (United Nations International Children’s Emergency Fund), 2014. Progress on Sanitation and Drinking water 2014 Update. WHO Press, Geneva, Switzerland.
WHO (World Health Organization). (2011a). Guidelines for drinking-water quality (4th edition),
564 pages. ISBN: 978 92 4 154815 1
WHO (World Health Organization). (2011b). Evaluating household water treatment options:
Health-based targets and microbiological performance specification, 68 pages. ISBN: 978