GSSC: Graph Summarization based on both
Structure and Concepts
Nosratali Ashrafi Payaman Computer Engineering
Iran University of Technology and Science Tehran, Iran
Mohammadreza Kangavari Computer Engineering
Iran University of Technology and Science Tehran, Iran
[email protected] Received: January 10, 2017- Accepted: March 26, 2017
Abstract— In this paper, we propose a new method for graph summarization named GSSC, Graph Summarization based on both Structure and Concepts. In this method, an attributed graph is summarized by considering both of its topology and related concepts. In this method, for a given attributed graph a new graph is constructed that an edge in this new graph represents structural and conceptual similarity of its two end points. Structural and conceptual similarity of two nodes not necessarily has the equal amount of importance in the weight of the resulting edge. For example, for a special case such as query answering, structure can be more important and vice versa. Similarity of two nodes is computed based on Jaccard similarity. This method has some advantages such as flexibility, simplicity, learning capability, user-orientation that makes it a better method for graph summarization. We implemented our method and the method proposed by Bei and evaluated these two methods on real-life dataset HEP_TH. Our experimental results showed effectiveness and efficiency of our proposed method.
Keywords-Graph summarization; super-node; similarity; conceptual summarization; summary.
I. INTRODUCTION
Graphs are used in a variety of applications for modelling data and their relationships. Examples of data modelled by graphs include social networks, communication networks, web graphs, biological networks, chemical compounds, etc. Graph theory and its applications has attracted the attention of the scientists [1] and specially there is a survey of existing work on graph matching, describing variations among problems, general and specific solution approaches, evaluation techniques, and directions for further research [2]. In that survey an emphasis is given to techniques that apply to general graphs with semantic characteristics.
These days many applications generate large scale and massive graphs with billions of nodes and edges and a lot of research has been done on theory and engineering of Tera-scale graphs [3]. In fact, we are
faced with graphs which are very massive and their growth rate is also increasing rapidly. For example Facebook has had 1.11 billion members on March 2013 while at the end of 2004 had only about 1 million members (http://news.yahoo.com/number-active-users-facebook-over-230449748.html).
Query answering on these massive graphs is very time-consuming. Graph summarization has proposed as a solution for this problem. Recently several graph summarization algorithms [4], [5], [6], [7] have been proposed that reduce a massive graph to a smaller one by removing its details but preserving its overall properties. This smaller graph can then be used for query answering. Of-course these answers are not exact and have a little error. This error is acceptable because of lower response time which is a necessity in a lot of applications.
The formal definition of a summary graph according to [7] is as follows:
Definition 1. (Summary Graph) Let 𝐺 = (𝑉, 𝐸) and
Φ = {𝑉1, 𝑉2, 𝑉3, … , 𝑉𝑘} is a partition of 𝐺 such that
⋃𝑘𝑖=1𝑉𝑖= 𝑉 and ∀𝑖 ≠ 𝑗: 𝑉𝑖∩ 𝑉𝑗= ∅. The summary of
𝐺 based on Φ is 𝑆 = (𝑉𝑠, 𝐸𝑠) where 𝑉𝑠= Φ and 𝐸𝑠=
{(𝑉𝑖, 𝑉𝑗)|∃𝑢 ∈ 𝑉𝑖⋀ 𝑣 ∈ 𝑉𝑗⋀(𝑢, 𝑣) ∈ 𝐸}.
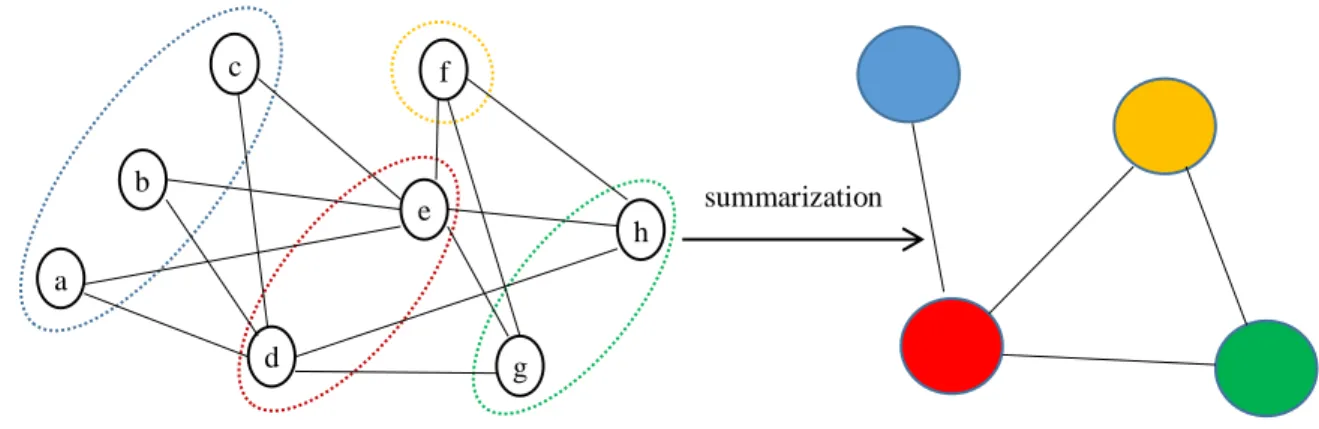
Fig 1 shows an undirected graph with 8 nodes and 13 edges and one of its summaries. In fact, a graph is partitioned into some parts each containing some nodes of the original graph. Each part is called a super-node. For example, as is shown in the Fig 1.a, the vertices a, b and c in the original graph are grouped together and make a super-node (blue one) in the summary graph (Fig 1.b). The edges between 2 super-nodes are also grouped together and shown by an edge in the summarized graph called a super-edge. For example six edges (a,d), (a,e), (b,d), (b,e), (c,d) and (c,e) are packed and shown by a super-edge between two blue and red super-nodes in the summary.
The summary graph has four super-nodes according to four dashed ovals in the original graphs as shown in Fig 1.b. To illustrate more, the super-nodes have the same color as their corresponding groups in the original graph.
A super-edge in the summarized graph shows that an edge must exist in the original graph between a node of the first super-node and another node from the second super-node. For example the super-edge between the red and blue super-nodes shows at least one of the edges (a,d), (a,e), (b,d), (b,e), (c,d) and (c,e) must exist in the original graph. The super-edge between the red and yellow super-nodes indicates that one of the edges (d,f) and (e,f) must exist in the original graph. Here the edge (e,f) exists in the original graph.
The formal definition of a good summary according to [7] is as follows:
Definition 2. (Good Summary) Let set of nodes in super-node 𝑉𝑖 participate in the relationship (𝑉𝑖, 𝑉𝑗) is
as 𝑃𝑖,𝑗 = {𝑢|𝑢 ∈ 𝑉𝑖∧ ∃𝑣 ∈ 𝑉𝑗 𝑠𝑢𝑐ℎ 𝑡ℎ𝑎𝑡 (𝑢, 𝑣) ∈ 𝐸}.
The participation ratio of the relationship (𝑉𝑖, 𝑉𝑗) is
defined as 𝑟𝑖,𝑗= (|𝑃𝑖,𝑗| + |𝑃𝑗,𝑖|)/(|𝑉𝑖| + |𝑉𝑗|).
For a group relationship, if its participation ratio is greater than 50%, then we called it a strong group relationship; otherwise, we call it a weak group relationship. Note that in an ideal summary, the participation ratios are either 100% or 0%. The participation ratios of a good summary are near to either 100% or 0%.
In fact a good summary of a big graph is the one that can be stored in the memory and the more important it should generate answers to the queries the same as answers generated from the original graph. This is the main challenge of the graph summarization.
The majority of summarization algorithms generate structural summaries while most real world graphs are attributed graphs in which every node or edge has a lot of attributes. In this kind of graphs, node attributes are important and must be considered in summarization.
Usually users are interested in summarization based on concepts (attributes). For a given attributed graph, a lot of summaries can be produced according to selected attributes.
The formal definition of an attributed graph is as follows:
Definition 3. (Attributed Graph) An attributed graph is defined as 4-tuple 𝐺 = (𝑉, 𝐸, Σ, 𝐹) where
V = {𝑣1, 𝑣2, … , 𝑣𝑛} is a set of n nodes,
𝐸 = {(𝑣𝑖, 𝑣𝑗)|1 ≤ 𝑖, 𝑗 ≤ 𝑛 𝑎𝑛𝑑 𝑖 ≠ 𝑗} is a set of m
edges, Σ = {𝑎1, 𝑎2, … , 𝑎𝐿} is a set of L attributes.
Attributes of a node 𝑣𝑖∈ 𝑉 is denoted as
[𝑎1(𝑣𝑖), 𝑎2(𝑣𝑖), … , 𝑎𝐿(𝑣𝑖)] where 𝑎𝑗(𝑣𝑖) is an
observation value of 𝑣𝑖 on attribute 𝑎𝑗 . The set
F = {𝑓1, 𝑓2, … , 𝑓𝐿} denotes a set of L functions and each
𝑓𝑖: 𝑉 ↦ 𝑑𝑜𝑚(𝑎𝑖) assigns each node 𝑣𝑗 ∈ 𝑉 an
attribute value in the domain 𝑑𝑜𝑚(𝑎𝑖) of the attribute
𝑎𝑖 (1 ≤ 𝑖 ≤ 𝐿).
The formal definition of hybrid summarization (summarization based on both structure and attribute similarities) is as follows:
Definition 4. (Hybrid Summary) For a given graph
𝐺 = (𝑉, 𝐸) let:
1) Every node has attribute set
𝐴𝑣= {𝑎1, 𝑎2, … , 𝑎𝑡}.
2) Φ = {𝑉1, 𝑉2, … , 𝑉𝑘} is a partition on 𝑉.
3) User is interested in attributes
𝐴𝑢= {𝑎𝑖1, 𝑎𝑖2, … , 𝑎𝑖𝑗} where 𝐴𝑢⊆ 𝐴𝑣.
Then a hybrid summarization is 𝐺𝑆= (𝑉𝑠, 𝐸𝑠)
where:
1) 𝐺𝑆 is a structural summary as previous.
2) All vertices inside 𝑉𝑖 have the same value for
all attributes in 𝐴𝑢.
3) The density of edges inside each 𝑉𝑖 is more
than a given threshold.
4) The edge density of edges between super-nodes 𝑉𝑖 and 𝑉𝑗 is less than a given threshold.
For some applications, conceptual summarization is necessary for analysing massive graphs, but in general a summary resulted from both structure and concepts may be useful. We propose a method for this purpose. There is a method [8] for graph summarization based on both structure and concepts. This method unlike our method, at first summarizes a graph based on concepts or similarity of nodes and then tries to adjust the summary with the graph structure. In fact contribution of graph structure to summary is added after construction of conceptual summary. Zhou et al. [9] proposed an algorithm for graph clustering based on both structure and node similarity. In this method unlike our method similarity of two nodes is measured based on number of random walks between two nodes.
Henceforth our target is to have a method for graph summarization that generates structural or conceptual summaries or even a mixture of these two summaries
Fig 1: (a) The original graph (b) The summarized version of the original graph with the arbitrary degrees of contributions. Such a
method can be very useful in query answering based on learning degree of contributions of structure and attribute similarities in resulting summary. The more summary is realistic the more queries can be answered precisely. By learning the value of α (structure contribution in summary) based on trained dataset it can produce a realistic summary.
Motivating Applications: Graph summarization problem can be motivated by revealing biological modules [10], provenance systems [11] and many other applications. In the following, we further discuss these two applications.
Finding biologically meaningful modules in a network of proteins is important. In fact detection of protein complexes and prediction of biological processes can discover the global organization of the cell. Graph summarization can be used for this purpose. Provenance systems produce provenance graphs that can be used for tasks such as determining the inputs to a particular process for debugging entire workfellow executions. Visualization can be used to support such tasks. By summarization, it is possible to visualize such massive graphs.
The rest of the paper is organized as follows. Related works is reviewed in Section 2. In Section 3 the new proposed method for graph summarization is presented. Evaluation and Experimental results are given in Section 4. Section 5 is dedicated to discussion and finally we concluded this paper in Section 6.
II. RELATED WORKS
In the following, some of recently proposed summarization algorithms are described shortly to illustrate the scope of the problem.
Navlakha et al. [5] proposed a summarization algorithm in 2008 where graph compression is done by collapsing a set of similar nodes into super-nodes and defining a supper-edge between every pair of super-nodes. It tries to construct a compression graph with the minimum representation cost based on the MDL1 idea. For this purpose, they developed two iterative algorithms, GREEDY and RANDOMIZED. The
1 Minimum Description Length
GREEDY algorithm selects, in each stage, the best pair of nodes to merge based on the representation cost reduction. It is obvious that the running time of this algorithm is high. To reduce the running time, a RANDOM- IZED algorithm has been proposed by the authors (Navlakha et al.). Unlike the GREEDY, in this algorithm two merging nodes are selected randomly.
In 2008, Tian et al. [6] proposed a summarization method with two summarization operations called SNAP2 and k-SNAP for grouping nodes and constructing summary. This summarization algorithm has been proposed for attributed graphs. Tian et al. defined attribute compatible grouping and also relation compatible grouping. In addition, they improved the SNAP operation by proposing k-SNAP, where k is the right size of resulting summary and is given by the user. In 2009, Zhang et al. [7] have improved the k-SNAP operation in two ways. In fact, k-SNAP method has two shortcomings. First, users have to categorize the attribute values and second there is no criterion to measure the quality of the resulting summary. For these shortcomings, Zhang has proposed the CANAL algorithm to categorize attribute values automatically and a criterion to estimate the quality of the summary.
In 2008, Chen et al. [12] proposed the OLAP framework which provides OLAP like operations on graphs. The OLAP framework has been introduced to create cubes from graphs based on dimensions and measures. The natural property of OLAP framework is that constructs a summary based on the selected attributes and given input information.
Another summarization method has been proposed by Chen et al. [13] in 2009 for mining frequent patterns. This method works by producing randomized summary graphs. In fact, Chen et al. confirmed, in the case of massive graphs, that the traditional pattern mining algorithms are very time-consuming and inefficient because of random access time. Therefore, they proposed a summarization method that first constructs summaries and then mines them instead of mining original disk-resident graphs.
In [14] a method has been proposed for graph summarization that guarantees the quality of the summary. This method produces a summary that c
a b
d
f
e
g
h
summarization
minimizes the reconstruction error. The error is computed based on the difference between the adjacency matrices of the original and summary graphs. The authors have presented a connection between graph
summarization and geometric clustering. Based on this connection, they have developed a polynomial-time algorithm to compute the best possible summary with a given size.
Navlakha's algorithm which was described as the first algorithm in this section is a bottom-up algorithm. The top-down approach starts with a minimum number of super-nodes and then iteratively splits super-nodes to achieve a summary with a right number of super-nodes. In this approach, a criterion is necessary to divide a super-node. In [6] there is an algorithm (Algorithm 2) to summarize graph based on top-down approach.
These days the majority of real applied graphs are attributed graphs such as social networks and web graphs. Recently a lot of papers have been published on attributed graphs. For example we can list papers for matching patterns [15], matching graphs with fuzzy attributes [16] and predicting links and inferring attributes on a social attribute network [17].
Fig 2: A graph with 4 vertices
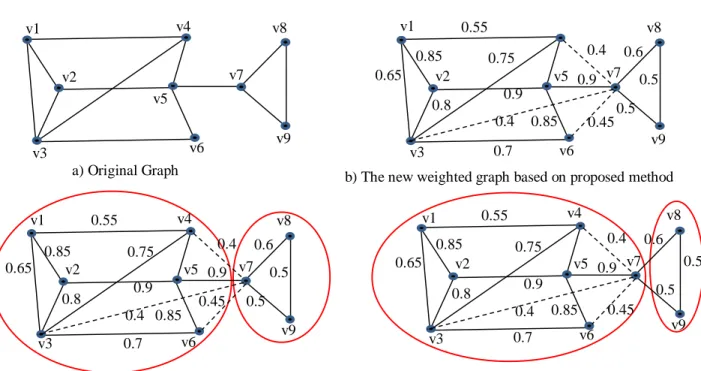
Fig 3: a) Student’s graph b) New graph constructed based on proposed method
Fig 4: Three different summaries of student’s graph v1
v2
v4 v3
0.6
v1 v2
v4 v3
0.45
0.4 0.75
0.5
0.85
0.46
v1 v2
v4 v3
0.6
0.53 0.5
0.3 3
0.8
a) The original graph b) α=0.5 β=0.5 c) α=1/3 β=2/3
v1 v2
v5 v4
v3
v1
v2
v5 v4
v3
1
1
1
1
a) Structural summary b) Conceptual summary
v1
v2
v5 v4
v3
1
1
1
c) Hybrid summary Language Student
Physics Student
Physics Student Physics Student
Physics Student
v1 v2
v5 v4
v3
Language Student
Physics Student
Physics Student Physics Student
Physics Student
v1 v2
v5 v4
v3 1
2 2
2 1
Fig5: An instance graph and its summaries Therefore at present, hybrid summarization is more
important than structural summarization. All above mentioned summarization methods are single-process solutions and as a result cannot scale to large graphs. In [18] three distributed graph summarization algorithms have been proposed.
Dynamic graphs and their interpretations are also important and in [19] these graphs have been studied, formulated and a new method is proposed for finding coherent and temporal patterns in these graphs.
Summarizing a graph based on both structure and attributes is important and a method [8] has been proposed for this purpose. The method summarizes a graph by introducing real and virtual links. In fact for a given graph, a new graph is constructed where the weight of an edge in this new graph is resulted from both real and virtual links.
III.
P
ROPOSEDS
UMMARIZATIONM
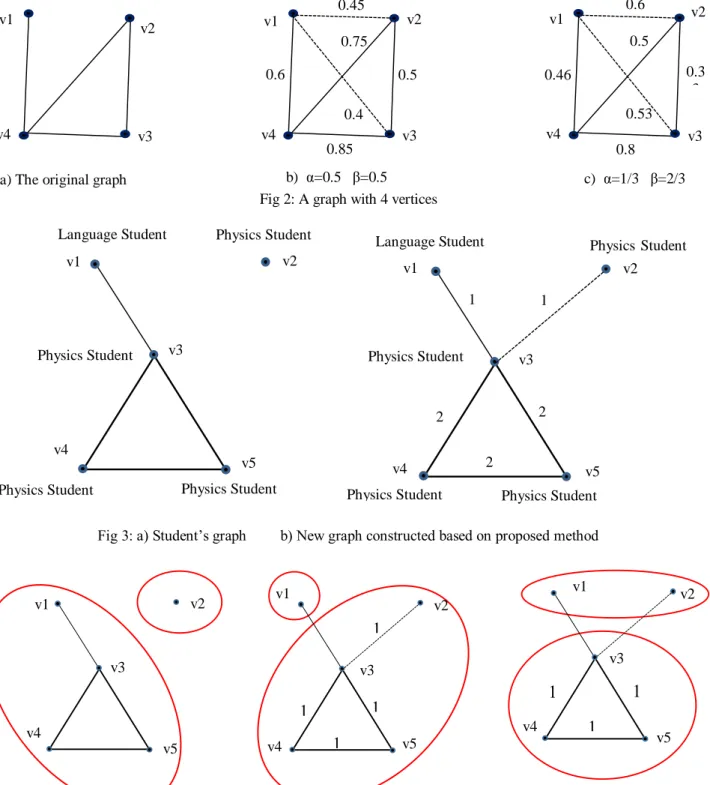
ETHOD The new proposed summarization method covers two above mentioned kinds of summarization, structural and attribute-based. In fact both structure and concepts (attributes) of the graph have contributions in making the resulting summary. For this reason, we consider two kinds of edges namely structural and conceptual edges. A structural edge is as previous and indicates that two vertices are connected, while a conceptual edge shows the similarity of two vertices based on their attribute values. In this new proposed method, for a given graph a new graph with the same vertices but with new edges is constructed. In the constructed graph, edges are weighted and some edges may be added because of attribute similarities of vertices. Weight of an edge is summation of structuraland conceptual weights, of course weighting factors may be different. For more demonstration, let consider an attributed graph in Fig 2.a with similarity of vertices as given in Table 1.
Table 1: Vertices similarity of graph in Fig 2.a
Source 1 1 1 2 2 3
Destination 2 3 4 3 4 4
Similarity 0.9 0.8 0.2 0.0 0.5 0.7 Based on the given graph, two new graphs constructed. In the first new constructed graph, structural and conceptual similarity has equal contributions in the weight of an edge (1
2 𝑎𝑛𝑑 1 2). In the
second constructed graph, the contribution of conceptual similarity is two times as structural similarity (2
3 𝑣𝑒𝑟𝑠𝑢𝑠 1 3).
For more illustration, let consider another example as shown in Fig 3.a. Graph in Fig 3.a is the original graph and its new constructed graph is shown in Fig 3.b. In the new graph, the edge (𝑣2, 𝑣3) has added because
of similarity of 𝑣2 and 𝑣3, similarity of these two nodes
based on their attributes. Both of them study physics. In this case, contributions of structural and conceptual weights have considered equal.
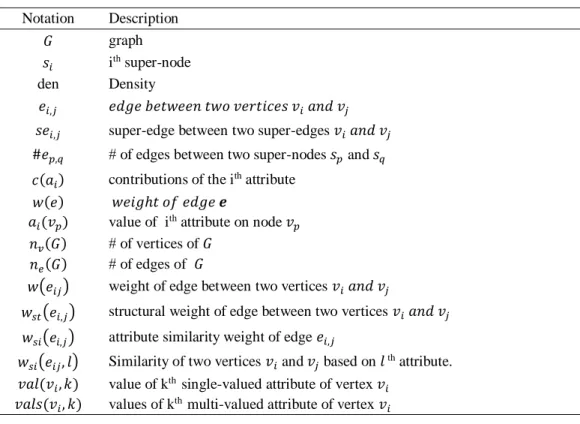
Structural and conceptual summaries with two super-nodes for student’s graph shown in Fig 4.a and 4.b respectively. Based on the new proposed method, student’s graph can be summarized as shown in Fig 4.c. v1 v2 v3 v4 v5 v6 v7 v8 v9 v1 v2 v3 v5 v6 v7 v8 v9 0.65 0.85 0.55 0.8 0.75 0.9 0.7 0.9 0.6 0.5 0.5 0.45 0.4 0.4 0.85 v1 v2 v3 v4 v5 v6 v7 v8 v9 0.65 0.85 0.55 0.8 0.75 0.9 0.7 0.9 0.6 0.5 0.5 0.45 0.4 0.4 0.85 v1 v2 v3 v4 v5 v6 v7 v8 v9 0.65 0.85 0.55 0.8 0.75 0.9 0.7 0.9 0.6 0.5 0.5 0.45 0.4 0.4 0.85
a) Original Graph b) The new weighted graph based on proposed method
c) A structural summary with two super-nodes d) A hybrid summary with two super-nodes
As seen in Fig 4.c, hybrid summary (constructed based on GSSC) can be different with structural and conceptual summaries. In some cases this summary can be more reasonable and useful. As another example, consider the graph in Fig 5.a and let assume weights of edges are as shown in Fig 5.b. The structural summary of this graph shown in Fig 5.c and its summary based on GSSC method shown in Fig 5.d.
Up to now the new proposed method has been described informally and in the following section we tried to demonstrate this method formally. In this text, we will use conceptual and attribute-based summaries interchangeably.
A. Notations
In this section for more readability, the most frequently used symbols and abbreviations in this paper are described. We list symbols and their descriptions in the Table 2.
B. Proposed Method Computations
Weight of edges has an important role in summarization and for this reason the way these weights are calculated must be explained clearly. Weight of an edge is calculated as follows:
𝑤(𝑒) = 𝛼𝑤𝑠𝑡(𝑒) + (1 − 𝛼)𝑤𝑠𝑖(𝑒) (1)
0 ≤ 𝛼 ≤ 1
Where 𝛼 and (1- 𝛼) are weighting of structural and conceptual similarity and show their contributions in the weight of an edge in new constructed graph. For
equal contributions they are considered 0.5. For structural summarization, it is sufficient to consider 𝛼
equal to one and for conceptual summarization 𝛼 must be considered zero. The value of 𝛼 depends on application and the aim of summarization.
The weight of 𝑤𝑠𝑡 is as follows:
𝑤𝑠𝑡(𝑒𝑖,𝑗) = {
0 W[i][j] = 0
1 W[i][j] = 1 (2)
Where W is the adjacency matrix of the input graph. Attribute-based similarity of two vertices is also a reason for overall similarity of two vertices. Attributes can be single or multi-valued. Similarity of two vertices based on the given attribute set {𝑎1, 𝑎2, … , 𝑎𝑘} with
the importance degrees {𝑐1, 𝑐2, … , 𝑐𝑘} is calculated as
follows:
𝑤𝑠𝑖(𝑒𝑖𝑗) = ∑ 𝑐𝑙𝑤𝑠𝑖(𝑒𝑖𝑗, 𝑙) 𝑘
𝑙=1
(3)
In fact 𝑤𝑠𝑖(𝑒𝑖𝑗) is the similarity of two vertices 𝑣𝑖
and 𝑣𝑗 based on the given attribute set. The 𝑐𝑖
parameter is the contribution or importance of attribute
𝑎𝑖 in similarity of two vertices and has the following
conditions: 1) 0 ≤ 𝑐𝑖≤ 1
2) ∑𝑘𝑖=1𝑐𝑖= 1
Table 2: Symbols and abbreviations Notation Description
𝐺 graph
𝑠𝑖 ith super-node
den Density
𝑒𝑖,𝑗 𝑒𝑑𝑔𝑒 𝑏𝑒𝑡𝑤𝑒𝑒𝑛 𝑡𝑤𝑜 𝑣𝑒𝑟𝑡𝑖𝑐𝑒𝑠 𝑣𝑖 𝑎𝑛𝑑 𝑣𝑗
𝑠𝑒𝑖,𝑗 super-edge between two super-edges 𝑣𝑖 𝑎𝑛𝑑 𝑣𝑗
#𝑒𝑝,𝑞 # of edges between two super-nodes 𝑠𝑝 and 𝑠𝑞
𝑐(𝑎𝑖) contributions of the ith attribute
𝑤(𝑒) 𝑤𝑒𝑖𝑔ℎ𝑡 𝑜𝑓 𝑒𝑑𝑔𝑒 𝒆
𝑎𝑖(𝑣𝑝) value of ith attribute on node 𝑣𝑝
𝑛𝑣(𝐺) # of vertices of 𝐺
𝑛𝑒(𝐺) # of edges of 𝐺
𝑤(𝑒𝑖𝑗) weight of edge between two vertices 𝑣𝑖 𝑎𝑛𝑑 𝑣𝑗
𝑤𝑠𝑡(𝑒𝑖,𝑗) structural weight of edge between two vertices 𝑣𝑖 𝑎𝑛𝑑 𝑣𝑗
𝑤𝑠𝑖(𝑒𝑖,𝑗) attribute similarity weight of edge 𝑒𝑖,𝑗
𝑤𝑠𝑖(𝑒𝑖𝑗, 𝑙) Similarity of two vertices 𝑣𝑖 and 𝑣𝑗 based on 𝑙 th attribute.
𝑣𝑎𝑙(𝑣𝑖, 𝑘) value of kth single-valued attribute of vertex 𝑣𝑖
𝑣𝑎𝑙𝑠(𝑣𝑖, 𝑘) values of kth multi-valued attribute of vertex 𝑣𝑖
For calculating similarity of two vertices based on a given attribute, we use the Formula 4. In fact depending on being single or multi-valued attribute, its calculation differs. The single-valued attributes are compared exactly while for multi-valued attributes, Jaccard similarity measure is used.
𝑤𝑠𝑖(𝑒𝑖𝑗, 𝑘)
= {
0 𝑎𝑘𝑖𝑠 𝑠𝑖𝑛𝑔𝑙𝑒𝑣𝑎𝑙𝑢𝑒𝑑∧ 𝑣𝑎𝑙(𝑣𝑖 , 𝑘)! = 𝑣𝑎𝑙(𝑣𝑖 , 𝑘)
1 𝑎𝑘𝑖𝑠 𝑠𝑖𝑛𝑔𝑙𝑒𝑣𝑎𝑙𝑢𝑒𝑑∧ 𝑣𝑎𝑙(𝑣𝑖 , 𝑘) = 𝑣𝑎𝑙(𝑣𝑖 , 𝑘)
|𝑣𝑎𝑙𝑠(𝑣𝑖, 𝑘) ∩ 𝑣𝑎𝑙𝑠(𝑣𝑗, 𝑘)|
|𝑣𝑎𝑙𝑠(𝑣𝑖, 𝑘) ∪ 𝑣𝑎𝑙𝑠(𝑣𝑗, 𝑘)|
𝑎𝑘 𝑖𝑠 𝑚𝑢𝑙𝑡𝑖𝑣𝑎𝑙𝑢𝑒𝑑
(4)
C. GSSC Algorithm
After constructing the new weighted graph, the graph can be summarized in top-down approach. In every step, edges with weight less than a given threshold are removed and graph is partitioned into some subgraphs. This trend continues to achieve a summary with the right size. We have presented this approach in algorithm 1.
D. Super-edge Weight Computation
The weight of a super-edge is computed based on weight of edges between nodes in two super-nodes. For two super-nodes with m and n nodes the weight of super-edge between these two super-nodes can be computed as follows:
𝑤(𝑠𝑒𝑖,𝑗) =
1
𝑚 ∗ 𝑛∑ ∑ 𝑤(𝑒𝑖,𝑗)
𝑛
𝑗=1 𝑚
𝑖=1
(5)
Where 𝑤(𝑒𝑖,𝑗) is the weight of the edge between
two super-nodes 𝑆𝑖 and 𝑆𝑗. Edge weight is summation
of structural and conceptual weights which have contributions 𝛼 and (1 − 𝛼) respectively. There are some distance/similarity measures such as cosine, n-norm, Jaccard, etc. that can be used for this purpose. Based on application and the aim of summarization, one of these similarity measures can be used. In some situations these similarity measures can be customized. The output of comparing two nodes is a number in interval [0 … 1].
E. TIME COMPLEXITY
In the proposed method at first the weight of edge between every two vertices is calculated and after that the summary is generated by removing edges from less weighted toward high weighted. Thus the time complexity of the proposed algorithm is O(|𝐸| × |𝑉| × |𝑉|). This time complexity is for the worst case and in the best case when a large number of edges are removed in each iteration of algorithm, the time complexity is O(|𝑉| × |𝑉|).
IV. EVALUATION AND EXPERIMENTAL RESULTS
To evaluate the proposed method, we selected a real-life HEP-TH dataset and implemented our method and SGVR method and run them on a system with configurations given in Table 6. The details of dataset, application and system are demonstrated in following subsections.
We compared our proposed method with the recently published paper on this subject which is Bei’s method (SGVR). Authors of SGVR method have compared their method with other methods only based on density. Therefore for a fair comparison, we compared our proposed method with Bei’s method based on density. Of course for comparing methods that summarize a graph based on both structure and concepts it is reasonable to compare summaries by considering both density and entropy.
A. Dataset
We considered real-life dataset HEP-TH, which presents information on papers in high-energy physics, for evaluation our proposed method. This dataset is an attributed graph which can be downloaded from knowledge discovery laboratory . Every vertex of this graph is one entity of type paper, journal, author or email_domain. The vertices are connected by attributed edges. The more information about this graph is given in the Table 3.
The number of each entity given in Table 4 and the number edges between every pair of these four entities given in Table 5.
Value of #𝑒𝑥,𝑦shows the number of edges between
two entities representing by x and y. In fact sub-scripts x and y represent two first letters of four entities paper, author, journal and email_domain. For example pa, au, jo and em show paper, author, journal and email-domain respectively.
For summarization purposes, we considered a subgraph of this graph that only contains nodes of paper type. This subgraph has 29555 nodes.
---
Algorithm 1 Summarization (G, k , A, 𝛼, C)Input: G: graph, k: the right size of the summary, A: user interested attributes, 𝛼: the contribution of structure in the resulting summary, C: importance degrees of attributes
Output: S: the resulting summary
1. Calculate the weight of edge between every two vertices as 𝐸′
. 2. Construct a weighted graph 𝐺′= (𝑉, 𝐸′)
where 𝐸′= {(𝑣
𝑖, 𝑣𝑗)|𝑣𝑖 𝑎𝑛𝑑 𝑣𝑗∈ 𝑉 }
based on 𝐺 = (𝑉, 𝐸); 3. initialize 𝑤𝑡, 𝑠𝑖𝑧𝑒 and ∆𝑤;
4. num = |{𝐺′|where 𝐺′ is a connected copmponent of G and |𝐺′| > 𝑠𝑖𝑧𝑒}|
5. while (𝑛𝑢𝑚 < 𝑘) { 6. 𝐸′= 𝐸′− {𝑒
𝑖𝑗|𝑤(𝑒𝑖𝑗) < 𝑤𝑡}
7. 𝑤𝑡= 𝑤𝑡+ ∆𝑤;
8. 𝑟𝑒𝑐𝑎𝑙𝑐𝑢𝑙𝑎𝑡𝑒 𝑛𝑢𝑚, 𝑤𝑑𝑒𝑔 𝑎𝑛𝑑 𝑤𝑝𝑎𝑡ℎ
9. }
10. Select the 𝑘 biggest connected components as super-nodes and make the summary graph
Table 3: The dataset information
#vertices #edges #vertex attributes # edge attributes
42319 532430 39 15
Table 4: Number of entities in the dataset #paper #author #journal #email_domain
29555 9200 448 3116
Table 5: Number of edges between every pair of entities
#𝑒𝑝𝑎,𝑎𝑢 #𝑒𝑝𝑎,𝑗𝑜 #𝑒𝑝𝑎,𝐸𝑚 #𝑒𝑎𝑢,𝑗𝑜 #𝑒𝑎𝑢,𝐸𝑚 #𝑒𝑗𝑜,𝐸𝑚 #𝑒𝑝𝑎,𝑝𝑎 #𝑒𝑎𝑢,𝑎𝑢 #𝑒𝑗𝑜,𝑗𝑜 #𝑒𝐸𝑚,𝐸𝑚
58515 20826 0 0 12487 0 352807 87794 0 0
For each paper, we considered three attributes num_revisions, downloads_60days and area. The number of nodes that has each of these attributes are 29555, 1566 and 3199 respectively. Two first ones are numerical attributes and the third one is an alphabetical field. Conceptual similarity of two nodes is measured based on these three attributes.
B. Similarity Measures
The similarity of two nodes can be measured based on their attribute values. Here we use exact comparison of corresponding fields to compute similarity of two nodes. In fact we use Formula 6 to compute the similarity of two nodes 𝑁1 and 𝑁2.
𝑠𝑖𝑚(𝑁1, 𝑁2) =
∑3 𝑐𝑜𝑚𝑝𝑎𝑟𝑒(𝑎𝑖,𝑎𝑖′) 𝑖=1
3 (6)
In Formula 6, 𝑎𝑖 and 𝑎𝑖′ are the ith attributes of
nodes 𝑁1 and 𝑁2 respectively. If two nodes have the
same value on a given attribute then compare function returns 1 and otherwise returns 0. Of course comparing two fields can has a value in the range of 0 to 1 in general. Here for simplicity we considered it as a function with only two returned values (zero or one).
C. Implementation
We implemented the proposed method in Java with four designed classes namely PreparationGraph, Graph, Samples and SummaryGraph for this matter. We designed the first class for extracting the subgraph of each entity and put vertices and edges of that entity in separate files. Based on the figures resulted from four entities, as described in next section, we decided to select paper subgraph for summarization. Graph class has methods to construct graph, getting its vertices and edges and setting attributes of vertices. An instance of
Graph class constructed for paper graph. For experimental aim, Samples class has designed to make subgraphs with different sizes of paper graph. In fact Samples class get a size as input and creates a sub-graph of that size. SummaryGraph has designed to get an instance of Graph and provide methods to summarize it.
D. System Configuration
We used a system with the configuration given in Table 6 to run program and evaluate the proposed method.
Table 6: System configuration
Processor Intel(R)Core(TM) i7 3.5 GHz
RAM 32GB
System type 64 bit
OS Windows 8
E. Results
To present an overall view of number of vertices and edges of graph, we produced 12 subgraphs that the number of vertices and edges are given in Table 7 and its chart is shown in Figure 6.
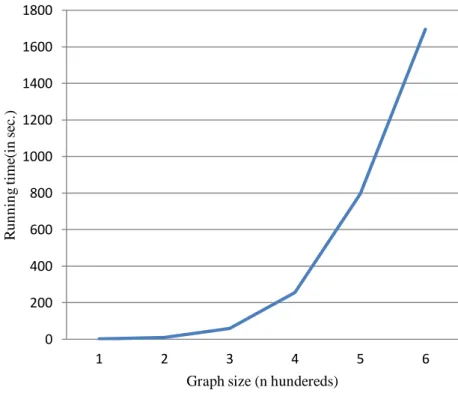
To show the order of running time of the summarization algorithm, we produced some subgraphs with sizes given in Table 8 and run summarization algorithm for each of graphs with k=10. Their running times are given in Table 8 and its chart is shown in Figure 7.
Up to now the best method to summarize a graph based on both structure and concepts is SGVR [8]. Henceforth to evaluate our proposed method, we compared our method with this method. In the aim of evaluation, we implemented our proposed method and also SGVR method and summarized graphs with Table 7: Number of edges versus number of vertices
#vertices 10 100 1000 2000 3000 4000 5000 6000 7000 8000 90000 10000
#edges 0 1 253 2335 6633 12526 19104 27618 36081 45888 57600 69159
Fig 6: Number of edges based on the number of vertices Table 8: Processing times based on graph size
Summary size (No. of vertices) 100 200 300 400 500 600
Processing time (in sec.) 2 9 60 256 796 1696
different sizes and different values of α as shown in Figure 8. The summary produced with our method and
with α=0.0 is approximately equal to the summary produced with SGVR method according to Figure 8.
Figure 7: Running time of summarization algorithm based on graph size Density measurement has been used to evaluate the
quality of produced summaries. The density of the summary graph is computed as follows:
den({𝑉𝑖}𝑖=1𝑘 ) = ∑
|{(𝑣𝑝,𝑣𝑞)|𝑣𝑝,𝑣𝑞∈𝑉𝑖 ,(𝑣𝑝,𝑣𝑝)∈𝐸}|
|𝐸| 𝑘
𝑖=1
As shown in Figure 8, the density of summary produced by our proposed method for values near to 0 for α is approximately equal to density of summary produced by SGVR method.
0 10000 20000 30000 40000 50000 60000 70000 80000
1 2 3 4 5 6 7 8 9 10 11 12
n
um
b
er
o
f
edge
s
number of vertices
0 200 400 600 800 1000 1200 1400 1600 1800
1 2 3 4 5 6
R
un
n
in
g
ti
m
e(i
n
s
ec
.)
Graph size (n hundereds)
nv(G)=300 a)α =0.5 den=0.9629 b) α =0.2 den=0.5185 c) α =0.0 den=0.4814 d) SGVR den=0.5185
nv(G)=500 α =0.5 den=0.9146 b) α =0.2 den=0.6829 c) α =0.0 den= 0.5365 d) SGVR den=0.5365
nv(G)=1000 α =0.5 den=0.9486 b) α =0.2 den=0.7667 c) α =0.0 den=0.4189 d) SGVR den=0.4103
Fig 8: Each row shows summary of a given graph with determined size. First three columns of every row have produced by our proposed method and the fourth one by SGVR method. Each chart shows the size of super-nodes of the summary. Of-course only super-nodes with size greater than one has shown.
V. DISCUSSION
Our experimental results shows that the contribution of structure in the summary generated by Bei’s method is too small. As we see in columns 3 and 4 of Fig 8, the density of the summary generated based on Bei’s method is equal to density of summary of our proposed method with the structure contribution of zero. Thus Fig 8 shows that the contribution of structure in the resulting summary based on Bei’s method is close to zero. Unlike Bei’s method our proposed method is flexible and can generate a summary with any contribution degree of the structure. Summaries with different sizes are resulted because of considered different values for structure contribution in our proposed method.
The proposed method has the following features that make it superior to existing methods. In our opinion this method is the best candidate to graph summarization.
Generate a summary with any size
In methods such as Bei’s generating a summary with any size is not possible, because in these methods an initial summary is created based on attributes and their values. For a real-world graph which every node have many attributes the initial summary is not small. But our proposed method works based on removing edges and creating a summary with a proportional size is possible.
Producing summary based on user needs The degree of contributions of structural and attribute similarities in the resulting summary can be determined by the user based on our proposed method. In our proposed method, it is possible to increase the contribution of the structure and attribute similarities in the resulting summary.
Unified approach
Some methods like the one proposed by Bei at first summarize graph based on attribute similarities and then adjust the summary to support graph topology. Such methods may work for some graphs but they are
inefficient for situations where changing the resulting attributed summary to support graph topology needs a lot of vertex exchange between super-nodes. Our proposed method considers both structure and attribute concurrently and have no additional overhead.
Learning capability
In situations where summaries are used for query answering, the contributions of structure and concepts in producing summary can be learned by the algorithm. Therefore by producing different summaries and evaluating their accuracy in answering user queries, the weighting factors of structure and concepts to constructing summary can be learned by the algorithm.
Up to now the best method for graph summarization is SGVR method [10]. As seen in columns 3 and 4 of Figure 8, our method converge to SGVR by taking the value of α near to 0. Thus our method is more flexible than SGVR method in considering any contribution degree for structure to generating summary. Because in our method the contribution of structure can be given explicitly by the user while in Bei’s method it is resulted by adjusting summary to graph structure. Thus we say that our proposed method is more general than Bei’s method.
VI. CONCLUSION AND FUTURE WORK
A new method for summarizing a graph based on both structure and concepts proposed. The proposed method implemented in Java and evaluated by real life dataset HEP-TH. We compared our method with Bei’s method [10] by implementing this method also. The experimental results showed the effectiveness of our method. The proposed method has the advantage that the contributions of structure and attribute similarities can be determined by user and for this reason generate summary based on user needs.Summary graph can be used for answering user queries. The more precisely queries the summary answers, the more the summary is better. Determining the best values for contributions of structure and concepts in producing summary is important and is one of our future plan. Learning which kind of summarization, structural, conceptual or mixture of them is necessary to answer a given query set is of our future plan. Designing a set of queries to evaluate the accuracy of summarization methods is also of our future plans.
REFERENCES
[1] J. Gross and J. Yellen, “Graph theory and its applications,” 2006.
[2] Aggarwal C C, Wang H (2010) Graph data management and mining: A survey of algorithms and applications. In: Aggarwal C (ed) Managing and Mining Graph Data.Springer US, pp 13-68.
[3] U. Kang, “Mining Tera-Scale Graphs: Theory, Engineering and Discoveries,” PhD Thesis, no. May, 2012.
[4] K. LeFevre and E. Terzi, “GraSS: Graph Structure Summarization,” Proc. 2010 SIAM Int. Conf. Data Min., pp. 454–465, 2010.
[5] S. Navlakha, R. Rastogi, and N. Shrivastava, “Graph summarization with bounded error,” Proc. 2008 ACM SIGMOD Int. Conf. Manag. data - SIGMOD ’08, p. 419, 2008. [6] Y. Tian, R. A. Hankins and J. M. Patel, “Efficient Aggregation for Graph Summarization Categories and Subject Descriptors,” pp. 567–579.
[7] N. Zhang, Y. Tian, and J. M. Patel, “Discovery-driven graph summarization,” 2010 IEEE 26th Int. Conf. Data Eng. (ICDE 2010), pp. 880–891, 2010.
[8] Y. Bei, Z. Lin, and D. Chen, “Summarizing scale-free networks based on virtual and real links,” Phys. A Stat. Mech. its Appl., vol. 444, no. 2, pp. 360–372, 2016.
[9] H. Cheng, Y. Zhou, and J. X. Yu, “Clustering Large Attributed Graphs: A Balance between Structural and Attribute Similarities,” ACM Trans. Knowl. Discov. Data, vol. 5, no. 2, p. 12:1--12:33, 2011.
[10] S. Navlakha, M. C. Schatz, and C. Kingsford, “Revealing biological modules via graph summarization.,” J. Comput. Biol., vol. 16, no. 2, pp. 253–264, 2009.
[11] M. I. Seltzer and P. Macko, “Provenance Map Orbiter: Interactive Exploration of Large Provenance Graphs,” Proc. 3rd USENIX Work. Theory Pract. Proven., pp. 20–21, 2011. [12] C. Chen, X. Yan, F. Zhu, J. Han, and P. S. Yu, “Graph OLAP:
Towards online analytical processing on graphs,” Proc. of IEEE Int. Conf. Data Mining, ICDM, pp. 103–112, 2008. [13] C. Chen and C. Lin, “Mining graph patterns efficiently via
randomized summaries,” Proc. of the VLDB Endowment, vol. 2, no. 1, pp. 742–753, 2009.
[14] M. Riondato, D. Garcia-Soriano, and F. Bonchi, “Graph Summarization with Quality Guarantees,” Proc. - IEEE Int. Conf. Data Mining, ICDM, vol. 2015–Janua, no. January, pp. 947–952, 2015.
[15] R. Pienta, A. Tamersoy, H. Tong, and D. H. Chau, “MAGE: Matching approximate patterns in richly-attributed graphs,” Proc. - 2014 IEEE Int. Conf. Big Data, IEEE Big Data 2014, pp. 585–590, 2015.
[16] G. a. Bilodeau and R. Bergevin, “Matching Graphs with Fuzzy Attributes in Machine Vision,” Int. J. Robot. Autom., vol. 20, pp. 1–22, 2005.
[17] N. Z. Gong et al., “Jointly predicting links and inferring attributes using a social-attribute network (san),” arXiv Prepr. arXiv1112.3265, p. 9, 2011.
[18] X. Liu, Y. Tian, Q. He, W.-C. Lee, and J. McPherson, “Distributed Graph Summarization,” Proc. 23rd ACM Int. Conf. Conf. Inf. Knowl. Manag. - CIKM ’14, pp. 799–808, 2014.
[19] N. Shah, D. Koutra, T. Zou, B. Gallagher, and C. Faloutsos, “TimeCrunch: Interpretable Dynamic Graph Summarization,” Proc. 21th ACM SIGKDD Int. Conf. Knowl. Discov. Data Min., pp. 1055–1064, 2015.
Nosratali Ashrafi Payaman received his B.Sc. degree in software engineering from Kharazmi University in 1999 and his M.Sc. degree in computer science from Sharif University of Technology in 2002. He is currently a Ph.D. student in software engineering at Iran University of Science and Technology and is also a faculty member of Kharazmi University. His current main research interests include analysis and design of algorithms, graph summarization and software vulnerability.
Mohammadreza Kangavari
received his B.Sc. degree in mathematics and computer science form Sharif University of Technology in 1982, his M.Sc. degree in computer science from Salford University in 1989, and his Ph.D. degree in computer science from the University of Manchester in 1994. He is currently a lecturer in the Computer Engineering Department, Iran University of Science and Technology, Tehran, Iran. His research interests include intelligent systems, machine learning, and wireless sensor networks.