on Low Socioeconomic Status Americans.
(Under the direction of DR. MORRIS A. SHIFTMAN.)
Americans are exposed to air pollution outside, and in their places of work, at school, and in their homes. Low socioeconomic status Americans have traditionally been at greater risk to all forms of pollution, and
indoor air pollution is no exception. Protection against indoor air pollution is one of the six necessary requirements for healthy housing. There are 33 million children and adults below the poverty level in this country who are more likely to suffer ill effects due to indoor air pollution, primarily because more pollutant sources are present in their
homes than in the homes of middle to upper income Americans. The use of
combustion appliances as primary or secondary heat sources, the presence
of asbestos insulation, lead-based paint, and biological contaminants in
older homes, along with frequent pesticide use and the influx of ambient air pollutants all increase the risk of health effects ranging from mucous membrane irritation to increased risk of developing cancer. The
current Federal legislation regarding indoor air pollution will not sufficiently protect these people; a more active program is needed.
Strict enforcement of existing legislation, development of new legisla¬
Table of Contents
Chapter Page
I. Introduction
II. Identification of Indoor Air Pollution
Hazards to Low Income Americans
III. Exposure Levels Expected 11
IV. Dose-Response Assessment 26
V. Estimated Number of Low Income Americans 36
Exposed to These Pollutants
VI. Public Health Implications 42
VII. Review of Existing Federal Laws Regarding 48
Indoor Air Pollution
VIII. Conclusion 52
Tables and Figures
Table Page
1. Exposure Levels and Emission 12 Rates from Combustion Appliances
2. Biological Contaminant 18 Concentrations
3. Concentrations of the Most 19
Common Pesticides
4. Automobile Emissions 24
5. Environmental Tobacco Smoke 25 Pollutant Concentrations
6. Formaldehyde Dose-Response 30 Information
7. Dose-Response Information for 34 Blood-Lead Levels
8. Summary of Indoor Air Pollutant 43 Concentration Levels
9. Estimated Number of Low Income 45 Americans Affected by Indoor Air
Pollution-Related Health Problems
10. Check List of the Presence of Indoor 56
Air Pollution Sources and Health Problems
Figure Page
1. Routes of Lead Exposure 8
2. Relationship Between Lead in 22
o 3 NO-: 1 mg/m = 0.532 ppm 1 ppm =1.9 mg/m
o 3 CO: 1 mg/m = 0.873 ppm 1 ppm = 1.145 mg/m
o 3
HCHO: 1 mg/m-^ = 0.813 ppm 1 ppm = 1.23 mg/m
o 3
air became hard to breathe on Park Avenue- and no
one was concerned. Black children in the rural South had to drink contaminated water from filthy
drainage ditches-and still do-for years before oil spills killed the waterfowl or annoyed swimmers in Santa Barbara. The rural poor of Mississippi are
not particularly interested in the ultimate dis¬
posal of plastic containers, glass bottles,or beer
cans even though these are lofty present-day envi¬
ronmental goals. For the rural poor, the issue is
not smog. It is survival."
Andrew B. James, Assistant Professor of Community Health and Social Medicine, Tufts University Medical
School (Sherrill, 1971).
Low income Americans have traditionally been exposed to more adverse conditions than Americans of the middle and upper classes. Adequate housing conditions should be available to every American, regardless of their socioeconomic status. The World Health Organization (1987) lists
some of the necessary requirements for healthy housing as: 1) adequate water supply, 2) avoidance of overcrowding, 3) adequate solid wastes and excreta disposal, 4) access to community services, 5) adequate structural
features, and 6) protection against indoor air pollution. It is this
last requirement for a healthful living environment, protection against
indoor air pollutants, which will be the focus of this paper.
Exposure to air pollution occurs outside, in the workplace, in the school, and in the home. Federal regulations exist to protect against
ambient and workplace exposures, but very few protect against pollutants
health. This paper is the first of its kind to discuss the extent of the
indoor air pollution problem in the homes of low socioeconomic status
Americans, and it will demonstrate that indoor air pollution is more of a
problem for these people than for the middle and upper classes. An
evaluation will be made of the adequacy of the existing Federal
regulations in dealing with the problem and protecting against the
adverse health effects which result from exposures. Recommendations
will be made so that low socioeconomic status Americans may be better
protected from the avoidable effects of indoor air pollution. Finally, a
check list will be provided as an output of this report to aid in the
identification of potential or existing indoor air pollution problems so
that the knowledge gained through this assessment can be used to stimu¬
late public health actions. '
It has long been recognized that healthful living conditions are
an integral part of public health. The first public policies in the
United States concerning housing were established in the 1600's, and by
the 1850's it was known that sanitary and uncrowded living conditions
were a necessity (Mood, 1969). The Tenement Act of 1901 in New York City
was used as an example by other large cities to establish housing laws.
In 1934, the National Housing Act was passed, and the Federal Housing
Administration was created to carry out its objectives, including the
development of minimum property standards for the determination of
insurability of Federal mortagages (Mood, 1969). The most significant
piece of public housing legislation was the Housing Act of 1949, which
In 1968 the nation's attention turned to housing as it never had before, and Congress passed the most sweeping housing legislation since
1949, which introduced a variety of federal assistance mechanisms (Urban
America Inc., 1975). Two Presidential review bodies, the Douglas Commission and the Kaiser Commission, made recommendations to improve the housing conditions of low socioeconomic status Americans.
In 1970, the Department of Health, Education, and Welfare published
the Neighborhood Environmental Evaluation and Decision System (NEEDS),
which was designed to provide information on environmental problems
so that action could be taken, the effects could be evaluated over time,
and to increase the effectiveness and financial efficiency of money
spent. NEEDS was also intended to provide researchers with associations
and correlations between the prevalence of health problems and the
quality of the residential environment. Finally, NEEDS was designed to
better understand an area's problems, to test alternatives, and to match
existing services to an area's needs (U.S. DHEW, 1970).
The check list provided in Section VIII can be considered to be an extension of the NEEDS analysis, which focuses specifically on the
problems caused by the presence of indoor air pollutants and their sources. This check list will also help researchers identify relation¬
ships between the prevalence of health problems and residential con¬ ditions. Like the original NEEDS assessment, the health problems to be examined most closely are those of infants, pre-school children, and the
The effects of indoor air pollution on lower income families are
more severe than the effects on middle and upper income families for
several reasons. Primarily this group is more at risk because there are
more pollutant sources present, hence more exposure occurs. For example,
the type of heating method is an important factor in the potential
exposure to nitrogen dioxide (NO ), carbon monoxide (CO), sulfur dioxide
(SO ), volatile organic compounds (VOCs), polycyclic aromatic
hydrocarbons (PAHs), and particles. Less affluent families are more
likely to use wood or coal burning heating appliances and kerosene or
gas-fired space heaters as either their primary heat source or as a secondary source. The presence of a combustion appliance is especially important to consider when examining the types of environments where these appliances are most commonly used. The Energy Information
Administration (1986) found in their Residential Energy Consumption
Survey that almost half of all kerosene heaters are used in
multi-family dwellings, many of which have only one exterior wall and may have
close to zero air changes per hour. Another third of all kerosene
heaters are used in mobile homes, which also have low air exchange rates.
In addition, the use of cheaper K-2 kerosene fuel will increase the sulfur
emissions from kerosene heaters. It is also known that some Americans
Low income families are the most common occupants of mobile homes,
where formaldehyde exposures are of special concern because these environments have lower air exchange rates than most homes, are of smaller volume, and contain more sources of volatile organic compounds
(VOCs) than other types of housing (Spengler and Sexton, 1983). These
sources include materials in the mobile home such as particleboard and plywood, and carpets and furnishings. New mobile homes are usually purchased by retired persons on fixed incomes and families with young
children, and these groups are hypersensitive to the health effects of indoor air pollutants.
Another common source of indoor air pollution is the presence of asbestos in ceiling tiles, floor tiles, spackling, insulation, and
cement. Homes built before 1970 can be assumed to have asbestos present
unless renovation has been done. Older, poorly maintained homes are
often inhabited by fixed- or low-income families, thus this socio¬
economic group is more likely to be exposed to asbestos fibers. Asbestos exposure also increases during and immediately after removal occurs,
especially if removal is handled improperly.
Older homes are also likely to be a source and breeding ground of
biological contaminants. Bacteria, viruses, molds and their spores,
mildew, and animal and insect parts and excreta are included in this
pollutant category. High humidity is the most important factor which encourages the growth and dissemination of these contaminants (Burge,
1985). A living environment which is not tightly weatherized encourages
which can also be a problem in homes which are so tightly weatherized
that humidity increases through the use of showers and appliances. Rats,
mice, dust mites, and cockroaches also contribute biological contaminants
through the dissemination of their feces, urine, and body parts (U.S.
EPA, 1987).
It is probable that the presence of the above mentioned biological
contaminants causes lower income families to be exposed regularly to pesticides. In low-rent apartment complexes or public tenements,
the residents may have little or no control over the frequency or amount
of pesticides applied, and may apply additional pesticides themselves.
The use of insecticides, fungicides, and termiticides, indoors or
out-of-doors, may result in increased exposure to chlordane, diazinon,
chlorpyrifos, heptachlor, and propoxur, among others (Lewis et al.,
1986).
Lead is another indoor air pollutant to which low income Americans may be exposed. Exposure can occur via several routes, such as
inhalation of contaminated household dust or soil, inhalation of ambient
air near a stationary source such as a smelter, or drinking or eating
lead-contaminated water or food. Ninety-nine percent of all homes built
before 1940, 70% of homes built between 1940 and 1959, and 20% of the
homes built from 1959 to 1974 have paint with lead concentrations greater
2
than 0.7 mg/m (ATSDR, 1988). It is well documented that lead poisoning
often occurs when children ingest lead-containing paint chips (Lin-Fu,
1982), but exposure also occurs through inhalation of airborne
lead-containing house dust and by mouthing or sucking hands or objects which
economically deprived children, especially black children (Chatterjee and
Gettman, 1972; ATSDR, 1988). Charney and co-workers (1980) found that
high blood-lead levels were associated with household lead dust levels.
Exposure to lead may also occur when a lead-based paint on an outdoor
surface is peeling or decaying (Ter Haar and Aronow, 1974). Ingestion of
soil or mouthing or sucking of soil covered objects may occur, or lead
may be inhaled along with dirt particles (Ter Haar and Aronow, 1974).
Exposure to airborne lead is also often increased during renovation or
removal processes (Lin-Fu, 1982; Inskip and Atterbury, 1983).
Homes which are not tightly weatherized encourage the entrance of many ambient pollutants into the indoor environment. Aside from
externally applied pesticides, homes in high-traffic areas are besieged
with automotive pollutants such as NO , CO, particles, benzene, and
diesel emissions. Rose and co-workers (1985) state that central
metropolitan areas receive higher traffic density than other parts of the
city, and low income households tend to be located in these central
areas. Esmen (1985) estimates that 20% of the homes constructed before
1970 have air exchange rates greater than 1.5 air changes per hour (ACH).
This level compares to new homes which have 0.2 to 0.5 ACH.
Other pollutants to be discussed here are radon and environmental
tobacco smoke. Although low income residents are not necessarily at
greater risk through higher exposures, it is probable that they are not
as aware of the problems associated with these pollutants as they should
be, or as likely to be able to afford even minimal mitigation methods for
radon. In addition, these pollutants act synergistically with other
AMBIENT
AIR SOIL
PLANTS
INHALED AIR
yiinL I
ANIMALS
DUSTS
SURFACE AND GROUND WATER
FOOD
SOLDER
DRINKING
WATER
MAN
Figure 1. Routes of Lead Exposure. Source: U.S. EPA (1986b).
treatment options once health problems arise, and their mitigation
options. Although it is known that the average American spends up to 16
hours a day at home, young children, the infirm, and the elderly most
assuredly spend even more time in their homes. It is often this group
that is hypersensitive to the pollutants discussed above (Ammann, 1987).
Studies show that low income families are less likely to seek
medical treatment than middle or upper income families. Newacheck and
Starfield (1988) compared morbidity and physician visits for low and high
income children and found that on the average, children from families
with annual incomes of less than $10,000.00 had more bed days due to
multiple health problems, yet used fewer physician services than higher
income children in similar health.
The lack of information distributed to this group may also result in
obvious signs and symptoms of pollution exposures to be ignored. An
example of this are the flu-like symptoms of nausea, dizziness, and
headache which occur following exposure to carbon monoxide (Dolan, 1985).
If these symptoms are ignored, and the exposed individual remains home in
order to "recover," the consequences may be fatal. An individual who
becomes ill due to exposure to an indoor air pollutant usually relies on
the medical profession to diagnose the cause of their ailment. This
diagnosis is made more difficult by the presence of multiple pollutant
sources. If a diagnosis is made, however, that an indoor air pollutant
is responsible, the next question is what can be done to eliminate
exposure. Economic limitations and the fact that the residence is not
owner-occupied may prevent or hinder even the most simple mitigation
33% of the renter-occupied units house families which make less than $10,000.00 per year (U.S. Bureau of the Census, 1985). Product
substitution, such as purchasing a newer-model combustion appliance or replacing old furnishings, may be economically unfeasible. In extreme cases, where the residence cannot be altered to reduce pollutant levels,
a family of low socioeconomic status may not have the luxury to consider
Combustion Appliances
The use of combustion appliances as a primary or secondary heat
source often results in exposures to nitrogen oxides, sulfur dioxide,
acid aerosols, particulate matter (including soot), volatile organic
compounds (i.e., formaldehyde), polycyclic aromatic hydrocarbons (i.e.,
benzo(a)pyrene), and carbon monoxide (U.S. EPA, 1987). Combustion
appliances include wood stoves, fireplaces, kerosene space heaters, and
gas-fired space heaters and appliances.
As shown in the following table, test results from experimental
chambers and actual in-home measurements give emission rates and
pollutant levels for the compounds discussed above (Table 1). The
emissions generated from combustion appliances can vary greatly according
to the type of appliance, the appliance's age and operating condition,
the type of fuel used, and the ventilation conditions in the room and
house. For example, unvented kerosene space heaters can be convective,
radiant, radiant/radiant, radiant/convective, or wickless (U.S. EPA,
1987). Higher flame heights during operation will increase the emission
of nitrous oxide, while lower flames result in increased emissions of
carbon monoxide, formaldehyde, and particulate matter (Mueller Asso¬
ciates, 1985). The emission of sulfur dioxide from kerosene heaters is
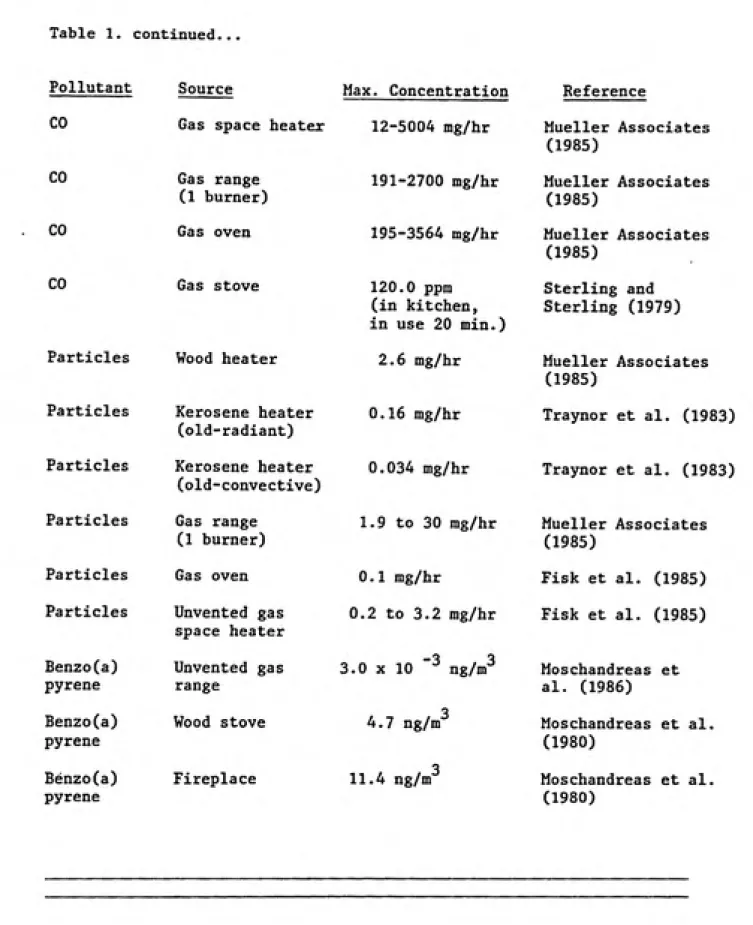
dependent on the amount of sulfur in the fuel. In general, older
Table 1. Exposure Levels and Emission Rates from Combustion Appliances Pollutant NO, NO, NO. NO. NO, NO, NO. SO, SO, SO, SO, CO CO CO CO Source Gas kitchen stove Gas Range (1 burner) Gas oven Kerosene heater (radiant) Kerosene heater (convective)
Gas space heater
Wood heater Kerosene heater
(low sulfur fuel) Kerosene heater
(radiant)
Kerosene heater (convective) Wood stove
(non-air tight)
Wood stove (non-air tight) Wood heater Kerosene heater (radiant) Kerosene heater (convective)
Max. Concentration Reference 1 mg/m (in kitchen) 18-430 mg/hr 67-270 mg/hr 16-38 mg/hr 33-530 mg/hr 3-1225 mg/hr 1.3-7.0 mg/hr 0.1-2.0 ppm
(12 hr average) 31-109 mg/hr
37-94 mg/hr
42.4 ppb
(hourly concen.)
9.1 ppm
(1 hr. concen.)
70-375 mg/hr
281-542 mg/hr
35-635 mg/hr
U.S. EPA (1987)
Mueller Associates (1985) Mueller Associates (1985) Mueller Associates (1985) Mueller Associates (1985) Mueller Associates (1985) Mueller Associates (1985)
U.S. EPA (1987)
Table 1. continued...
Pollutant Source Max. Concentration Reference CO
CO CO CO
Gas space heater 12-5004 mg/hr
Particles Particles Particles Particles Particles Benzo(a) pyrene Benzo(a) pyrene Benzo(a) pyrene Gas range (1 burner) Gas oven Gas stove
Particles Wood heater Kerosene heater (old-radiant) Kerosene heater (old-convective) Gas range (1 burner) Gas oven Unvented gas space heater Unvented gas range Wood stove Fireplace 191-2700 mg/hr 195-3564 mg/hr 120.0 ppm (in kitchen,
in use 20 min.) 2.6 mg/hr
0.16 mg/hr
0.034 mg/hr
1.9 to 30 mg/hr
0.1 mg/hr
0.2 to 3.2 mg/hr
3.0 X 10 "^ ng/m^
4.7 ng/tiT 11.4 ng/m~ Mueller Associates (1985) Mueller Associates (1985) Mueller Associates (1985) Sterling and Sterling (1979) Mueller Associates (1985)
Traynor et al. (1983)
Traynor et al. (1983)
Mueller Associates (1985)
Fisk et al. (1985)
Fisk et al. (1985)
Moschandreas et
al. (1986)
Moschandreas et al.
(1980)
dioxide, and formaldehyde, while radiant heaters produce the highest
levels of particles (Traynor et al., 1983). Pollutant emissions from gas-fired space heaters also vary according to usage pattern, brand of
heater, burner design, size of heater, and the fuel-to-air mixture
(Mueller Associates, 1985). Wood burning stove emissions and fireplace
emissions into the indoor environment vary because of improper instal¬
lation, cracks or leaks in the stove pipe, negative air pressure in the room, downdrafts, and refueling (U.S. EPA, 1987). Use patterns,
appliance type, and type of wood burned also affect emission rates (U.S.
EPA, 1987). Gas-stove emissions are affected most by the presence or
absence of an outdoor-ventilated fan and whether the appliance has a
pilot light or a newer electric starter. The age of the stove, the burner design, the number of burners in use, and the flame intensity have not been shown to affect pollutant emissions (GEOMET Technologies, Inc.,
1976). Pilot lights produce pollutants during use and non-use periods
(GEOMET Technologies, Inc., 1976).
Sterling and Kobayashi (1981) found that CO concentrations may reach
25 to 50 ppm in homes in which the gas range is used for heating
purposes. They also investigated the amount of time the gas ranges were
used per day, and found an average of two hours per weekday and three
hours per weekend day. The National Ambient Air Quality Standard (NAAQS)
for carbon monoxide is 35 ppm for 1 hour, and 9 ppm for an 8 hour average.
In addition to the factors mentioned above, the number of combustion
appliances in use will affect pollutant levels. Leaderer and co-workers
measured levels of NO in homes with kerosene heaters and gas stoves, and
3
found average NO levels of 7.4 ug/m (4 ppb) in homes with neither
appliance, 36.8 ug/m (19 ppb) in homes with one kerosene heater and no
3
stove, and NO levels of 66.8 ug/m (36 ppb) in homes with one kerosene
heater and a gas stove. Parkhurst et al. (1988) monitored NO- levels in
public housing units with gas stoves, gas water heaters, and one or more
vented gas heaters. They found that 47% of the 185 units had at least
one weekly N0„ measurement greater than 100 ppb, and 7% had at least one
200 ppb measurement or higher. The highest NO level encountered was a weekly average of 1402 ppb and a unit average of 989 ppb. Theseconcentrations can be compared to the primary National Ambient Air
Quality Standard of 50 ppb (annual average) for N0_. The 50 ppb annual
average is the maximum ambient concentration to which Americans can be
exposed for 24 hours per day for 365 days per year. It should be kept in
mind that most Americans spend most of their time indoors rather than outdoors, and while the 50 ppb level may not be exceeded continually,
during the heating season (up to six months of the year) this level may
be greatly exceeded for 24 hours per day.
Several studies have shown that although combustion appliances are known to emit formaldehyde, these emissions do not significantly affect
indoor levels. Girman and co-workers (1982) predicted average
formal-3
dehyde steady-state levels of 65 ug/m for well tuned, unvented
gas-3
fired space heaters, and levels of 391 ug/m for poorly tuned heaters.
Leaderer et al. (1984) found that formaldehyde levels were low
3
(27.5 ug/m ) in homes with various combustion sources present and
remained low even in the presence of two kerosene heaters and a gas
stove.
Mobile Homes
Mobile homes have been found to often have elevated concentrations
of volatile organic compounds because of the presence of many material
EPA (1987) reviewed the formaldehyde levels in mobile homes and homes
with urea formaldehyde foam insulation, many of which were based on
complaint investigations. The formaldehyde levels found in these
3
environments ranged from 0.0 to 9.8 mg/m . The highest value will only
3
occur rarely, however, typical concentrations range from 0.1 to 1.0 mg/m
(Ammann et al., 1986). The NEC (1981a) reviewed formaldehyde levels in
3
mobile homes after complaints and found a range of 0.03 to 3 mg/m , unrelated to ambient formaldehyde levels.
Asbestos
Asbestos used in floor and ceiling tiles, insulation, and other materials may be in the form of chrysotile, amphibole, or actinolite.
Chrysotile is the most common asbestos form found in the U.S. (U.S. EPA,
1987). Exposure usually occurs when the asbestos-containing material is
physically damaged, but may also occur because of degradation, humidity
variations, or vibration (U.S. EPA, 1978). The presence of asbestos in
an indoor environment does not necessarily imply that exposure is occuring. Intact materials may not increase asbestos concentrations.
Samples taken in a building with asbestos cement wall and roofing
materials showed that following a heavy rain, asbestos concentrations
3
ranged from 20 to 4500 ng/m (Nicholson, 1978). The wearing of asbestos
flooring tiles has been shown to cause asbestos concentrations of 170
o 3
ng/m , and Constant et al. (1983) measured asbestos levels of 183 ng/m
in school areas with asbestos surfacing materials. Nicholson et al.
(1978) sampled 10 schools and found crysotile levels ranging from 9 to
o 3 3
1950 ng/m , with an average of 217 ng/m . The 1950 ng/m measurement
occured following floor sweeping in an area with a water-damaged asbestos
Biological Contaminants
An estimate of exposure to biological contaminants is more difficult
than for the other indoor air pollutant categories discussed here.
Because little is known about the occurrence and concentration levels, and because monitoring methods are not standardized to permit comparison of results, this discussion will simply detail the specific biological contaminants which are known to occur in indoor environments and discuss the factors that are known to affect concentrations. Molds and their
spores, bacteria, viruses, protozoans, algae, insect body parts and
excreta, pollen, and animal excreta make up this group of indoor air pollutants (U.S. EPA, 1987). Some of the molds identified indoors to
date include: Aspergillis and Penicillium, and the bacteria include
Legionella, Staphyllococcus, and Streptococcus (Burge, 1986). Insect
parts and excreta are commonly found in house dust, especially dust mite feces (Andersen and Korsgaard, 1986). The concentrations of biological contaminants usually vary with season, and are affected by the indoor/
outdoor pressure gradient, temperature, and humidity (Burge, 1985).
Andersen and Korsgaard (1986) found that the optimal environment for most biological contaminants is a temperature around 25 degrees Centigrade
and 75 to 80% relative humidity. Many of these contaminants enter from
the outside, such as pollen, algae, and mold spores, thus the
tightness of the home can directly affect the pollutant concentrations
(Burge, 1985). Once inside, contaminants such as house dust mites,
bacteria, and algae breed in such places as air conditioners, humidi¬
fiers, refrigerator drain pans, insulation, bedding, carpets, and
upholstery (Platts-Mills and Chapman, 1987). Solomon (1975) reports that
under poor hygienic conditions, concentrations of fungal spores indoors
Table 2: Biological Contaminant Concentrations
Contaminant Bacteria Bacteria Bacteria
Fungal spores Fungal spores Fungal spores
Pollen
Measurement
Colonies/sample Colonies/sample Colonies/sample Colonies/sample Colonies/sample
Colonies/sample
Grains/m
Adapted from: Samfield (1985)
Concentration
Indoor / Outdoor
Building
27 16 (fall) Apartment 40 43 (spring) Apartment
71 6 (fall) House
12 38 House 60 76 House 55 13 House
11 205 (no AC) House
measurements of bacteria, fungal spores, and pollen taken from homes and
apartments by various researchers in the U.S., England, Denmark, and
Japan.
Pesticides
People are exposed to pesticides via ingestion, inhalation, and
dermal exposures (Lewis et al., 1986). Lewis and co-workers (1986)
investigated inhalation exposures in a nine-home pilot study. The most
common pesticides they encountered in their sampling were chlorpyrifos, diazonon, chlordane, propoxur, and heptachlor. Chlorpyrifos is an
insecticide used in the control of mosquitos, cockroaches, termites, and
lice, among others (Lewis et al., 1986), and diazinon is an insecticide used to control soil and household insects and flies. Chlordane and
heptachlor are termiticides whose use was restricted in 1987 and banned
cockroaches, flies, and mosquitos (Lewis et al., 1986). The concen¬
trations measured for these five compounds were usually one order of
magnitude higher than for any other pesticides found, and the indoor
levels measured were generally one to two orders of magnitude higher
than outdoor levels (Lewis et al., 1986). Table 3 is a summary
of the monitoring data for these five pesticides.
Lillie and Barnes (1987) examined 5000 homes for airborne chlordane
levels and found concentrations above 5 ug/m in 26% of the homes. The
termiticide had either been applied to the soil in homes with crawl
spaces or via subslab injection in homes built on slabs. This study
revealed that 19% of the homes with crawl spaces exceeded that 5 ug/ m
level, and that chlordane levels in the home were directly correlated to
the crawl space temperature. At the time this study was published, the
National Academy of Sciences had recommended the 5 ug/m level as an
interim guideline for the home environment.
Table 3: Concentrations of the Most Common Pesticides
3 Concentration (ug/m ) Pesticide Indoor / Outdoor
Chlorpyrifos Diazinon Chlordane
Propoxur
Heptachlor
Adapted from: Lewis et al. (1986)
2.4 0.059
1.4 0.11
0.51 0.058
0.042 0.0034
Davies et al. (1975) reported that significant exposure to DDT can
occur through house dust contamination; like chlordane and heptachlor, DDT usage has been banned in this country, however. Louis and Kisselbach
(1987) found that pesticide concentrations may vary during sampling because of temperature, humidity, and air movement caused by heating and
cooling systems.
Lead-Based Paints
As discussed previously, lead-based paints often cause high lead
levels in household dust. Many studies have been undertaken to invest¬ igate lead poisoning in children, and very often lead-based paints are
responsible. The Agency for Toxic Substances and Disease Registry (1988)
estimates that about three million tons of lead remain in paint which is accessible to children in the U.S. Laxen et al. (1987) examined
blood-lead levels and blood-lead levels in household dust, and found a significant relationship between the two. Dust-lead levels ranged from 48 to 13,600 ug/g, with a median of 503 ug/g, while blood-lead levels ranged from 3.3
to 10.7 ug/dl with a median of 10.1 ug/dl. They also found that the
highest airborne dust-lead levels were due to redecoration activities during the year before sampling. Clark et al. (1985) compared lead levels in different types of housing in Cincinnati, Ohio. They found that lead content of interior surface dust was the lowest for public and
rehabilitated housing (350 and 623 ujg/g, respectively) and highest for
older private homes in dilapidated and deteriorating condition (2200 and
3000 ug/g). Even private nonrehabilitated homes which were judged visually to be in satisfactory condition had lead levels of 1410 ug/g.
The NAAQS for lead is currently 1.5 ug/m (quarterly average), and
there is no U.S. standard for lead in dust. Laxen et al. (1987)
recommended that a lead-dust level be established in the Netherlands, and
calculated a standard of 1020 to 1750 ug/g based on comparison with the
U.S. ambient air standard.
Ter Haar and Aronow (1974) measured lead levels around the perimeter
of brick and frame homes in Detroit, Michigan. They found the average soil-lead concentration near brick homes ranged from 351 to 595 ppm
within 2 feet of the house, and 156 ppm in the front yard (nearest to the street) and 200 ppm in the back yard. The lead in dirt within 2 feet of
frame houses averaged over 2000 ppm, and front and back yard levels
averaged 436 ppm. The authors concluded that exterior paint rather than
vehicle exhaust was the source of high soil-lead levels.
Automotive Pollutants
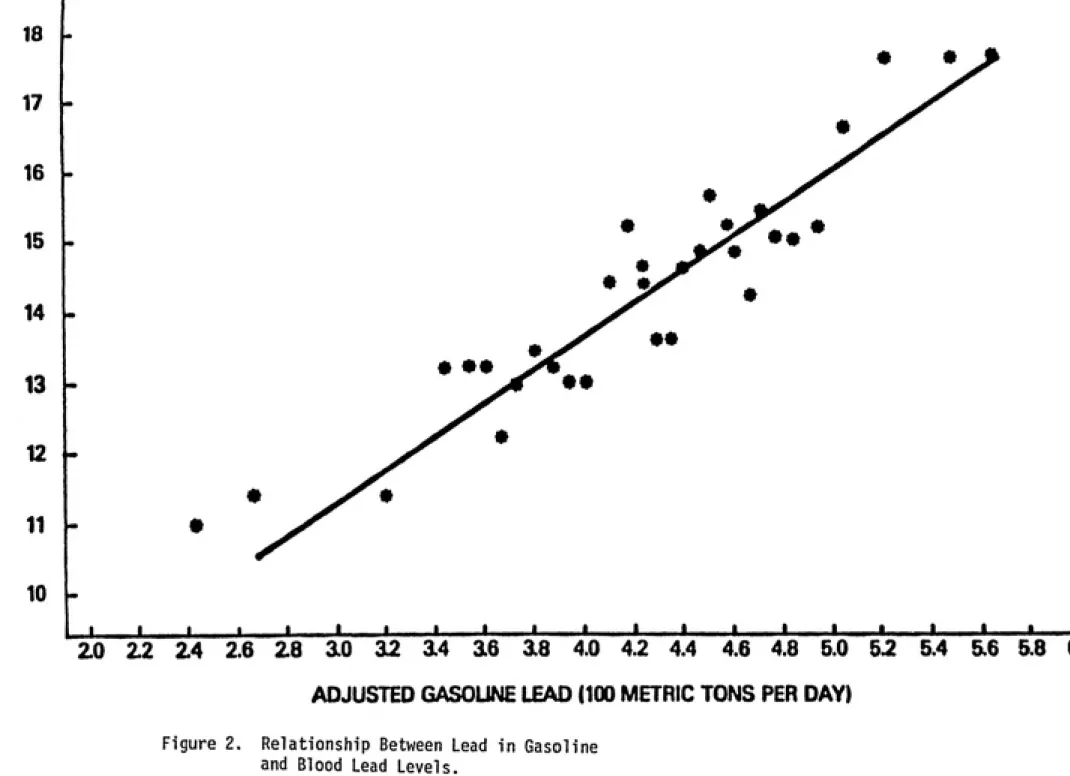
Interior and exterior paints have not always been the main source of indoor lead concentrations. The U.S. Environmental Protection Agency lowered the acceptable lead level in gasoline on the basis that there was
a strong relationship between leaded gasoline use and blood-lead levels. Figure 2 represents the EPA's interpretation of the second National
Health and Nutrition Examination Survey data. The EPA then promulgated
standards to reduce the lead content of gasoline (F.R., 1982, October 29;
F.R., 1985, March 7). The U.S. EPA (1986) stated that ambient air lead
3 3
levels have declined from 1.23 ug/m in 1975 to 0.36 ug/m in 1984.
Lynam et al. (1983) found that overall mean blood-lead levels decreased
37% during this period, from 15.8 to 10.0 ug/dl. The ATSDR (1988) report
concluded that past gasoline lead inputs produced airborne lead that
significantly added to blood lead by direct and indirect routes, and that
18
17
16
16
o
o
s
CD 14
3 13
-12
V-11
10
20 22 24 2.6 28 10 12 14 16 18 4.0 4.2 4.4 4.6 4.8 5.0 52 5.4 5.6 5.8 aO
ADJUSTED GASOUNE LEAD (100 METRIC TONS PER DAY)
Figure 2. Relationship Between Lead in Gasoline
and Blood Lead Levels.
Source: U.S. EPA (1985).
The infiltration of ambient air pollutants may also result in increased exposures to other automotive pollutants, such as diesel fuel emissions, nitrogen oxides, carbon monoxide, and benzene. Holmberg and Ahlborg (1983) estimated the emissions from automotive sources as shown
in Table 4. The particles emitted from this source are small, usually
less than 2 um in size. Diesel engines emit particles an order of
magnitude higher than regular catalyst-equipped engines.
Radon
Radon enters dwellings primarily through soil gas or water. Indoor
3
levels of radon measured range from 500 to 2 million pCi/m (U.S. EPA, 1987). The presence of radon in the soil beneath a structure varies
according to the geological formations in the area. High radium levels and porous soil or fractured rock structures facilitate the movement of radon and its progeny through the soil, while foundation cracks and
negative pressure gradients move the gas into the dwelling (U.S. EPA, 1987). Some well water supplies are also known to be high in radon, but
most are estimated to have radon concentrations of less than 2000
pCi/liter (U.S. EPA, 1987). Walsh et al. (1984) report some wells with
radon levels exceeding 100,000 pCi/liter, however. Radon present in
well-water supplies is distributed to the indoor air when it is heated or divided into small droplets, as in showering.
Environmental Tobacco Smoke
Environmental tobacco smoke contributes many compounds into the
indoor environment, including nicotine, particles, PAHs (including
B(a)P), benzene, formaldehyde, nitrogen oxides, and carbon monoxide (Samfield, 1985; Repace, 1982; Girman et al., 1982). Up to 3800
compounds have been detected in sidestream smoke (emitted from the
Table 4. Automobile Emissions
Pollutant Leaded_____Unleaded Diesel
Particles (mg/km) 50-100 5-10 750-1500
Benzene (mg/km) 50-100 1-15 10-20
Formaldehyde (mg/km) 20-50 1-3 10-15
Benzo(a)pyrene (ug/km) 1-10 0.1-1 1-10
PAH (ug/km) 35-170 3 500-1000
Adapted from: Holmberg and Ahlborg (1983)
exhaled by the smoker (mainstream smoke). Of great concern from a health
standpoint is the respirable particulate matter (RSP) which may reach very deep into the lungs of an exposed person. Respirable particulate
matter is made up of particles which have a mean mass diameter of 2.5-3.5
microns or less. Samfield (1985) conducted a literature review of the
available information on ETS, and concluded that if cigarette smoking is excluded, the respirable particulate matter found indoors is largely
influenced by outdoor levels. Spengler et al. (1981) measured
concen-3
trations (annual mean) of RSP outdoors (21.1 ug/m ), indoors with no
3 3
smoking (23.4 ug/m ), indoors with one smoker (36.5 ug/m ), and indoors
3 with two smokers (70.4 ug/m ).
The following table gives emissions and concentration data available
for a few compounds contained in environmental tobacco smoke (Table 5).
Air dilution can greatly change the makeup of ETS, and a high degree of
dilution can reduce particles from 500 mg/m to very few (NRC, 1986).
dioxide (NRC, 1986). Burning temperature, type and blend of tobacco, the
presence of substitutes or additives, cigarette length, and use of
filters will also affect the chemical composition of environmental
tobacco smoke (Esmen, 1985).
Table 5. Environmental Tobacco Smoke Pollutant Concentrations
Pollutant CO Respirable Particles Total Suspended Particulates Concentration 8.3 mg/cigarette (sidestream) 10 rag/cigarette (sidestream)
901-1318 ug/mg tobacco
NO,
NO,
Benzene
Formaldehyde
B(a)P
(compared to 6.23 w/ no smoker present)
3
21.3 ug/m (winter) (compared to 17.5 w/
no smoker present) 3
16.5 ug/m (summer) (compared to 12.4 w/
no smoker present)
12-48 ug/cigarette (mainstream) 70-100 ug/cigarette 20-40 ng/cigarette (mainstream) Reference Sandia National Laboratories (1982) Girman et al. (1982)
Lewtas et al. (1987)
Nicotine 1.6-2.4 mg/g tobacco Lewtas et al. (1987)
Nicotine
5-50 ug/m^
NRC (1986)N0„ 7.31 ug/m Leaderer et al. (1987)
Good et al. (1982)
Good et al. (1982)
NRC (1986)
The information presented in this section vill consist of the
available dose-response information for individvtal indoor air pollutants,
and when available, information for pollutant mixtures will be given.
This pollutant mixture information will be of value because it will
alleviate the need to assume an additive or synergistic relationship
between pollutants. Dose-response information is not available, however,
for the majority of indoor air pollutants.
Combustion Appliance Pollutants
The primary mechanism by which carbon mono side causes damage is via
its interference with oxygen transport by binding to hemoglobin (U.S.
EPA, 1984b). This results in less oxygen being released to tissues,
which is especially harmful to organs with high oxygen demand, such as
the brain and the heart (U.S. EPA, 1987). Neurological effects range
from behavioral alterations to coma (Dolan, 1985; Ginsberg, 1985), and
there is empirical evidence to suggest neurobeh^avioral function
decrements at COHb levels below 5% (U.S. EPA, 1984b). Cardiac effects
include arrhythmias and myocardial infarction (Dolan, 1985). Exposure to
25 ppm CO for extended periods of time (1 to 8 hrs) results in
carboxy-hemoglobin (COHb) levels of 2-3% among nonsmokers. This level of COHB
results in decreased exercise and work capacity. The population
especially at risk from CO exposure is chronic angina patients (U.S. EPA,
1987). The U.S. EPA (1984b) states that frequency and duration of angina
attacks increase at 2.9 to 4.5% COHb, and may occur at even lower COHb
people with severe respiratory diseases, chronic bronchitis, and
emphysema. People with congestive heart failure, anemia, or those taking
drugs which depress the central nervous system are also at greater risk
(U.S. EPA, 1984b).
Exposure to NO^ at levels greater than 3.7 ng/m for less than 2
hour exposures causes pulmonary function changes in healthy subjects
(U.S. EPA, 1982a). Bylin et al. (1985), however, found pulmonary
3
function changes at 0.4 mg/m . Asthmatics have been identified as a
susceptible subpopulation, and the U.S. Department of Energy (1986)
3
states that exposure for 15 minutes to 0.5 to 5.0 mg/m will increase
airway resistence in asthmatics. The DOE (1986^ also indicated that in
3
healthy individuals, exposure for 15 minutes at 7.5 to 9.4 mg/m will
decrease pulmonary diffusing capacity, and exposure for 5 minutes to 11.3
3
to 15.2 mg/m will increase airway resistance iu both asthmatics and
healthy adults.
The effects seen in gas stove epidemiologi: studies are presumed to
be due to NO^. Melia et al. (1979) studied schaol children exposed to
gas stove emissions as compared to children living in homes with electric
stoves, and found a higher prevalence of bronchitis, coughing, and colds
going to the chest in the children in homes with gas stoves. Speizer et
al. (1980) found an association between serious respiratory illness
before the age of two in children in homes with gas stoves. The NO2
levels measured ranged from 14.7 to 54.3 ug/m , with one short term peak
of 1100 ug/m^ in a kitchen. Ogston et al. (1985) studied the effects of
gas stove emissions on infants and found no as;5ociation with illness or
hospitalizations, but Ekwo et al. (1983) studied children ages 6-12 and
found a significant relationship beween gas stove usage and hospital¬
emissions have not found any significant increaises in acute respiratory
illnesses (U.S. EPA, 1987). The U.S. EPA (1987) concluded that although
the health effects information may be inconclusive, N0„ is likely to have additive or synergistic effects with other indoor pollutants, and the NO- levels observed in some homes can decrease pulmonary function inasthmatics.
The effects of sulfur dioxide alone (not associated with particles)
are most serious in asthmatics, and at 0.75 ppm asthmatics will
experience a doubling of airway resistance (Horstman et al., 1986). The effects of particles include irritant effects, altered mucociliary
transport, changes in alveolar macrophage activity, airway constriction, decrements in lung function, and increased respiratory infection in
children (U.S. EPA, 1987). The health effects of soot are primary due to
the attached polycyclic aromatic hydrocarbons (PAHs). Soot has been
found to be mutagenic in short-term bioassays, and some of the attached
PAHs are known to be carcinogenic, such as the dinitropyrenes which have been found in the emissions of kerosene heaters (Tokiwa et al., 1985). Occupational studies with coal soot show an increased risk for lung,
larynx, and skin cancer (U.S. EPA, 1987). Grotps especially sensitive to
S0„ and particulate matter exposures are asthmatics, the elderly, and
those with preeexisting cardiovascular or respiratory diseases (U.S. EPA,
1986c).
The air sampled from homes with wood stov«;s in use has been found to
have more mutagenic activity than the air taken from homes without wood
stoves (Lewtas, 1985), and wood smoke has also been found to contain some
compounds which are known carcinogens. Benzo(.i)pyrene is an example (U.S.
DHHS, 1985). Calle and Zeighami (1985) estimate that exposure for life
Other PAHs act as procarcinogens and cocarcinogens.
Formaldehyde
Formaldehyde exposure causes irritation of the mucous membranes of the eyes and upper respiratory tract (U.S. EPA, 1987). The following table shows the dose-response information for acute exposures (Table 6).
Formaldehyde is a known animal carcinogen and causes chronic reductions of lung function and asthma in humans (U.S. EP/,, 1987). Formaldehyde is
thought to cause allergenic responses in 8% of the population (U.S. EPA,
1987).
Asbestos
Asbestos is a known human carcinogen which causes lung cancer and mesothelioma, the two most important causes of death due to asbestos exposure (Nicholson, 1986). Mesothelioma is a rare cancer of the
membrane which lines the chest and abdomen. Asbestos also causes
asbestosis, a non-cancerous respiratory disease?, and cancers of the gastrointestinal tract. It is thought at this time that chrysotile is
not as likely to cause lung tumors as some of the other forms of
asbestos, particularly amosite and crocidolite (Nicholson, 1986).
Chrysotile is important as a cause of mesothelioma, however. In general, the effects of asbestos exposure are not apparent for up to 20 years following exposure.
Biological Contaminants
Because indoor environments are contaminated with a great number of
biological contaminants, this discussion will Focus on those for which
some type of health effects information is available and those which are
likely to be encountered in the types of housing which are available for
low income families. Fungi are most commonly associated with allergenic
Table 6. Formaldehyde Dose-Response Information 3,
Concentration (mg/m ) 0.06-1.2
0.01-1.9 0.1-3.1
2.5-3.7
5-6.7
12-25
37-60
Estimated Median 0.1
0.5 0.6
3.1 5.6
17.8
37.5
60-125
Reported Effects
Odor threshold for 50% of people
Eye irritation threshold Throat irritation
threshold
Biting sensation in the nose, eye Tearing eyes, long
term lung effects Tolerable for 30 minutes
with strong flow of tears for one hour Inflammation of lung
(pneumonitis), edema,
respiratory distress,
danger to life
Death
Adapted from: Lucier and Hook (1984)
EPA, 1987). Other fungi, however, produce potent mycotoxins which may be carcinogenic (e.g., aflatoxin), mutagenic, affect immunosuppression,
or act as nephrotoxins, heptatoxins, or neurotoxins (U.S. EPA, 1987).
Airborne molds which are known to be toxigenic include Aspergillis,
Penicillium, Fusarium, and Cladosporium (Burge, 1985). Viruses spread through indoor environments include measles, cliickenpox, and respiratory
diseases such as colds and influenza (U.S. EPA, 1987). Tuberculosis is
caused by an airborne mycobacterium, and inhalation exposure to just one
can become airborne and cause Pontiac Fever, a flu-like syndrome, or
Legionnaires disease, an often fatal pneumonia (U.S. EPA, 1987).
Platts-Mills and Chapman (1987) reviewed the health effects information on house dust mite allergens, and found that they can contribute to
asthma, perennial rhinitus, and atopic dermatitis. Mites of the
genus Dermatophagoides produce the most common allergen, and there is a
high prevalence of mite allergy in asthmatics. Mathison et al. (1982)
states that aeroallergen-provoked asthma is moie of a problem for
children and young adults than for other adults. Korsgaard (1983)
estimates that 100 mites/gram of dust is the risk factor for sensi¬
tization and the development of asthma.
The National Health Education Committee (1976) states that viruses
and bacteria which cause pneumonia, influenza, and other respiratory diseases are the fifth leading cause of death in the U.S., and the most
important cause of acute disabling illnesses. Pesticides
The health effects information for the pej;ticides of interest in low
socioeconomic housing units is generally from oral and dermal toxicity
studies. This discussion will evaluate the available inhalation studies, and where information is lacking the oral LDi-- and acceptable daily
intake (ADI) information will be given.
Most organophosphate compounds are irreversible acetylcholinesterase
inhibitors. Berteau and Been (1978) report an inhalation LDcg °^ ^^ ""8
chlorpyrifos/kg for mice. The World Health Orjjanization (1973) concluded
that chlorpyrifos had no reproductive or teratogenic effects in rats, nor
was any effect found in mice given 10.0 mg/kg/lay orally. Like most of
the organophosphate pesticides, chlorpyrifos aid diazinon consistently
Escherichia coli, with and without activation. Diazinon did not increase
the number of chromosomal aberrations or induce sister chromatid
exchanges (U.S. EPA, 1988). The many chronic and subchronic feeding
studies with organophosphates have not shown any carcinogenic activity.
The primary effects of these compounds on humans is neurotoxicity. The
initial symptoms of acute exposure are intestinal cramps, tightness
in the chest, blurred vision, sweating, headache, and diarrhea (U.S. EPA,
1988). The second stage of intoxication results in symptoms of weakness,
fatigue, cyanosis, and tremors. The oral risk reference dose for
chlorpyrifos in humans is 0.003 mg/kg/day (U.S. EPA, 1988). Studies of
3 3
workers exposed to up to 27.6 ug/m and diazinon up to 41.0 ug/m
indicate a significant inhibition of plasma cholinesterase but not red
blood cell cholinesterase (Hayes et al., 1980). The EPA (1984) found that
diazinon's no-observed-effect-level (NOEL) was 0.9 ug/kg bw/day. Murphy
(1986) gives an ADI of 0.002 mg/kg for humans.
A retrospective study of workers exposed to the chlorinated
insecticides chlordane and heptachlor by Wang and MacMahon (1979) found
no increase in deaths due to cancer, but found an increase in deaths from
cerebrovascular disease. Murphy (1986) reviewed the oral LD_(^ toxicity
information for various pesticides, and listed heptachlor's oral LDr/> is
100 mg/kg, with an ADI of 0.0005 mg/kg/day for hiimans. The oral LD_q for
chlordane is 335 mg/kg for male rats, and the ADI is 0.001 mg/kg/day.
Murphy (1986) also lists chlordane and heptachlor as pesticides reported
to have effects on host defense mechanisms. Propoxur (Baygon) was listed
with an oral LD^q of 83 mg/kg for male rats.
Lead
The Agency for Toxic Substances and Disease Registry (1988) recently
information will be summarized here. The groups especially at risk for lead poisoning are fetuses and young children. Young children are at risk because of their developmental physiology and their frequency of contact with lead contaminated objects. Children ingest and absorb a larger amount of lead per unit body measure and retain a larger fraction than adults. Children also have higher metabolism and respiration rates to enhance lead uptake. Fetuses are at risk because lead is readily transferred across the placenta. The primary target for toxicity is the brain or central nervous system. Other targets are the heme-forming
system and the vitamin D regulatory system. Lead exposure is often
characterized by concentration of lead in blood (ug/dl), and 10-15 ug/dl
is associated with the onset of effects which may be biomedically
adverse. Lynam et al. (1983) found that the indicated response of
blood-lead concentration to inhaled air lead is about 1 ug/dl per 1
3
ug/m . The ATSDR (1988) report gives the following dose-response information (Table 7). One factor of great importance when evaluating
lead toxicity is its accumulation in the body. Low exposure levels can cause lead to build up significantly over time, with resulting injuries to the central nervous system of children which are irreversible. Some of the effects of lead exposure may be reversible, such as the effect on heme biosynthesis, but these effects can only be alleviated if exposure
is discontinued. In the case of low income families, this may not occur.
Automotive Pollutants
The health effects associated with automotive pollutants will
include the effects already discussed for carbon monoxide, nitrogen
oxides, lead, formaldehyde, PAHs, and particles. In addition, benzene
and diesel emissions may have substantial health effects if encountered
Table 7. Dose-Response Information for Blood-Lead Levels
Pb-B (ug/dl) 10-15 (prenatal
and postnatal)
Health Effect
Reduced gestational age and weight at birth, neurobehavioral and growth deficits, reduced
size up to age 7
15-20
25 and below 30
40 and below 40
40-•80
Adverse impacts on heme biosynthesis, and vitamin D and calcium synthesis
Deficits in IQ scores in children, slowed
reaction time
Slowed nerve conduction velocity
Peripheral nerve dysfunction in children
Reduced hemoglobin synthesis
Peripheral neuropathy and frank anemia
80 80-100
Severe poisoning (coma, convulsions, mental
retardation, death)
Encephalopathy
Adapted from: ATSDR (1988)
the health effects of auto emissions and found that gasoline emissions
contain much less nitrated PAHs (e.g. dinitropyrenes) than diesel
emissions. Both gasoline and diesel emissions caused mutations in
short-term bioassays. Gasoline extracts were found to be more mutagenic
than diesel extracts, but diesel engines emit more particles and
associated organic matter. The organics from motor vehicle emissions
contain known human carcinogens, and there is evidence to support a
Radon
The health effect associated with radon exposure is an increased
risk of lung cancer (U.S. EPA, 1987). The EPA (1986a) predicts that 5000
to 20,000 lung cancer deaths per year are due to radon exposure, and the EPA has established a recommended "action" level of 4 pCi/1 (0.02 working
levels) in homes (U.S. EPA, 1986a). The EPA estimates that exposure to 4 pCi/1 for 70 years will result in between 1 and 5 lung cancer deaths out
of 100, while exposure to 200 pCi/1 is estimated to cause between 14
and 42 deaths in 100.
Environmental Tobacco Smoke
Many pollutants are contained in environmental tobaccco smoke, as discussed in Section III. This discussion will focus on the whole mixture
of ETS, rather than each individual compound. Eye, nose, and throat irritation are the most common acute effects of ETS (U.S. EPA, 1987).
Reviews by the EPA (1987), Schenker et al. (1983), and Ware et al.
(1984), among others, have found a strong correlation between ETS and the
occurrence of lower respiratory tract illness in children. Increased
frequency of bronchitis, pneumonia, and other respiratory symptoms have also been found in children during the first year of their lives (U.S. EPA, 1987). The health effects in adults are not as well established as
those in children, but the NRC (1986) and the Surgeon General (1986) both concluded that epidemiologic studies indicate an association between
involuntary smoking and lung cancer. Repace and Lowrey (1985) estimate
that 5000 lung cancer deaths per year are due to ETS exposure. The
associations between ETS and asthma and ETS and cardiovascular disease
Although it is difficult to predict the number of people exposed to
the specific pollutant concentrations given in Section III, an estimate
can be made of the number of people potentially exposed. This information
will be gathered primarily from census data and consumer purchasing
information. An estimate can be made of the potential exposure which
low-income families receive, but as discussed previously, many factors
will influence pollutant levels, such as activity patterns, ventilation
practices, and condition of the home or the pollutant source.
Census figures indicate that there are 234.5 million people in the
U.S., and 14.4% of these individuals fall below the weighted poverty
level, that is, 33.7 million people (U.S. Bureau of the Census, 1985).
The Census Bureau uses a weighted poverty level based on the number of
family members and annual income. For a 1 person household, $5300.00 and
below is the poverty level, while for a family of 7 or more persons an
annual income of $14,000.00 is considered to be the poverty level. In
cases where specific information is not available for these low-income
individuals, it will be assumed that the same percent of low-income
individuals are exposed to indoor air pollutants as in the general
population. In many cases this may underestimate exposures because of
the factors discussed previously. In cases where the census data was
presented by household, it will be assumed that there is an average of
Beginning with combustion appliances, estimates are made of the
number of low-income Americans potentially exposed to emissions. These
estimates are derived as discussed above; 14.4% of the number of appliances in use is multiplied by an average of 2.5 persons per dwelling. The
number of kerosene heaters used by low socioeconomic status Americans is based on the estimate of 7 million kerosene heaters in use in the U.S. By examining kerosene fuel consumption patterns, it is seen that 43% of the fuel purchased is used in homes whose average annual income is less
than $10,000.00 (Energy Information Administration, 1986). An estimate
is made then, that 3 million low income families use kerosene heaters as
primary or secondary heat sources.
Gas ranges: 14 million
Gas space heaters: 2.9 million Wood stoves: 1.9 million
Fireplaces: 6.5 million
Kerosene heaters: 7.5 million
Sterling and Kobayashi (1981) evaluated the prevalence of gas stove
usage for heating and found that 55% of the homes they studied in New York City used the gas oven as a heat source. In addition to the volatile organic compound exposures which individuals receive from
material sources in mobile homes, a suprising number of kerosene heaters are used in these environments. The Energy Information Administration
(1986) estimates that one third (2.3 million) of all kerosene heaters are
used in mobile homes. Because of the factors discussed previously, this could mean that this population is exposed to very high concentrations of formaldehyde, carbon monoxide, nitrogen oxides, and particles, among others. Again assuming that there are 2.5 residents per home, an
kerosene heaters.
The NEC (1981) estimates that 11 million people live in mobile homes which contain substantial amounts of particleboard and plywood. Even if a combustion appliance is not present, these people are exposed to higher than average concentrations of volatile organic compounds, especially
formaldehyde.
An estimate of the number of people exposed to asbestos fibers will
be made solely on the basis of the number of occupied homes built before 1970. Although this estimate may include some homes which have been
renovated and had the asbestos removed, or homes in which the asbestos is intact and not friable, there is no way to estimate the number of these cases. The fact that renovation was undertaken may not mean that
asbestos exposure is decreased, as careless handling may only serve to increase the amount of airborne fibers. In the case of children exposed,
it must be kept in mind that exposure may also occur at school (Nicholson
et al., 1978). The U.S. Bureau of the Census (1985) found that 68 million homes in the U.S. were built before 1970, so an estimated 170
million people, or 72% of the population, live in homes where asbestos
insulation, spackling, cement, or floor tiles may be present. Although it may be a gross underestimation, if 14.4% of these people fall below the poverty level, then 24.5 million low-income Americans live in these
homes.
An estimate of the number of people potentially exposed to high
concentrations of biological contaminants can be made generally by
estimating the number of homes which may have favorable conditions
for their growth. The presence of old insulation and the lack of air
conditioning in humid areas of the country are examples of these
biological contaminants is the presence of cockroaches and other
insects. The U.S. Bureau of the Census (1985) lists approximately14 million homes in the South and the Northeast which do not have
central or room air conditioning. If 14.4% of these families are below the poverty level, then 2 million homes of low income Americans
have the potential for increased exposure to biological contam¬
inants. In addition to favorable conditions, the number of people
who suffer from asthma, legionellosis, and allergic rhinitis (hay fever)
can be used as an indication of the number of people who are sensitive to
biological contaminants. Mathison et al. (1982) report that asthma
afflicts 10 million Americans, and the U.S. Bureau of the Census (1985)recorded 852 cases of legionellosis (up from 654 cases in 1982). The
U.S. Bureau of the Census also reports that 19 million people suffer
with allergic rhinitis.
Although almost all Americans use pesticides both in and around
their homes, the population of concern here are those who are exposed involuntarily. This assessment will thus focus on the number of people
living in public housing tenements, where they have no control over the
frequency of pesticide application, and where the concentration of
pesticides applied probably exceeds that to which the average person is
exposed. In the U.S. there are over 3.5 million families living in
public or subsidized rental housing units (U.S. Bureau of the Census,
1985). Assuming 2.5 persons per household, there are an estimated 8.7
million people potentially exposed to high pesticide levels on a regular
basis.
The ATSDR (1988) estimates that a total of 42 million homes occupied
2
today have paint with lead levels exceeding 0.7 mg/m . The total number
this group of Americans is at the greatest risk for lead toxicity. Of these 12 million young children, 1.8 million live in deteriorating
lead-painted homes (ATSDR, 1988). They also concluded that 2.4 million children living in Standard Metropolitan Statistical Areas already have unacceptable blood-lead levels above 15 ug/dl. As expected, the ATSDR
report found that the "traditional" high-risk groups, e.g. poor,
inner-city black children, figured prominently in the outcomes. The
ATSDR (1988) evaluated blood-lead levels in children of families whose income is less than $15,000.00, and found that a total of 1.5 million
children under the age of 5 have blood-lead levels exceeding 15 ug/dl.
Exposure to high levels of automobile exhaust is estimated by the
number of low-income residents in metropolitan areas. The U.S. Bureau of
the Census (1985) states that there are over 6.6 million low-income
families living in metropolitan areas. A survey of all low-income
households shows that only 16% have central air conditioning. This
indicates that 13.9 million low-income Americans live in metropolitan
areas without central air conditioning.
The U.S. EPA (1987) estimates that 2.5 million people are exposed to radon in the U.S., thus 360,000 low-income residents have the potential for high exposure levels. This may be an overestimate due to the fact that many low income Americans may live in homes which have not been
weatherized to be airtight. The EPA (1987) also states that 124 million
people, including smokers, are exposed to environmental tobacco smoke.
If 14.4% of these people are below the poverty level, then 17.8 millionare exposed to ETS.
Although these are very crude estimates of the number of low-income
Americans exposed to indoor air pollutants, they indicate the potential
in mind when examining these estimates that multiple exposures will also occur. For example, of the homes built before 1940 in the U.S., the U.S.
Bureau of the Census (1985) found that 20% use fuel oil or kerosene as
the primary heat source, and wood or coal stoves are used in 2 million of these homes. Residents of these homes thus have potential exposures to lead-based paints, asbestos, combustion appliance emissions, and biological contaminants. As discussed in Section III, the presence of more than one combustion source results in additive exposure levels. Many indoor air pollutants also act synergistically in the health effects
they cause, such as asbestos and ETS or radon and ETS.
The information presented in this section may also be examined
by comparing the number of low income Americans exposed to these
pollutants with the number of non-low income Americans exposed. For
example, 16% of all low income households rely on kerosene heaters as a primary or secondary heat source, while only 6% of other households use these heaters. In other words, 43% of all kerosene heaters are used
by only 14.4% of the population. Gas ranges are present in 55% of all
low income residences, but are present in only 40% of other households. The ATSDR's (1988) estimate of 1.5 million low income children whose
blood-lead levels exceed 15 ug/dl (29% of all low-income children less
than 5 years old) can be compared to their estimate that 880,000 of the 8
million children from non-low income families will have blood-lead levels
Based on the information presented in Sections III, IV, and V, an estimate can be made of the magnitude of the indoor air pollution problem for the 33 million low socioeconomic status children and adults
living in this country. Because of the nature of the existing infor¬
mation, a quantitative risk characterization of the health effects from
indoor pollution is not possible. The exposure information available is rarely consistent with existing dose-response information, thus making it
impossible to make more than a qualitative estimate of the number of
low socioeconomic status Americans who will suffer the adverse health
effects of indoor air pollution. This qualitative assessment adequately describes the indoor air pollution problems faced by low income Americans,
however, and the information thus synthesized is sufficient to lead to public policy considerations, as will be discussed in Section VIII.
Table 8 summarizes the indoor air pollutant concentrations reported in various studies. It must be kept in mind that every household will have different pollutants present in different concentrations, even if
the same sources are present. Table 9 indicates the potential number of
people who may harmed in some manner by the indoor air pollutants present in their homes. As discussed previously, many of these estimates may be
gross underestimates. Low income Americans are more likely to use
combustion appliances in their homes, and these appliances may be older
and less efficient than the same appliances in middle and upper income