Sharif University of Technology
Scientia IranicaTransactions A: Civil Engineering http://scientiairanica.sharif.edu
Invited Paper
Optimum recovery time for cyclic compression tests on
bovine brain tissue
M. Mohajery and M.T. Ahmadian
Department of Mechanical Engineering, Sharif University of Technology, Tehran, Iran. Received 23 February 2019; received in revised form 9 March 2019; accepted 13 May 2019
KEYWORDS Recovery time; Preconditioning eect; Strain history; Brain tissue modeling, Bovine brain tissue.
Abstract. In conducting mechanical tests on the brain tissue, it is preferred to perform multiple tests on the same sample. In this study, we investigated the behavior of the bovine brain tissue in repeated compression tests with 6 recovery periods (namely, 10, 60, 120, 180, 240, and 300 s). Compression tests were performed on cylindrical samples with average diameter and height of 18.0 mm and 15.0 mm, respectively. Two testing protocols were employed; the rst one comprised experiments with 5, 25, and 125 mm/min loading speeds up to 33% strain and the second one consisted of tests with 25 and 125 mm/min loading speeds up to 17% strain. Each experiment was conducted in two cycles separated by a specic recovery period. Stress-strain data from the rst and second cycles were compared using 3 criteria, namely Normalized Root-Mean-Square Error (NRMSE), coecient of variation (R2), and Eective Height Ratio (EHR). The analysis suggested that the optimum
recovery periods for the rst and second protocols were 120 s and 180 s, respectively. Moreover, dierences between the rst and second cycles in medium- and high-speed tests were found to be smaller than those in the low-speed experiments.
© 2019 Sharif University of Technology. All rights reserved.
1. Introduction
Mechanical modeling has widely been used to study the behavior of human brain in dierent circumstances such as Traumatic Brain Injury (TBI) [1-4] and tu-mor growth [5,6]. Material properties of brain tissue critically aect the accuracy of simulations. Despite numerous studies aiming at characterizing mechanical properties of the brain tissue, there is still consider-able variation between results (for more information, see [7,8]). Part of the discrepancy between studies can be ascribed to the absence of a standardized testing
*. Corresponding author. Tel.: +98 21 66165503; Fax: +98 21 66000021
E-mail addresses: [email protected] (M. Mohajery); [email protected] (M.T. Ahmadian) doi: 10.24200/sci.2019.21418
protocol. Generally, mechanical testing protocols for the brain tissue can be classied into two groups: First, experiments in which only one loading cycle is performed on each sample [9-13]; and second, studies that perform multiple tests (of one or various types) on each sample to eliminate inter-species variation and/or to assess the eect of preconditioning on the brain tissue [14-18]. The second group can be divided into preconditioned and non-preconditioned protocols. Preconditioning cycles are often performed on samples in order to obtain statistically even data and improve reproducibility [19]. However, there is still controversy over the validity of preconditioned data for some circumstances such as TBI [20]. In non-preconditioned protocols, there is a recovery period between loading cycles, which allows the tissue to recover from the specimen \memory;" this eect results from tissue viscoelasticity and prevents the sample from resetting to its reference state. Using non-preconditioned
proto-However, their study did not specify the time in which recovery was achieved. Dommelen et al. [16] investigated the minimum recovery time for both gray and white matter. Indentation tests with spherical indenter 2 mm in diameter were performed. The recovery time of 50 s was found to be adequate for both white and gray matter. However, no details about data comparison, criteria, and the number of tests were reported. Prevost and Balakrishnan [28] found that brain samples recovered their original response after 2 h rehydration period. In another study, Prevost et al. [29] performed cyclic indentation tests in-vivo, in-situ, and in-vitro on porcine brain tissue. They suggested that tissue could recover from preconditioning eect when allowed to rest for 2 minutes. Nonetheless, the criteria used in their study were only peak forces and the heights of initial and nal cycles. Hence, the dierences between data points of the initial and nal states were ignored. Most recently, Budday et al. [14] observed that the brain tissue would show the same stress-strain pattern after 60 min recovery period. However, their nding is just an observation and cannot be used as a reference for recovery time. The objective of this study is to assess the optimum recovery time for the bovine brain tissue. Furthermore, we aim to study the variation of the recovery time concerning strain level and rate.
2. Materials and methods 2.1. Sample preparation
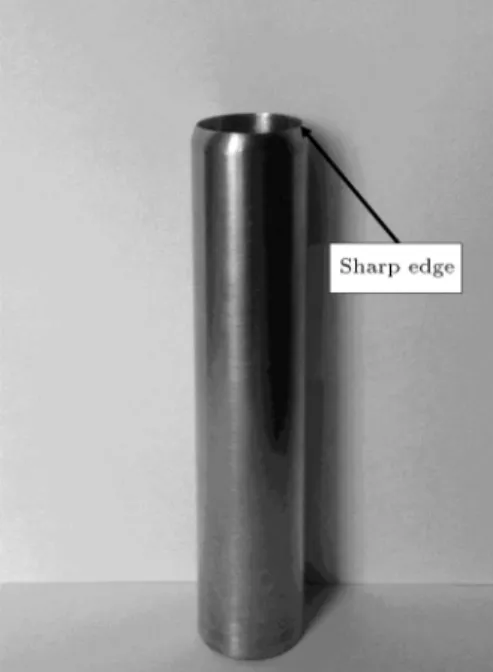
Fresh bovine brains were obtained from a local slaugh-terhouse. The reason behind choosing bovine tissue was availability and lowering of post-mortem hours. Six intact brains were placed in ice-cooled Phosphate Buered Saline (PBS) in order to prevent dehydration and degeneration. Brains were rst split into the right and left hemispheres from sagittal plane. A steel pipe with the inner diameter of 22 mm was used for sample acquisition. Figure 1 shows the cutting tool. The samples were excised from all sites of the brain to cover a wide range of tissue properties. Thereafter, each cylindrical specimen was cut to the height of 15 mm.
Figure 1. Cylindrical cutting tool. A stainless steel tube with inner and outer diameters of 22 mm and 25 mm was sharpened at one end. Samples were excised by rotational movement of this tube.
Despite using a cutting tool with xed dimensions, specimen diameter ranged between 17 to 21.5 with a mean diameter of 18:0 1:2 mm. The discrepancy between the cutting tool and specimen diameter was mainly because of the tension exerted on the surface of the tissue during the process of sample excision. This tensile force induced stretch in the tissue surface. Immediately after excision, surface area was reduced to its original state. Certain features were dened to distinguish high-quality samples form low-quality ones:
Arachnoid membrane should be intact on the bot-tom surface of the sample (cerebral cortex). This criterion assures that sulci will remain unchanged during the test and will not cause a sudden change in dimensions of the specimen;
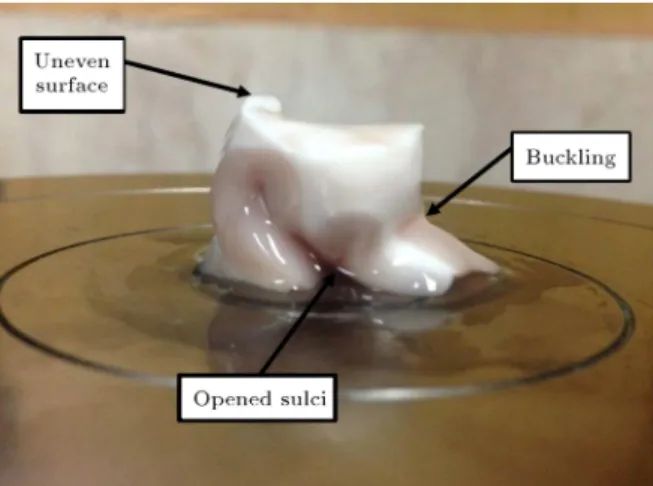
Top and bottom surfaces of the sample (i.e., ven-tricle and cerebral cortices, respectively) should be at and even. The concave surface would result in unfavorable adhesion to plates. Moreover, uneven surface will increase the possibility of buckling. A sample with common aws is depicted in Figure 2.
Overall, 40 samples were obtained from 6 brains. Compression tests proceeded by measuring sample diameter individually. Measurements were done at the top, middle, and bottom of each sample and average diameter was used for further calculations. Generally, the diameter of the top and bottom surfaces varied by approximately 3-4 mm. Hence, samples were in the form of a truncated cone instead of a cylinder. Unconned boundary condition was achieved by uti-lization of lubricant on both upper and lower plates.
Figure 2. Common defects of a low-quality sample. Sulci opening causes dramatic changes in diameter and height. Uneven surface leads to asymmetric force distribution, which may in turn increase the possibility of buckling.
Figure 3. Sample placement in the testing machine. Upper and lower plates of the testing machine were lubricated before the experiment to provide unconned boundary condition.
This step was especially important for preventing the barreling eect. Finally, each specimen was taken out of ice-cooled PBS solution and placed between plates as shown in Figure 3.
2.2. Experimental set-up
The main apparatus for conducting tests was a Zwick/Roell Z050 universal testing machine. It was equipped with a servomotor, which could provide the loading speed of 0.001 to 2000 mm/min. A 5 kgf load cell was mounted on the machine, allowing the force measurement between 0.001 to 50 N. The Zwick/Roell Windows-based software had the capacity to conduct programmed tests. Hence, there was no need for manual set-up for every sample and the results were improved by reducing testing time.
2.3. Test procedure
Two testing protocols were organized to cover 6 recov-ery times at 2 strain levels. Protocol 1 consisted of
Figure 4. Schematic of the testing protocol. Recovery periods included 10, 60, 120, 180, 240, and 300 s.
tests with loading speeds of 5, 25, and 125 mm/min (0.005, 0.025, and 0.125/s strain rates, respectively). Testing speeds for Protocol 2 were 25 and 125 mm/min. The separation between parallel plates of the testing machine was xed to 15 mm, and it was set up to have displacements of 5 and 2.5 mm for Protocols 1 and 2 (33% and 17% strains), respectively. However, the height of samples was generally slightly less than 15 mm. Therefore, test results deviated from the nominal strain level. Schematic of the testing protocols is illustrated in Figure 4. Recovery periods were 10, 60, 120, 240, and 300 s. By the time the test started, the lower plate had moved up with constant speed and compressed the tissue up to the pre-set displacement. Immediately, it began coming down with the same speed. After the recovery period was passed, an identical cycle started automatically.
From the 40 samples excised from brains, 10 samples were recognized as low-quality. Furthermore, 2 samples failed during the tests and were eliminated. All tests were conducted in the room temperature ( 24C) and within the 28 h postmortem.
2.4. Data analysis
To nd the optimum recovery time, dierences between the rst and second cycles should be assessed. Com-parison between the two cycles was performed using the following criteria:
Eective Height Ratio (EHR):
EHR =LL(2)(1) 100: (1) L(i) stands for the length of the ith cycle. The
length of each cycle is measured by reading the rst force having the order of mN. This parameter demonstrates the amount of residual deformation. Higher EHR values indicate that the tissue has recovered its reference height. Moreover, residual deformation values were calculated for more details;
important since samples are obtained from various parts of the brain and have dierent maximum stress values.
Coecient of determination (R2):
R2= 100
0 B @1
Pn
i=1
(1)i (2)i 2 Pn
i=1
(1)i 2 1 C
A : (4) The and (k)signs stand for the mean stress value
of the rst cycle and normal stress of the kth cycle, respectively.
Unlike the criteria used by Prevost et al. [29], the aforementioned criteria assess not only the nal-state dierences (such as EHR), but also similarities between all data points. Hence, the comparison between the rst and second cycles will be comprehensive.
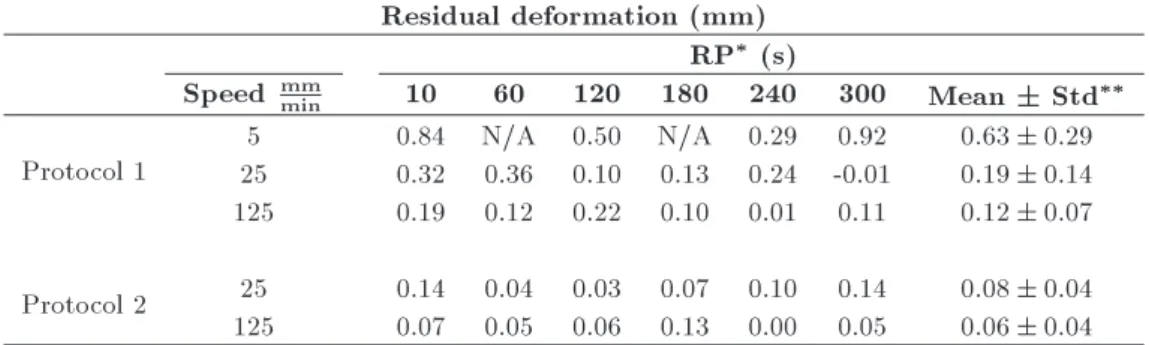
180 s recovery periods from Protocol 1 demonstrated signs of sulci opening and slip. Therefore, their test data was excluded. High strain level experiments (Protocol 1) tended to have smaller EHR values than low strain tests (Protocol 2). Moreover, a signicant increase in the EHR was observed as the loading speed increased from the speed of 5 to 25 mm/min in Pro-tocol 1 (Figure 7(a)). In contrast, the EHR values in Protocol 2 were recognized to have negligible variation (Figure 7(b)). The values of residual deformation are shown in Table 1 in more details.
NRMSE variation for Protocol 1 is illustrated in Figure 8(a). Generally, testing speed had a reverse relationship with the amount of normalized error. This result implies that low-speed tests need more time to recover. NRMSE reached its minimum after 180 s for Protocol 1. The response of tissue to dierent
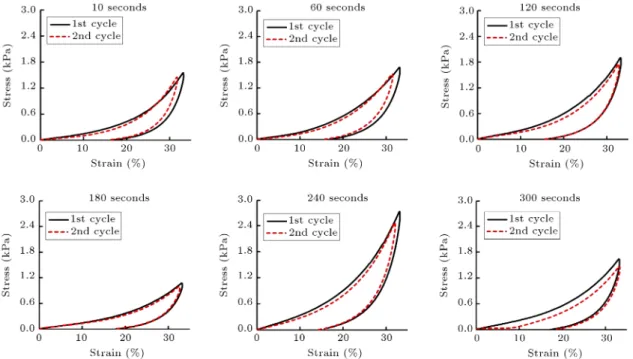
Figure 5. Stress-strain curves for the loading speed of 25 mm/min in Protocol 1. Plot titles indicate the recovery period. Both curves for the rst and second cycles are adjusted to begin from 0% strain level. Hence, the second cycle is
compressed to a lower level of strain due to the presence of residual strain. Despite the closeness of the stress values for the rst and second cycles in the initial and nal parts of the curve, they are mainly separated in middle parts.
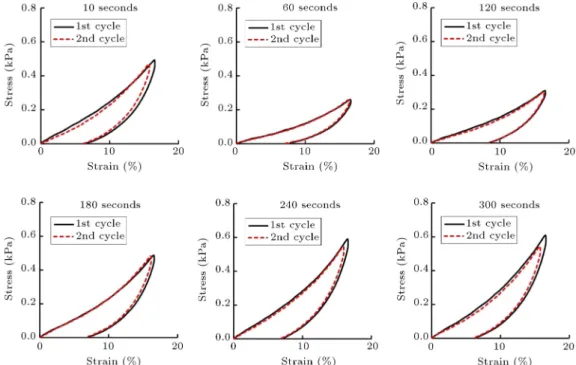
Figure 6. Stress-strain curves for the loading speed of 25 mm/min belonging to Protocol 2. Plot titles indicate the recovery period. Curves for the rst and second cycles are close to each other compared with those in Protocol 1.
Figure 7. EHR variation for: (a) Protocol 1 and (b) Protocol 2. Generally, the amount of EHR increases with the rise of the loading speed from 5 to 25 mm/min for Protocol 1. Residual strain for Protocol 2 appears to be slightly lower than that for Protocol 1.
recovery times in Protocol 2 regarding NRMSE is shown in Figure 8(b). It can be considered as upward concave with its minimum at 120 s. Long recovery periods appeared to paradoxically increase error for
Figure 8. NRMSE values for: (a) Protocol 1 and (b) Protocol 2. Overall, the amount of error decreases as the testing speed increases from 5 to 25 mm/min for Protocol 1. The minimum error values occur at 120 and 180 s recovery times for Protocols 1 and 2, respectively.
both protocols. This phenomenon implies that long recovery periods outside PBS solution would have a signicantly negative eect on the tissue behavior.
: Recovery period;: Standard deviation.
Figure 9. R2 values for: (a) Protocol 1 and (b)
Protocol 2.
an upward convex curve with its minimum at 180 s for Protocol 1 (Figure 9(a)). Nonetheless, R2 curve for
Protocol 2 reached its maximum after 120 s recovery period (Figure 9(b)).
4. Discussion
This study investigates preconditioning eect and the impact of recovery time of compression tests on the bovine brain tissue. Two testing protocols were pro-posed to cover several recovery periods, strain rates, and strain levels. Primary interests of this study were, rst, determination of the recovery time enough to assure negligibility of the \memory" eect, yet small enough not to aect test results negatively by elongating the experiment; and second, investigating
the dependency of recovery time on the strain rate and strain level. The experimental results of this study indicated that for dierent testing conditions, various recovery periods should be implemented. However, further investigations into this subject are required to make the testing protocols converge, aiming to study mechanical properties of the brain tissue. The current study has some limitations that can be categorized as follows:
1. Testing protocols included only one mode of defor-mation (unconned uniaxial compression);
2. Samples were a combination of white and gray matter. Consequently, due to the weak connection between the white and gray matter of the brain, the possible separation of these two tissue types under compression might have caused discrepancies in the test data [30]. Furthermore, samples were selected randomly from dierent sites of the brain. Hence, results of this study can be used as an average value for the recovery period;
3. Due to the presence of sulci, measurements may have been aected by the local opening of sulci (samples were examined before the test to avoid aws. Moreover, test data with patterns indicating sulci defect were excluded);
4. Local adhesion of the top surface of the sample (which was white matter) might have changed the response of tissue during unloading (top and bot-tom plates were continuously lubricated to reduce the adhesion);
5. Uneven top surface of the sample may have dis-turbed data acquisition (top face was smoothened by a surgical ap to avoid concave/rough surface). Brain samples were observed to undergo me-chanical softening after the rst cycle (see Figures 5 and 6). This behavior has been reported in the literature [14,20]. Moreover, it can be observed that
even though the initial and nal parts of the stress-strain curves for the rst and second cycles are close to one another, they are separated in middle parts. Hence, the criteria that consider only the initial and nal dierences of the two cycles may result in mis-leading interpretation of the suitable recovery period. Therefore, the criteria based on all data points are recommended.
According to the results of this study, residual deformation decreases as the testing speed increases (see Table 1). Prevost et al. [29] reported the same trend for 2 min recovery period with in-vitro experi-ments. Moreover, residual deformation values between the two studies are close to each other. EHR values for Protocol 1 demonstrate high dependency on strain rate. Low strain rate test (5 mm/min) appeared to have signicantly smaller values of EHR than medium-and high-speed tests did (see Figure 7(a) medium-and Table 1). We surmise that this behavior can be ascribed to the diusion of interstitial uid of the samples. The longer the tissue is deformed under compression, the more uid ows outside the sample. This process may make the sample unrecoverable. Hence, an additional step should be included in the recovery process: samples should be placed in an appropriate solution to absorb the uid [28].
Generally, the mean values of NRMSE and R2for
Protocol 1 suggest that the tissue can be considered recovered after 180 s (Figures 8(a) and 9(a)) with mean NRMSE and R2of 2.5% and 99.0%, respectively.
It should be noted that we will obtain the same results for recovery time with elimination of data from experiments with loading speed of 5 mm/min. For Protocol 2, 120 s is suggested as recovery period with mean NRMSE and R2 of 1.5% and 99.5%, respectively
(Figures 8(b) and 9(b)). This nding is in contrast with the suggestion of Dommelen et al. [16]. They stated that reproducibility was achieved with 50 s recovery period. They used local indentation with the indenter diameter of 2 mm. Based on interstitial uid diusion theory [28], we believe that the results of local indentation cannot be applied to nite deformation compressive tests. Local indentation leads to a small amount of uid diusion, and the volume of uid that exits the sample is negligible and it quickly recovers. Moreover, due to the absence of data analysis, concrete discussion cannot be made. The results of this study suggest that the dierence of NRMSE and R2 between the rst and second cycles decreases with
the enhancement of testing speed, while Prevost et al. [29] stated the opposite. NRMSE and R2 values
indicate that long recovery periods out of physiological uid negatively aect the recovery process. As recovery time elongates, samples start to creep under their own weight. Moreover, inner parts of the tissue may be dehydrated, even though the surface of the tissue is
hydrated during the recovery period. Altogether, we suggest 2 min recovery time for low-strain compression ( 17%) and 3 min for high-strain compression ( 33%).
5. Conclusion
This study investigated the recovery period and precon-ditioning eect of the brain tissue. Currently, there are few studies with the primary goal in this subject. To initiate a comprehensive study, two protocols were pro-posed to assess the recovery time in various conditions. Three loading speeds (namely 5, 25, and 125 mm/min), 2 levels of strain (namely 30 and 17%), and 6 recovery times (namely 10, 60, 120, 180, 240, and 300 s) were employed. The results of this study presented optimum recovery time for each strain level. We suggested 2 and 3 min recovery times for low- and high-strain levels ( 17% and 33% respectively). The suggested values were valid for the domain of protocols used in this study. Based on the trends observed in this study, we predicted that quasi-static tests might need additional treatment (e.g., placing the sample in PBS after the rst cycle) for recovery. However, more investigations should be carried out to assess the recovery time for dierent test speeds and dierent regions/orientations of the brain tissue. Assessment of recovery time for white and gray matter separately would be of great im-portance. We believe that investigating various factors aecting testing conditions such as preconditioning, postmortem hours, and temperature would decrease the variations between the results of testing protocols. Therefore, a standard testing procedure can be created. Subsequently, consensus of the results on brain tissue properties may be achieved.
Acknowledgment
This paper is supported by INSF. References
1. Cloots, R.J.H., Van Dommelen, J.A.W., Kleiven, S., and Geers, M.G.D. \Multi-scale mechanics of trau-matic brain injury: Predicting axonal strains from head loads", Biomech. Model. Mechanobiol., 12(1), pp. 137-150 (2013).
2. Friedman, R., Epstein, Y., and Gefen, A., Trau-matic Brain Injury in the Military: Biomechanics and Finite Element Modelling BT - The Mechanobiology and Mechanophysiology of Military-Related Injuries, A. Gefen and Y. Epstein, Eds. Cham: Springer International Publishing, pp. 209-233 (2016).
3. Sahoo, D., Deck, C., Yoganandan, N., and Willinger, R. \Development of skull fracture criterion based on real-world head trauma simulations using nite
ele-6. Wong, K.C.L., Summers, R.M., Kebebew, E., and Yao, J. \Tumor growth prediction with reaction-diusion and hyperelastic biomechanical model by physiological data fusion", Med. Image Anal., 25(1), pp. 72-85 (2015).
7. Hrapko, M., Van Dommelen, J.A., Peters, G.W., and Wismans, J.S. \The inuence of test conditions on characterization of the mechanical properties of brain tissue", J. Biomech. Eng., 130(3), p. 31003 (2008).
8. Cheng, S., Clarke, E.C., and Bilston, L.E. \Rheological properties of the tissues of the central nervous system: A review", Med. Eng. Phys., 30(10), pp. 1318-1337 (Dec. 2008).
9. Miller, K. and Chinzei, K. \Constitutive modelling of brain tissue: Experiment and theory", J. Biomech., 30(11-12), pp. 1115-1121 (1997).
10. Miller, K. and Chinzei, K. \Mechanical properties of brain tissue in tension", J. Biomech., 35(4), pp. 483-490 (2002).
11. Jin, X., Zhu, F., Mao, H., Shen, M., and Yang, K.H. \A comprehensive experimental study on material proper-ties of human brain tissue", J. Biomech., 46(16), pp. 2795-2801 (2013).
12. Budday, S., Nay, R., De Rooij, R., et al. \Mechanical properties of gray and white matter brain tissue by indentation", J. Mech. Behav. Biomed. Mater., 46, pp. 318-330 (2015).
13. Rashid, B., Destrade, M., and Gilchrist, M.D. \Me-chanical characterization of brain tissue in tension at dynamic strain rates", J. Mech. Behav. Biomed. Mater., 33(1), pp. 43-54 (2014).
14. Budday, S., Sommer, G., Birkl, C., et al. \Mechanical characterization of human brain tissue", Acta Bio-mater., 48, pp. 319-340 (2017).
15. Bilston, L.E., Liu, Z., and Phan-Thien, N. \Linear viscoelastic properties of bovine brain tissue in shear", Biorheology, 34(6), pp. 377-385 (1997).
Living Tissues, 2nd Ed. New York, NY: Springer New York (1993).
20. Gefen, A. and Margulies, S.S. \Are in vivo and in situ brain tissues mechanically similar?", J. Biomech., 37(9), pp. 1339-1352 (2004).
21. Carew, E.O., Barber, J.E., and Vesely, I. \Role of preconditioning and recovery time in repeated testing of aortic valve tissues: Validation through quasilinear viscoelastic theory", Ann. Biomed. Eng., 28(9), pp. 1093-1100 (Sep. 2000).
22. Hubbard, R.P. and Chun, K. \Mechanical responses of tendons to repeated extensions and wait periods", J. Biomech. Eng., 110, pp. 11-19 (Feb. 1988).
23. Sverdlik, A. and Lanir, Y. \Time-dependent mechan-ical behavior of sheep digital tendons, including the eects of preconditioning", J. Biomech. Eng., 124(1), pp. 78-84 (2002).
24. Lanir, Y. and Fung, Y.C. \Two-dimensional mechani-cal properties of rabbit skin-II. Experimental results", J. Biomech., 7(2), pp. 171-182 (1974).
25. Vogel, H.G. and Denkel, K. \In Vivo recovery of me-chanical properties in rat skin after repeated strain", Arch. Dermatol. Res., 277(6), pp. 484-488 (1985).
26. Remache, D., Caliez, M., Gratton, M., and Dos Santos, S. \The eects of cyclic tensile and stress-relaxation tests on porcine skin", J. Mech. Behav. Biomed. Mater., 77, pp. 242-249 (2018).
27. Prange, M.T. and Margulies, S.S. \Regional, direc-tional, and age-dependent properties of the brain undergoing large deformation", J. Biomech. Eng., 124(2), p. 244 (2002).
28. Prevost, T.P., Balakrishnan, A., Suresh, S., and Socrate, S. \Biomechanics of brain tissue", Acta Bio-mater., 7(1), pp. 83-95 (2011).
29. Prevost, T.P., Jin, G., De Moya, M.A., Alam, H.B., Suresh, S., and Socrate, S. \Dynamic mechanical response of brain tissue in indentation in vivo, in situ and in vitro", Acta Biomater., 7(12), pp. 4090-4101 (2011).
30. Cheng, S. and Bilston, L.E. \Unconned compression of white matter", J. Biomech., 40(1), pp. 117-124 (2007).
Biographies
Mohamad Mohajery received his BSc in Mechani-cal Engineering from Sharif University of Technology, Tehran, Iran, in 2016. In the same year, he started his MSc in Applied Mechanics (Biomechanics Division) at the same university and graduated in 2018. His main research interests are biomechanical modeling and simulation.
Mohammad Taghi Ahmadian received an MSc
degree in Physics from Shiraz University, Shiraz, Iran, in 1972 and another MSc degree in Mechanical En-gineering from University of Kansas in Lawrence in 1980. At the same time of getting his second MSc degree, he completed his PhD in Physics in 1981 and then, received another PhD in Mechanical Engineering in 1986 from University of Kansas. Currently, he is a faculty member in the Department of Mechanical Engineering at Sharif University of Technology. His research interests are micro and nano mechanics as well as bioengineering.