Neighborhood Characteristics and Influenza
Vaccination Rates in Medicare Beneficiaries over age
65 years:
A Study of North Carolina Residents
By
Edward Bridgeford
A Master's Paper submitted to the faculty of The University ofNorth Carolina at Chapel Hill
In partial fulfillment of the requirements for The degree of Master of Public Health in
The Public Health Leadership Program
Chapel Hill
I. INTRODUCTION
Influenza epidemics have been responsible for approximately 36,000
deaths per year in the United States from 1990 to 1999. 1 This number has
risen since the 1976-1990 estimate of 19,000 influenza associated deaths per
year. This alarming statistic might in fact not be due to rising death rates from
influenza infection, but instead due to the increasing number of elderly
persons in the United States? However, strains of influenza associated with
higher mortality (serotype A [H3N2])3 predominated in 90% of influenza
seasons from 1990-1999, compared to 57% of seasons from 1976-1990.4
Persons over age 65 years and those with illnesses placing them at risk for
complications from infection have the highest rates of death and serious
illness from influenza. 5678 Rates of infection with the influenza however are
highest among children.
Influenza vaccination, the primary method for preventing influenza
and its complications, is recommended annually for target groups defined by
the Advisory Committee on Immunization Practices (ACIP).9 These groups
include, first, those at increased risk for influenza-related complications.
These are persons age 65 years or older, residents of nursing homes and
chronic care facilities, and persons of any age with chronic pulmonary
cardiovascular conditions. Secondly, the ACIP recommends vaccination of
all persons age 50-64 because of the elevated prevalence of high-risk chronic
2000 had at least one high-risk medical condition. Lastly, persons who live
with or care for persons at high risk are recommended for vaccination due to
their ability to transmit influenza to other persons at high-risk for
complication. This includes health care workers, employees of chronic care
facilities, home health workers and household contacts of high risk persons.10
Influenza Vaccination Rates
Influenza vaccination rates have been steadily increasing, but have not
reached the recommended 90% coverage level recommended by Healthy
People 2010. In persons age 65 years and over influenza vaccination levels
have risen from 33%11 in 1989 to 68% in the year 200012• These data
represent the percentage of adults reporting influenza vaccination within the
last year and who participated in the National Health Interview Survey
(NHIS), and represent a "proxy measure" of actual influenza vaccine coverage
levels.13 Current data for the year 2001 show that rates had dropped slightly
to 64%, however this was likely do to delays in vaccine supply. Estimated
rates for the year 2002 (67%), when fewer vaccine delays occurred, are
similar to the year 2000 rates. Improvements in influenza vaccine coverage
have been attributed to (l) greater public acceptance of preventive medical
services; (2) improved vaccination administration by both health care
providers and by sources other than medical providers; (3) additional
information regarding vaccine safety; and ( 4) changes in Medicare
reimbursement for influenza vaccination in 1993.
t-l
L
l
t
t
For persons aged 50-64 years, rates have also increased, and in the
year 1999 reached a high of 3 8%. After a similar decline in rates in the year
2000 due to vaccine delays, rates are estimated to increase to 35% in the year
2001, from 32% in the year 2000.14
Improvements in the influenza vaccine coverage rates are needed in all
populations, however, they are mostly needed in high risk persons aged 50 to
64 years, and among Black and Hispanic persons over the age of 65 years.
Although influenza vaccination rates reached an all time high in 1999,
vaccination rates for Black and Hispanic populations are substantially lower
than for the white population.15 16 In 2001, the estimated influenza
vaccination rates for non-Hispanic white persons over age 65 was 70%, for
non-Hispanic blacks was 52%, and for Hispanics was 47%.17
Disparities in Vaccination Rates
The differences or disparity in vaccination rates for influenza between
minority populations are clear. Blacks especially are less likely than whites to
receive influenza vaccinations.18 The reason or reasons for this disparity are
less clear. Factors that may contribute to lower vaccination rates include
poverty, lack of health insurance, education, lack of community support, as
well as any language or culture barriers.19
In a study by Marin et a! (2002) of 2,309 persons using Medical
Expenditure Panel Survey (MEPS) data, vaccination rates in blacks were seen
to be significantly less than in whites. The influenza vaccination rate was
-i-f L
l
68% among whites and 47% among blacks with an odds ratio (OR) of 0.42
(95% CI 0.29-0.61). Factors that were seen to be significant determinants of
both current influenza vaccination and were seen to be associated with race in
persons over age 65 included: age, health risk, perceived health status, family
size, poverty category, and number of provider visits. Stratification of data by
each variable using Mantel-Haenszel chi-squared in each case failed to alter
the association of race and current vaccination status. The authors were
therefore not able to attribute lower vaccination rates in Blacks to these
factors, and hypothesized that other factors were involved in creating the
disparity. 20
A previous study by Mark and Paramore (1996) using data on 9,425
adults from the Medicare Current Beneficiary Survey showed a significant
association between influenza vaccination and education, marital status,
income, insurance status, poor health status, and being interviewed in Spanish
in persons over age 65 years. These factors were also shown to be more
common in minority groups as compared to whites. This study did not
examine, however, whether these factors were confounders of the relationship
between race and vaccination status. 21
In a 1998 study of 26,469 adults using Behavioral Risk Factor
Surveillance System (BRFSS) survey data, factors found to be correlated with
influenza vaccination levels included education, length of time since last
check up, and self-reported index of health. The influenza vaccination rate for
vaccination rates in blacks were not found to be explained by differences in
age, sex, education level, health care access, or perceived health status. 22
The most recent study to date by Egede et a! used National Health
Information Survey (NHIS) data to study 1,906 individuals with diabetes
mellitus to assess whether differences in access to care, health insurance
coverage and socio-economic status (SES) explained racial differences in
vaccination rates. This study by Egede et al is unique among studies of
vaccination rates in that more than 2 racial categories were used. Although a
total of 4 racial/ethnic groups were compared, it was shown that disparities in
influenza vaccination rates between whites and non-whites are largely due to
differences between whites and blacks. Influenza vaccination rates for whites
were 55% and 39% for blacks. Odds ratio for influenza vaccination for whites
compared with blacks was 1.6 (95% CI 1.1, 2.3). Race was found to be an
important predictor of influenza vaccination, independent of access to care,
health coverage, and SES. These results suggest that race is a proxy for a
currently unmeasured or unidentified variable, which may be difficult to
identify without additional data on race/ethnicity, social and cultural factors
that may potentially affect health outcomes.23 Recent discussion in the
literature has suggested that disparities in vaccination rates may be caused by
either unequal access to care, social/cultural values that result in differing
acceptance of vaccination services, and/or unequal rates of recommendation
of vaccination by physicians24 The study by Egede et a! effectively shows
l
L
r
I
l
t
that disparities in vaccination rates (in diabetics) are independent of access to
care.
Neighborhood Characteristics and Health
Recent studies have linked neighborhood risk factors and health
outcomes. For example, O'Campo et al (1997) linked both individual risk
factors (maternal age, education, insurance, prenatal care) and neighborhood
or community variables (home ownership, crime rates, community activism,
unemployment) to low birth weight, and showed that individual level risk
factors behaved differently depending on neighborhood characteristics25 In
fact, individual level factors have only been able to explain a small proportion
of the overall variability seen in birth weight. 26 Increasingly, it is being
recognized and more research is focusing on community and environmental
factors that contribute to risk in both low birth weight27 and overall health.
Overall mortality risk has also been linked to neighborhood
characteristics. In a study by Yen and Kaplan (1999) using data from the
Alameda County Study (n=1,129), mortality risk was found to be significantly
higher in neighborhoods with low social environment (OR 1.6, 95% CI 1.2,
2.2). When components of the neighborhood social environment (income,
occupation, population crowding, housing, commercial stores) were examined
separately, each was found to be associated with a higher mortality risk
independent of individual risk factors. This supports the notion that
t-.
i
lL
l
j
r
L
characteristics of the individual cannot fully describe the characteristics of the L
physical and social environment.
Neighborhood Characteristics and Influenza Vaccination
The amount of research in this area in minimal, but some studies have
focused on the rates of influenza vaccination among different neighborhoods.
Millar et al (1998) found that vaccination rates were higher in urban practices L
in the U.S28 A Dutch study found that the level of urbanization was a strong
predictor of vaccination rates in the Netherlands, 29 with vaccination rates
being lower in urban areas. In diabetic persons over age 65 years, odd ratio
for influenza vaccination in urban (large city) areas was 0.45 (95% CI 0.3,
0.66) and in (small) urban areas was 0.60 (95% CI 0.41, 0.87) when compared
to rural areas. This difference is likely due to differences in vaccination
) practices between the United States and The Netherlands, with the Dutch
L
carrying out immunizations primarily in small family practices throughout the
country, versus the more centralized approach taken in the U.S. The study
outcomes were not adjusted for socio-economic status due to lack of data,
however, in The Netherlands no disparities in vaccination rates have been
found. 30
A large body of literature suggests that many health comes are
influenced by characteristics of individuals. Some of these relations are so
pervasive and persistent that certain individual-level characteristics such as
explanatory variables in public health research investigating relations between
risk factor exposures and disease. However, this is not the whole story.
Groups of individuals form populations that have their own tmique
characteristics determined by culture, environmental exposures, health
L
systems, political conflict, race, inequalities, economics, and social support to
name a few. Many of these population-level or contextual factors have been
shown to influence health in a manner that is statistically independent of
l
individual-level characteristics. So health is influenced not only by who you
are but also by where you live.
In practice, it is impossible to completely separate the effects of
individual-level and population-level factors on health because they operate in
a mutually dependent and interactive manner. Studies performed at the level
of the individual examining only characteristics of individuals may miss
important contextual determinants of health. Ecologic studies have the
strength of measuring the health effects of individual characteristics modified
by neighborhood environment.
A consideration of the joint effects of individual-level and contextual
factors is especially relevant to the study of racial disparities in health. It has
been suggested that race is a social construct without clear biologic meaning.
Furthermore, in a society economically and socially stratified by race, race is a
powerful determinant of individual characteristics such as income and
education. Investigations of racial disparities in health examining only
that result from discrimination, prejudice, and the geographic and/or economic
segregation of relatively disadvantaged racial groups.
The studies cited previously demonstrate that Black persons are
substantially and persistently less likely to receive influenza vaccinations
compared to their Caucasian counterparts. It has been shown in the current
literature that individual level factors such as sex, education level, income,
health care access or perceived health status, access to care, health insurance
status, and SES do not account for differences in vaccination rates between
whites and blacks. Thus, the question remams, what accounts for these
striking disparities. They may be explained by racial disparities in yet-to-be
determined individual-level risk factors. But it also is quite likely that these
disparities are related to characteristics of the different neighborhoods where
these race groups tend to reside. Neighborhood factors help "shape
individual vulnerability and resistance to risk factors for health."31
In this study we aim to explore the relationship of potential community
or neighborhood factors to influenza vaccination rates in North Carolina. We
hypothesize that neighborhood characteristics - specifically income, wealth,
education and employment - influence the vaccination rates of individual
living within that community. This is the first study to examine such factors
and how they relate to racial disparities in influenza vaccination. It is our aim
to determine whether community characteristics are related to existing
disparities. Such community or neighborhood factors are in part the sum of
individual level factors of persons living in the community, however have
t
;
L
I
f
I
meamng only at the population level. In this study we use
socw-environmental indicators from census data to characterize neighborhoods and
relate these to neighborhood influenza vaccination rates and examine the
extent to which they are associated and provide insight into the underlying
reasons for disparities in influenza vaccination rates between black and white
populations.
METHODS
Influenza vaccination status and address were determined from data
from Medicare administrative data on individual enrollees. Addresses were
placed in census tracts through geo-coding. Commonly used indicators of
socio-environmental conditions were determined from U.S. Census data
according to Census tract and assigned to individuals based on their places or
residence.
Medicare Data
All Medicare data were accessed within Medical Review of North
Carolina (MRNC). These data are routinely provided to MRNC from the
Centers for Medicare and Medicaid Services (CMS) as part of MRNC's
contract as the state's Medicare Quality Improvement Organization (QIO).
Data from the 2001 North Carolina Medicare denominator file was used to
identify enrollees, their demographic characteristics, and their address.
Influenza vaccination status was determined by the presence of at least one
i_
f
r-~
T-L
'
administrative claim filed by health care providers on behalf of these L '
beneficiaries for re-imbursement of this service during the year 2001. Flu
shot administration was defined as having a paid flu vaccination claim from
.
July 2000 to June 2001. Medicare enrollees were then geo-coded to U.S. L i
Census tracts using their primary mailing address with Maplnfo (Troy, NY).
Race categories used in this study were based on those currently used
by the Centers for Medicare and Medicaid Services (CMS) formerly known as L
the Health Care Financing Administration (HCFA). In 1994 HCFA expanded
its race categories from three categories (Black; White; other- and unknown)
to six (Black; White; Hispanic; Asian American or Pacific Islander; North
American Indian; other- and unknown). 32
Census Data
Tract level neighborhood information was obtained from the 2000 U.S
Census file. For the purposes of this paper, we will refer to U.S. Census tracts
as neighborhoods. Data elements included population size, race, income
(median household income, per capita income, median household value),
educational attainment (percent completing high school), and unemployment.
These data were obtained from the 2000 U.S. Census long-form CD created
by Geolytics, Inc. (East Brunswick, NJ).
All information regarding U.S Census variables was provided by the
2000 U.S. Census of Population and Housing, Summary File 3 Technical
and older in 1999, reported as the sum of wage or salary income,
self-employment income, interest received, social security, retirement, welfare or
public assistance, or disability income. Excluded from household income are:
income from sale of property, food stamps, loans, tax refunds, gifts or
inheritance. Median household income is based on the total number of
households including those with no income and is computed on the basis of a
single standard distribution.
Household value was based on specified owner occupied and vacant
for sale housing units and included only !-family houses on less than I 0 acres
without a business or medical office on the property. Mobile homes and
multi-unit buildings were excluded. Values were obtained from census survey
respondents estimating the value of the house and lot if it were for sale and
vacant for sale property values.
Educational attaimnent was reported for persons 25 years or older and
the highest level or degree reported was recorded. Educational attaimnent of
the neighborhood was assessed by taking the total number of males and
females over 25 years reporting less than a high school education divided by
the total number of males and females over age 25 years in the census tract.
Missing values were assigned the educational attaimnent of persons of the
same age, sex, race and occupation living in the same area, if possible.
!-L
~--l
t
Linkage of Medicare Data and Census Data
Medicare emollee data including individual flu vaccination status was
linked to U.S. Census neighborhood characteristics data by U.S Census tract
number. Those with a geo-coded outcome of 'single close match' were
defined as being reliably geo-coded. 'Single close match' indicated that the
record was matched to a single address candidate from the Address
Dictionary. Records not identified as 'single close match' included those with
no direct match, those with more than one close match candidate address, and
those matched to P.O. Box or rural route addresses. Beneficiaries were then
assigned characteristics corresponding to their neighborhood
soc1o-environmental characteristics such as wealth, income and educational
attainment which was obtained from U.S. Census data.
Statistical Analysis
All data was analyzed using SAS v8.2 (Cary, NC). Neighborhood
variables were chosen based on both individual level factors currently used in
influenza vaccination studies and widely used indicators of
socio-environmental conditions previously related to health outcomes and health
services in non-flu studies. Pearson and spearman correlation coefficients
were computed for relationship between influenza vaccination and
neighborhood variables. Stratified analyses were done using ordinal variables
created from equal intervals based on the ranges of continuous variables.
r
~-l
l-L
RESULTS
~-Medicare Population
The study population included approximately 1 million North Carolina L '
residents enrolled in Medicare in the year 2001. After excluding persons
younger than age 65 years (n=l69,203) (17%) and those without a single close
match during the geo-coding process (n=134,924) (14%), 720,312 residents
were remaining. These individuals resided in 1,555 of the 1,563 possible
census tracts within North Carolina. The mean tract population of Medicare
beneficiaries was 466 (median 426) with a range of I to 3159.
The baseline population characteristics are presented m Table 1. Overall63% of the North Carolina Medicare beneficiary population resided in
an urban setting, while 37% in a rural setting. Approximately 60% of the
1
population was female and 40% was male. The mean age was 74.9 years.
l
The majority of the population was white, 84%, with blacks constituting 15%,
Asians 0.4%, Hispanics 0.1% and Native American 0.1 %. Due to small
overall numbers in racial groups other than whites or blacks, all races except
white and black were excluded from the analysis. The remaining population
used for analysis was 711, 675 or 71% of the original Medicare population.
The overall influenza vaccination rate based on Medicare beneficiary
claims of all races was 43% (Table 1). That includes 308,610 persons over
age 65 years who received an influenza vaccination in the 2001 influenza
for black beneficiaries was 24%. The vaccination rate for the white population
was almost twice that of the black population. No confidence intervals are
reported because there is 1 00% sampling of the Medicare population. The risk
ratio (RR) for influenza vaccination for black beneficiaries is 0.52 and the risk
difference (RD) 0.22. The overall vaccination rate for the other racial groups
excluded from analysis was 27.2%.
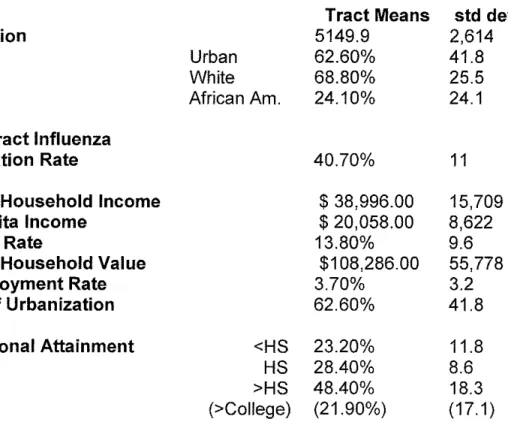
Neighborhood characteristics obtained from the 2000 U.S. Census are
summarized in Table 2. Average median household income for all North
Carolina neighborhoods was approximately $39,000. Average median
household value was approximately $108,000. The average number of
persons with less than a high school education (educational attainment) was
23% of neighborhood residents.
Stratified Analysis
Vaccination rates were determined for tracts grouped with strata of
tract-level income, wealth, educational attainment, employment rate and level
of urbanization. For each of these socio-environmental indicators, tracts were
categorized using ordinal variables based on 10 equal intervals within the
range of their statewide distributions. In the rare case of inadequate numbers
of observations, the strata were either combined with adjacent strata or
dropped.
Overall vaccination rates when stratified by neighborhood median
household income showed that as income increased influenza vaccination
'
t
L
i
rates ranged from 0.28 to 0.49 (Figure 1). For the overall population and for
whites, vaccination rates increased monotonically with median income for low
to medium income ranges ($14,000-$86,000). Vaccination rates changed little
or declined slightly with increasing income at higher income levels (0.49 to
0.47). There is no clear relation between vaccination rates and median income
for Blacks. At income levels of $86,000 or less, vaccination rates for Blacks
varied little (0.22 to 0.23). Vaccination rates for this population were higher
than average in the highest three median income strata.
After stratification by neighborhood median household value, an
indicator of population wealth, (Figure 2) overall influenza vaccination rates
increase from 0.31 to 0.50 as median household value increases, however, this
only holds true for low to medium median household value ranges ($61,000 to
$244,000), at which point vaccination rates plateau. Within median
household value strata, influenza vaccination rates differ substantially by race
and large racial disparities persist at all levels of median household value. At
higher median household value ranges ($427,000-$549,000) influenza
vaccination rates begin to increase from 0.48 to 0.58 for whites, however there
are too few African Americans in these higher household value strata to
evaluate this relationship at the highest values.
Neighborhood educational attainment is directly related to overall
influenza vaccination rate except for the two strata of lowest educational
attainment. (Figure 3). As the percent of the population with less than a high
school education increases, overall influenza vaccination rates decrease.
l
L;
Influenza vaccination rate decreases from 48% to 25% as percent with less
than a high school education increases from 0% to 54%. This relationship
holds true for all neighborhoods except the highly uneducated communities
(>54% with less than high school education). No clear trend is seen in the
Black population, however, and substantial disparities between black and
white populations persist in each strata.
+-L DISCUSSION
The results of this study demonstrate that disparities continue to exist
m the utilization of medical serv1ces, specifically influenza vaccination,
among Medicare beneficiaries in the year 200!. This is the first study known
I
r
to examine neighborhood factors in relation to influenza vaccination among
Medicare beneficiaries in North Carolina. In our study, neighborhood or
community variables do not seem to fully explain the differences in influenza
vaccination rates between blacks and whites. There is therefore some other
factor or factors which contribute to lower influenza vaccination rates among
black beneficiaries.
These results are consistent with current literature that have examined
individual level characteristics such as income, education, access to care, and
t-other individual level variables and found that disparities exist despite
adjusting for these factors. After adjusting for similar neighborhood level
characteristics we have found that disparities in vaccination rates between
L
t
factors have found that these variables do influence health, i.e. all-cause
mortalitl4, low-birth weight35, depression36 and perceived health status37
among others. We have found that persons living m areas of low
income/wealth and areas of low educational attainment are less likely to
receive an influenza vaccination. Black persons are more likely to live in
areas of low wealth and education in North Carolina and are therefore
expected to have lower influenza vaccination rates. Therefore if
L
neighborhood socio-environmental characteristics were the only cause of
disparities and they were controlled for the differences in rates would vanish
or be greatly reduced in both wealth and poor neighborhoods. This is not the
case. It is evident that disparities in influenza vaccination rates persist in all
strata of median income, wealth and educational attainment. Therefore this
study shows that neighborhood conditions as measured by our
socio-environmental indicators are not substantially related to disparities in
influenza vaccination rates. Although they may be somewhat related, the
disparities are occurring for other unknown reasons.
This study uses Medicare influenza reimbursement claims to assess
vaccination levels and more importantly the differences in vaccination rates
between blacks and whites. Other studies have also used non-HMO,
Medicare part B forms to examine influenza vaccination rates of populations
in the United States. Studies using Medicare claims forms typically report
lower overall vaccination rates than studies using survey data. Reasons for
submit claims for Medicare reimbursement upon vaccination and that some
potential recipients of influenza vaccination are not covered by Medicare.
The failure to submit claims to Medicare for influenza vaccination
reimbursement however is not known to differ between blacks and whites.
Therefore, examining the vaccination rates among Medicare beneficiaries
should accurately measure the disparities evident between blacks and whites38
This study found that the difference in vaccination rates between L
blacks and whites was 22% (+/- SE 0.19). Recent studies using survey data
have found similar differences. Marin et a! using the 1996 Medical
Expenditure Panel Survey (MEPS) (n=2,309) found a 21% difference. Edege
National Health Interview Survey (n= I ,906). Using the 1996 Medicare
I
and Zheng found a 16% difference between blacks and whites using the 1998Current Beneficiary Survey (MCBS) (n=13,674), Schneider eta! found a 22%
difference in vaccination rates. The largest study used the 1997 Behavioral
Risk Factor Surveillance System (BRFSS) survey (n=26, 469), where
researchers at the Centers for Disease Control and Prevention (CDC) found a
17% difference in vaccination rates between blacks and whites. Although
overall vaccination rates using claims data fall short of the reported rates form
survey studies, the difference in vaccination rates between racial groups is
similar.
Although Medicare has in effect removed the financial barriers to
physicians and hospital services, it is unclear why disparities persist in this
not a feature unique to the Medicare population. Studies of the use of services
m the Department of Veterans Affairs (VA) programs show similar
disparities39 There is evidence that Medicare managed care emollees have
higher rates of influenza vaccination than Medicare emollees in fee for service
plans. However the racial disparity in vaccination among those in the
managed care plan is not reduced, indicating that the type of Medicare
insurance is not a significant factor in creating disparities. 40 In addition, the
cost-sharing that is required by some Medicare programs is not likely a factor
affecting influenza vaccination rates due to the lack of coinsurance required
for vaccination in the elderly.
It is known from current research that the difference in vaccination
rates between blacks and whites is independent of education, access to care,
h 1 h · ea t msurance coverage an socio-economic status. d · · 41 42 43 44 F actors t at h
may contribute include social or cultural factors resulting in unequal
acceptance rates between races. These include limited awareness of the need
for vaccination, misconceptions regarding vaccination costs, adverse affects,
risks, and/or benefits of vaccination45 Other factors include the knowing or
unknowing failure of physicians to recommend vaccination based on race, and
as yet unknown factors for which race is a proxy.
Barriers to influenza vaccination are likely dependent on both the
individual and the social/cultural background of the community where
individuals live. The most common explanations cited by Medicare
beneficiaries for not receiving an influenza vaccination include: not knowing
L
1
l
Lt
it was needed (21 %); thought vaccination could cause the flu (18%); thought
the vaccination could have adverse affects (15%); did not think the
vaccination would prevent the flu (15%); and did not remember or forgot
about it (13%).46 Lack of recommendation by the physician (6%), and
specific recommendation against vaccination by the physician (6%) were also
cited but not as common. Cost of vaccination and difficulty reaching areas
providing vaccinations were listed by < 2% of beneficiaries. Racial/ethnic
differences were apparent in three of eight categories cited by > I 0% of
beneficiaries who did not receive vaccination. Minority groups were more
likely than whites to cite not being aware of need for vaccination (OR 1.8
95%CI 1.3, 2.3) and lack of physician recommendation (OR 0.5 95%CI 0.2,
0.9). These differences were only significant however for Hispanics and other
minority groups in relation to pneumococcal vaccination. 47
Attitudes and beliefs of individuals no doubt play a significant role in
the choices and preferences made regarding health care. Anecdotal evidence
suggests that individuals who are poor and minority groups are more
suspicious of the value and safety of vaccines compared to more advantaged
persons. 48 Historical reports regarding the Tuskegee experiment may
contribute to this sentiment among some black persons toward the medical
establishment. 49 Other notions such as the 'culture of poverty' where pain is
seen as more of a part of life, fatalism is a more accepted outlook, and
self-initiated services are utilized less may contribute, at least partly, to lower rates
of vaccination in addition to lower health outcomes50 The complementary
L
L
L
~-
!
~
I
'1theory of the 'culture of advantage' where socially advantaged individuals
expect the best medical services and utilize networks of socially advantaged
peers to obtain information on medical practitioners, institutions, and
diagnostic tests and procedures, may also contribute to disparities. 51
The health care system and specifically the behavior and
recommendations of physicians likely play a role in health outcomes.
Documented disparities m physician recommendation of cardiac
revascularization by racial group exist and are one example of the influence
physicians have in the health care system and how they contribute to creating
disparities in health outcomes. 52 The differing recommendations made by
physicians are influenced by stereotypical beliefs regarding the behavior of
minority and disadvantaged persons regarding for example their likelihood to
return for follow up appointments or their ability to adhere to a complex
course of treatment or recommendation53 The culture of physicians,
however, is changing from mostly upper middle class, white males trained
only in the treatment of disease to a more representative demographic with
training in and assistance from interdisciplinary fields.
Recommendations for the elimination of disparities m health care
outcomes include the need for broad based research and experimentation with
a focus on data development. The ability to assess health care service
utilization and health care outcomes lies on the ability to identify and monitor
vulnerable subgroups. Increased awareness of disparities in health care is
needed by leaders in the medical community and in the major professional
'
f-!
L
l
f
societies and their recommendations on how best to eliminate disparities.
Finally with little knowledge of the reasons that create differing health
outcomes between races it is difficult to know what changes to recommend,
however it is clear that initiatives need to be aimed at both the beneficiaries as
well as all those who provide health care. 54
An important feature of this study was the linkage of Medicare claims
data identifying those beneficiaries whom received influenza vaccinations and
whom had residences which allowed geo-coding to specific U.S Census tracts.
The limitation inherent with this ability is that not all beneficiaries residences'
were able to be geo-coded to Census tracts with complete certainty. However,
for those that were geo-coded and linked to U.S. Census tracts, studies have
shown it to be very accurate and suitable means for epidemiological
research55 Studies have also validated the use of aggregated information of
socioeconomic status obtained from the census as a proxy for data on the
socioeconomic status of both individuals and the areas in which they live. 56 57
58 59
Other strengths of this study include the I 00% population sampling
which translates to no sampling error and therefore no need for hypothesis
testing or p- values. Both the large number of individuals included in this
study as well as the large bi-racial population living in similar geographic
conditions are a strength of the study. The cross-sectional design of the study
allows for detection of both population level and individual factors.
Limitations of this study include the under-reporting of overall
influenza vaccination rates due to using Medicare claims data. This should
f
t-L
'
I
l
r
not affect the difference in vaccination rates seen between blacks and whites.
±--The small number of Hispanic as well as Asian and Native American
beneficiaries enrolled in Medicare within North Carolina did not allow
observations of differences in rates between these races to be made. The
cross-sectional design of this study does not allow independent effects of
population level and individual level factors to be distinguished. In addition,
l potential confounding/explanatory factors related to disparities such as
L
individual patient co-morbidities, are not considered here. This analysis
included only bivariate relationships. Future research such as multi-level
modeling techniques using both individual level and contextual data would
better explore these relationships, however, such individual level data is not
I
readily available for Medicare beneficiaries. Census data on neighborhoodcharacteristics was obtained through sampling a small number of individuals
in each tract. Sampling error of census data was not controlled for in this
study. Data from North Carolina Medicare beneficiaries may not be
generalizable to other populations within the United States or to younger
populations under age 65 years.
In conclusion, it is clear that black Medicare beneficiaries over 65
years old in North Carolina were significantly less likely to receive influenza
vaccinations relative to whites. This is consistent with both the current
literature as well as prevwus studies exammmg Medicare beneficiary
influenza vaccination rates. Racial disparities in influenza vaccination rates
as educational attainment. These findings together with those of previous
studies suggest that the low vaccination rates of black Medicare beneficiaries
are better explained by barriers to care other than those typically associated
with individual and population level income, wealth and education. Further
studies are needed to better characterize these barriers and explore the cultural
and ethnic differences between races which may contribute to differing health
outcomes.
Table 1. Baseline Characteristics of Medicare beneficiary population.
Mean N
Age 74.9
Sex Male 40.1
Female 59.9
Race White 83.84% 603,936
Black 14.96% 107,730
Other 0.41% 2,925
Asian 0.36% 2,622
Hispanic 0.13% 966
Native Am 0.17% 1,240
Unknown 0.12% 893
Influenza
Vaccination Rate
Total 43.03 306,262
White 46.4 280,256
Black 24.14 26,006
Asian 29.06 762
Hispanic 26.92 260
Native Am 21.61 268
Other 25.74 753
Unknown 34.15 305
~-l
L
~
t
~
~
'
'
i
~
'
1 ''
~-L
' ~
Table 2: Descriptive characteristics of Census tracts.
Tract Means std dev
Population 5149.9 2,614
Urban 62.60% 41.8
White 68.80% 25.5 L
African Am. 24.10% 24.1 L !
Mean Tract Influenza
~
Vaccination Rate 40.70% 11
!
Median Household Income $38,996.00 15,709
Per capita Income $20,058.00 8,622
t
Poverty Rate 13.80% 9.6
'
Median Household Value $108,286.00 55,778
Unemployment Rate 3.70% 3.2
Level of Urbanization 62.60% 41.8
Educational Attainment <HS 23.20% 11.8
HS 28.40% 8.6
L
>HS 48.40% 18.3
(>College) (21.90%) (17.1)
!
t *<HS - Less than High School Education; HS - Obtained High School
Neighborhood Median Household Income and Influenza Vaccination Frequency
0.9 0.8 0.7 0.6
0.4 0.3 0.2 0.1 0
0-14,000 14-28,000 28-43,000 43-57,000 57-72,000 72-86,000 86--100,000 !00-115,000 115-129,000
NeighborhoodMedlan Household Income
Figurel. Neighborhood Median Household Income and Vaccination Rate among Medicare beneficiaries over age (unadjusted).
Influenza
65 years
I:! Total
:DWhite,
Neighborhood Median Household Value and Influenza Vaccination Frequency
0.9 0.8 0.7 0.6
~~~~c.:_j !EJTotal :DWhite, ;• Black
0.3
0.2
01 0
0--61,000 61-122,000 122-183,000 183-244,000 244-305,000 305-366,000 366-488,000
Neighborhood Median Household Value
Figure 2. Neighborhood Median Household Value and Influenza Vaccination Rate among Medicare beneficiaries over age 65 years (unadjusted).
L
!
r
Neighborhood Educational Attainment and Influenza Vaccination Frequency
0.9 0.8 0.7 0.6
;;-c
• 0.5
,
~
~
0.4 0.3 0.2 0.1 0
0-6% 6-13% 13-20% 20-27% 27-34% 34-41% 41-47% 47-54% 54-61% 61-68%
Educational Attainment (Percent with< High School Education)
Figure 3. Neighborhood Educational Attainment and Influenza Vaccination (unadjusted). Educational Attainment measured as percent with less than High School Education
'
t-L
L
Neighborhood Characteristics and Influenza Vaccination
Rates in Medicare Beneficiaries over age 65 years: a Study of
~lfJ)Jtl};!JsflMit~~~~eighborhood socio-economic conditions to di suarities in influenza vaccination rates.
Ecr tsrlClgetord, Umversity of North Carolina, Chapel Hill, NC
Income/Wealth Vaccination Rates
Education
IJ~(jigllborhood
f.fc"{'iJ.frwlra,th Higher Neighborhood
1 Educational Attainment
ObjectiVe: To examine whether neighborhopd characteristics are related to
G~illltlltfmilamllilyinfluenza vaccination ra~s among older black and white
~M!rhomficiaries. Greater Awareness of Need
Medical Services
.,l..
Method.$ All North Carolina Medic<ei-&fa!f\SWiffl~lt~a& 65 years of age in 200 I were identified and linked G'tell~IWI'iil!i!Pt'lt'tisltsi-IW'cfii:einfluenza
~fSM£ll,&ffe~o\\\
CnfJlr health careprovi~rs.
Those with valid street addresse$- were geo-coded and located in >lcensus tracts. Tract-specificin\ll!!lwtt
Il\~ziion rates were detinnitli:l:llnBD.ematMt!Nii\Mig~M socio-environmental characteristics obtained from the 2000 Decennial Census.Results: 720,321 Medicare beneficiaries over age 65 years were reliably geocoded to U.S. Census tracts in North Carolina. The influenza vaccination rate for whites was 46% (+/- SE 0.06%) and was 24% (+/- SE 0.13%) for blacks. The influenza vaccination rate was significantly lower for blacks. Adjustment for neighborhood characteristics including median household income, median household value, educational attaimnent, unemployment rate and level of urbanization failed to change this difference in vaccination rates.
Conclusion: ln 2001, black Medicare beneficiaries over 65 years old in North Carolina were significantly less likely to receive influenza vaccinations relative to whites. Racial disparities in influenza vaccination rates were not explained by differences in neighborhood factors.
'
i
f
t-t
'
L
i
l.
t
L
f
REFERENCES
1
Thompson WW, Shay DK, Weintraub E, eta!. Mortality associated with influenza and respiratory syncytial virus in the United States. JAMA 2003;289:179-86.
2
National Center for Health Statistics, United States. Hyattsville, MD: US Department of Health and Human Services, CDC, 1998. DHHS ppublication no. (PHS) 98-1231.
3
Simonsen L, Clarke MJ, Williamson GD, Stroup DF, Arden NH,
Schonberger LB. Impact of influenza epidemics on mortality: introducing a severity index. Am J Public Health 1997;87:1944-50.
4
Thompson WW, Shay DK, Weintraub E, et al. Mortality associated with influenza and respiratory syncytial vims in the United States. JAMA 2003;289: 179-86.
5
Manto AS, Kioumer F. Tecumesh study of respiratory illness IX. Occurrence of influenza in the community, 1966-1971. Am J Epidemiol
1975; 102:553-63.
6 Barker WH. Excess pneumonia and influenza associated hospitalization
during influenza epidemics in the United States, 1970-78. Am J Public Health
1986;76:761-5. 7
Barker WH, Mullooly JP. Impact of epidemic type A influenza in a defined adult population. Am J Epidemiol 1980;112:798-811.
8 Glezen WP. Serious morbidity and mortality associated with influenza
epidemics. Epidemiol Rev 1982;4:25-44.
9
Centers for Disease Control and Prevention Prevention and Control of Influenza: Recommendation of the Advisory Committee on Immunization Practices (ACIP). MMWR Morb Mortal Wkly Rep 2003;52: 1-34.
1
°
Centers for Disease Control and Prevention Prevention and Control of Influenza: Recommendation of the Advisory Committee on Immunization Practices (ACIP). MA1WR Morb Mortal Wkly Rep 2003;52: 1-34.
11
Centers for Disease Control and Prevention Influenza and Pneumococcal vaccination coverage levels among persons aged >65 years- United States,
1973-1993. MMWR Morb Mortal Wkly Rep 1995;44:506-7, 513-515.
12
Centers for Disease Control and Prevention Early release of selected estimates based on data from the January-June 2002 NHIS. US Dept of Health and Human Services, CDC, National Center for Health Statistics 2002.
Available at http:/ /www.cdc.gov/nchs/about/major/nhis/released200212.htm 13
Centers for Disease Control and Prevention. Prevention and Control of Influenza: Recommendation of the Advisory Committee on Immunization Practices (ACIP). MMWR Morb Mortal Wkly Rep 2003;52:1-34.
~-L
14
Centers for Disease Control and Prevention. Prevention and Control of Influenza: Recommendation of the Advisory Committee on Immunization Practices (ACIP). MMWR Morb Mortal Wkly Rep 2003;52: 1-34.
15
Centers for Disease Control and Prevention. Prevention and Control of Influenza: Recommendation of the Advisory Committee on Immunization Practices (ACIP). MMWR Morb Mortal Wkly Rep 2003;52:1-34.
16
Centers for Disease Control and Prevention. Influenza and Pneumococcal vaccination levels among persons aged >65 years - United States, 2001
MMWR Morb Mortal Wkly Rep 2001;51:1019-24.
17
Centers for Disease Control and Prevention. Prevention and Control of Influenza: Recommendation of the Advisory Committee on Immunization Practices (ACIP). MMWR Morb Mortal Wkly Rep 2003;52: l-34.
18
Schneider EC, Zaslavsky AM, Epstein AM. Racial Disparities in the Quality of Care for Enrolles in Medicare Managed Care JAMA
200 I ;287(1 0): 1288-94(9-15) 19
Marin MG, Johanson WG, Salas-Lopez D. Influenza Vaccination among Minority Populations in the United States. Prev Med2000;34:235-41.
20
Marin MG, Johanson WG, Salas-Lopez D. Influenza Vaccination among Minority Populations in the United States. Prev Med2000;34:235-41. 21
Mark TL, Paramore LC. Pneumococcal pneumonia and influenza
vaccination: access to and use by US Hispanic Medicare beneficiaries. Am J
Pub Health 1996;86(11 ): 1545-1550.
22
Centers for Disease Control and Prevention MMWR Influenza and Pneumococcal Vaccination levels among adults aged <65 years. -United States, 1997. MMWR Morb Mortal Wkly Rep 1998;47(38):797-802.
23
Egede LE and D Zheng Racial/Ethnic Differences in Adult Vaccination Among Individuals with Diabetes. Am J Pub Health 2003;93(2):324-29.
24
Centers for Disease Control and Prevention Influenza and pneumococcal vaccination rates among persons with diabetes mellitus - United States, 1997.
MMWR Morb Mortal Wkly Rep 1999;48:961-67. 25
O'Campo P, Xue X, Wang M, O'Brien Caughy M. Neighborhood Risk Factors for Low Birthweight in Baltimore: A Multilevel Analysis. Am J Pub Health. 1997;87(7):1113-18.
26
O'Campo P, Xue X, Wang M, O'Brien Caughy M. Neighborhood Risk Factors for Low Birthweight in Baltimore: A Multilevel Analysis. Am J Pub Health. 1997;87(7):1113-18.
27
O'Campo P, Xue X, Wang M, O'Brien Caughy M. Neighborhood Risk Factors for Low Birthweight in Baltimore: A Multilevel Analysis. Am J Pub Health. 1997;87(7):1113-18.3-7
28
Millar JS, Scheffler SA, Murray CK, Bratzler DW. Comparison of influenza immunization rates for Oklahoma Medicare Patients: 1995, 1996, and 1997. J Okla State Med Assoc. 1998;91 :509-513.
29
Tacken M, Braspenning J, Spreeuwenberg P, van den Hoogen H, van Essen G, de Baker D, Oro! R. Patient Characteristics Determine Differences in the
L
!t
t-t Lf
'
<=i
t
l
Influenza Vaccination Rate More so Than Practice Features. Prev Med
2002;35:401-406. 30
van Essen GA, Keyvenhoven MM, de Melker RA. Compliance with influenza vaccination. Its relation with epidemiologic and sociopsychological factors. Arch Fam Med 1997;6:157-63.
31
O'Campo P, Xue X, Wang M, O'Brien Caughy M. Neighborhood Risk Factors for Low Birthweight in Baltimore: A Multilevel Analysis. Am J Pub
Health. 1997;87(7):1113-18.
32
Arday SL, Arday DR, Monroe S, Zhang J. HCFA's Racial and Ethnic Data: Current Accuracy and Recent Improvements. Health Care Fin Rev
2000;21( 4): 107-16.
33
U.S. Census 2000 Summary File 3, US Department of Commerce, Economics and Statistics Administration, U.S. Census Bureau.
34
Yen IH and GA Kaplan. Neighborhood Social Environment and Risk of Death: Multilevel Evidence from the Alameda County Study. Am J
Epidemiology 1999; 149(1 0):898-907.
35
O'Campo P, Xue X, Wang M, O'Brien Caughy M. Neighborhood Risk Factors for Low Birthweight in Baltimore: A Multilevel Analysis. Am J Pub
Health. 1997;87(7): 1113-18.
36
Sooman A, and S Macintyre. Health and perceptions of the local environment in socially contrasting neighbourhoods in Glasgow. Health
Place 1997;1 :27-40.
37
Sooman A, and S Macintyre. Health and perceptions of the local environment in socially contrasting neighbourhoods in Glasgow. Health
Place 1997;1:27-40.
38 Centers for Disease Control and Prevention MMWR 1995 44:24-27,33. 39
Gornick, ME Disparities in Medicare Services: Potential Causes, Plausible Explanations, and Recommendations. Health Care Fin Rev 2000;21(4):23-43.
40
Schneider EC, Cleary PD, Zaslavsky AM, Epstein AM Racial Disparity in Influenza Vaccination: Does Managed Care Narrow the Gap Between African Americans and Whites? JAMA 2001;286(12):1455-60.
41
Schneider EC, Cleary PD, Zaslavsky AM, Epstein AM Racial Disparity in Influenza Vaccination: Does Managed Care Narrow the Gap Between African Americans and Whites? JAMA 2001;286(12):1455-60.
42
Egede LE and D Zheng Racial/Ethnic Differences in Adult Vaccination Among Individuals with Diabetes. Am J Pub Health 2003;93(2):324-29.
43
Centers for Disease Control and Prevention Influenza and pneumococcal vaccination rates among persons with diabetes mellitus- United States, 1997. MMWR Morb Mortal Wkly Rep 1999;48:961-67.
44
Marin MG, Johanson WG, Salas-Lopez D. Influenza Vaccination among Minority Populations in the United States. Prev Med2000;34:235-41.
45
Schneider EC, Cleary PD, Zaslavsky AM, Epstein AM Racial Disparity in
Influenza Vaccination: Does Managed Care Narrow the Gap Between African Americans and Whites? JAMA 2001;286(12):1455-60.
r
l
t
46
Schneider EC, Cleary PD, Zaslavsky AM, Epstein AM Racial Disparity in Influenza Vaccination: Does Managed Care Narrow the Gap Between African Americans and Whites? JAMA 2001;286(12):1455-60.
47
Schneider EC, Cleary PD, Zaslavsky AM, Epstein AM Racial Disparity in Influenza Vaccination: Does Managed Care Narrow the Gap Between African Americans and Whites? JAMA 2001;286(12):1455-60.
48
Gornick, ME Disparities in Medicare Services: Potential Causes, Plausible Explanations, and Recommendations. Health Care Fin Rev 2000;21(4):23-43 49
Gornick, ME Disparities in Medicare Services: Potential Causes, Plausible Explanations, and Recommendations. Health Care Fin Rev 2000;21(4):23-43 50
Gornick, ME Disparities in Medicare Services: Potential Causes, Plausible Explanations, and Recommendations. Health Care Fin Rev 2000;21(4):23-43 51
Gornick, ME Disparities in Medicare Services: Potential Causes, Plausible Explanations, and Recommendations. Health Care Fin Rev 2000;21(4):23-43 52
Ibrahim SA, Whittle J, Bean-Mayberry B Racial/Ethnic Variations in Physician Recommendations for Cardiac Revascularization. Am J Pub Health
2003;93(1 0): 1689 53
Gornick, ME Disparities in Medicare Services: Potential Causes, Plausible Explanations, and Recommendations. Health Care Fin Rev 2000;21(4):23-43
54
Gornick, ME Disparities in Medicare Services: Potential Causes, Plausible Explanations, and Recommendations. Health Care Fin Rev 2000;21(4):23-43 55
Bonner MR, HanD, Nie J, Rogerson P, Vena JE, Freudenheim JL. Positional accuracy of geocoded addresses in epidemiologic research.
Ef_idemiology. 2003 Jul;14(4):408-12.
5
Gornick ME, Eggers PW, Teilly TW, et al. Effects of Race and income on mortality and use of services among Medicare Beneficiaries. NEJM
1996;335(11):791-99. 57
Kreiger N. Overcoming the absence of socioeconomic data in medical records: validation and application of a census-based methodology. Am J Pub
Health 1992;82:703-10.
58
Geronimus AT, Bound J, Niedert L. On the validity of using census geo-code characteristics to proxy economic status. Ann Arbor: Population Studies Center, University of Michigan (Research reports no. 93-269); 1993. 59
McBean AM, Herbert P. Comparison of income information in the 1990 census with information in the Medicare Current Beneficiary Survey.
Baltimore: Health Care Financing Administration. (HCFA contract no HCFA 95-0265); 1995.
L
1