FLOODING AT THE SHEPS CENTER SITE AREA
Chenhao Zhao
A technical report submitted to the faculty at the University of North Carolina at Chapel Hill in partial fulfillment of the requirements for the degree of Master of Science in Environmental Engineering in the Department of Environmental Sciences and Engineering in the Gillings School of Global Public Health.
Chapel Hill 2017
Approved by:
Peter Kolsky
Sally Hoyt
ii
iii
ABSTRACT
Chenhao Zhao: Flooding at the Sheps Center Area
(Under the direction of Pete Kolsky)
iv
ACKNOWLEDGEMENTS
First of all I want to say thanks to my MSEE program advisor, Dr. Pete Kolsky. As I am not a native English speaker, you gave me a lot of suggestions about how to adapt myself into this new
academic environment quickly. For this MSEE project, you spent a lot of time meeting with me to resolve my confusion, and reviewing my report drafts. And you always give me the strongest support you can whenever I get stuck, I really appreciate that.
Then I would like to thank Sally Hoyt, PE, and Dr. Glenn Walters for serving on my committee. Sally provided me with this good project to work on, met with us for several times even just to solve the ArcGIS problems, and gave me plenty of useful information for my report work. Sally also went with me and Pete for the field visit, did some important measurement together for me to get the required data of the site, it was a great experience. Glenn and Sally also gave me constructive suggestions for my technical report, it is my honor to have your supports.
Next I would like to thank my friends Elisa Rehak and Weixuan Wu. They helped me
figure out lots of detailed problems throughout this process, and let me have someone to discuss
with when I feel confused. You also gave me good suggestions for my presentation of the MSEE
defense, made me feel more confident. I would like to thank my family and my friends. It is your
v
TABLE OF CONTENTS
CHAPTER 1: INTRODUCTION ... 1
CHAPTER 2: PROBLEM IDENTIFICATION ... 2
Introduction ... 2
The Nature of Flooding Problems ... 3
Significance of the Problem ... 3
Site Background ... 5
Rainfall Data... 8
Rational Method for Site Inflow and Outflow ... 9
Field Observation ... 12
SWMM Performance ... 14
CHAPTER 3: TECHNICAL OPTIONS ANALYSIS ... 19
Introduction ... 19
Technical Options ... 19
SWMM Method for analysis of options ... 22
Explanation of Criteria ... 26
Comparison of Technical Options ... 28
CHAPTER 4: RECOMMENDED SOLUTION ... 32
CHAPTER 5: IMPLEMENTATION PLAN ... 35
Introduction ... 35
Reviews and Approvals Process... 35
Scheduling ... 36
Public Disruption ... 37
Resources Requirements ... 37
Long-Term Operation & Maintenance ... 38
Technical Problems ... 38
Costs ... 38
APPENDICES ... 43
vi
Appendix B: Rational Method and Conduit Sizing ... 45
Appendix C: Choke Point Theory Calculation ... 52
Appendix D: SWMM Performance and Data ... 53
Appendix E: Additional Photo Information by Field Observation ... 62
1
CHAPTER 1: INTRODUCTION
On December 30th, 2015 a severe storm event occurred in Chapel Hill, leading to flooding of both northern and southern parking lots of Sheps Center (located at 725 Martin Luther King Jr
Boulevard, Chapel Hill, NC), which is a unit of UNC Division of Health Affairs. The existing
drainage network consists of an irregular open channel ditch parallel to the Sheps building and its
parking lots, leading to a 15” culvert at the downstream end. This system serves a catchment area
of approximately 6 acres. On December 30th, the runoff overtopped the banks of the ditch and flowed into the parking lots, carrying substantial amounts of debris, sediment and leaves,
severely affecting the normal function of the parking lots. This technical report identifies
problems with the existing drainage infrastructure leading to such problems in a small storm, and
lists a set of technical options to address these problems. Technical analyses of these options will
be presented, and they will be evaluated based on explicit criteria. The report will identify a
recommended solution made up of the best single option (or a combination of several options),
and develop an implementation plan to define the process and likely challenges of final design,
2
CHAPTER 2: PROBLEM IDENTIFICATION
Introduction
The Cecil G. Sheps Center for Health Service Research is located at 725 Martin Luther
King Jr. Blvd, Chapel Hill, NC. It is a unit of UNC Division of Health Affairs. The whole site
consists of the Sheps building, two parking lots which are located to the north and south of the
building, and green area.
The flooding happened on December 30th, 2015, when a storm with 2.54 inches precipitation occurred, (which can be regarded as a 1-year storm). The flooding severely
disrupted the normal functioning of the parking lots. Leaves, gravel and debris brought by
flooding water to the parking lots made the site a mess. This kind of problem is likely to happen
again when storm events appear, so it is necessary to seek the origins of the problem, and develop
solutions to avoid or reduce flooding problems in the future. The potential causes could be
- an undersized channel,
- improper design or construction of the channel,
- connected pipes which might not have enough capacity to handle the inflow and
- inadequate capacity in the downstream culvert.
This section of the report provides essential background information about the problem.
It includes analysis of local rainfall data collected from the National Oceanic and Atmospheric
Administration (NOAA), geographical data observed by field trips and from ArcGIS maps, and
Storm Water Management Model (SWMM) modeling results to estimate performance of the
channel on a rainy day. The modeling work was undertaken on the assumption that SWMM
could describe the condition and performance accurately enough to identify flooding, capacity
3
The Nature of Flooding Problems
The flooding at the Sheps building site can be caused by several reasons. The open
channel is the most likely source of this problem, since the water is directly spilled from the
channel. The size of the channel, and its resultant capacity, should be considered, and some
unexpected field conditions should be checked by field observation. Besides the channel, the
downstream pipe system of Sheps Center is also a major factor that needs to be thought about.
The pipes of the drainage system might be blocked with debris brought into it, or the pipes size
could be too small to drain all the water brought into the drainage system immediately when
heavy storm occurs. The pipe inlets installed in the parking lots can also be clogged by the debris
carried by water, or the pipe inlets may not have enough capacity to handle the storm of such
scale. Another item that needs to be checked is the culvert at the downstream end of the conduit,
which is installed under Greene Street. All these hypotheses are investigated in following
chapters.
Significance of the Problem
4
Figure 1: Northern Parking Lot of Sheps Center on December 30th, 2015. 1
Figure 2: Southern Parking Lot of Sheps Center on December 30th, 2015.1
5
This site condition brought inconvenience to employees or visitors of Sheps Center who
park their vehicles in the parking lot, and the water could do harm to the vehicles already parked
there. Those vehicles were unable to leave the parking lot because of the deep water blocking the
pathway. People may slip and become injured when trying to use the parking lot when
accumulated water ices over. These inconveniences could lead to economic loss, and need to be
addressed.
Site Background
Sheps Center is located on Martin Luther King Jr. Blvd, detailed information can be
found in Figure 3, where the green area shows the location of Sheps Center.
Figure 3: Sheps Center Location
The problematic open channel is parallel to Sheps Center, starting from the southwest side
of the building and going toward northeast direction (see figure 5). The catchment area of the
6
2003 orthophotography and provided by ArcGIS MapServer. The map with contour can be seen
in Figure 4.
Figure 4: Site map with 2’ Contour Lines
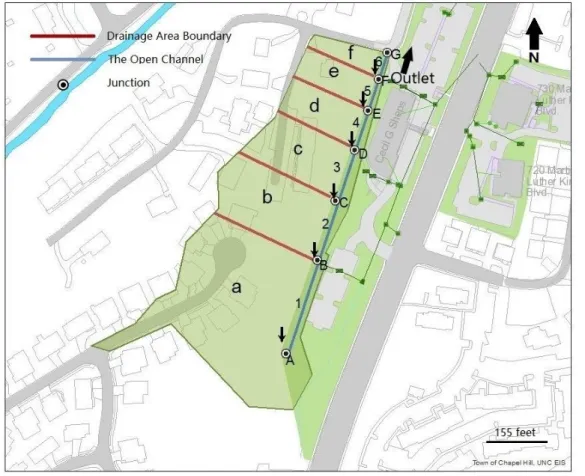
The green area in Figure 5 is the catchment area for the channel; it is measured to be
about 6 acres altogether. The channel can be divided into six parts or reaches by the changes of
section area and shape of the channel, and the corresponding sub-catchment area can also be
defined for each reach.
Although the runoff from the tributary area goes into the channel all the way along its
length, it is not necessary or practical to simulate this sheet flow. For this study, the channel has
been divided into six parts, as there are seven points on the channel where there are changes in
channel section (including the starting and end points of the channel). It is assuming that all the
runoff from a certain part of tributary area will flow into the system at the nearest of these
7
same uniform conduit, The tributary area is thus divided into six parts, shown schematically
below. Detailed information will be introduced in next chapter.
Figure 5: The Problematic Channel at Sheps Center and Tributary Area Approximations
The drainage system of Sheps Center is made up of: one irregular open channel, one 4”
pipe, five 12” pipes, one 15” pipe, and one 18” pipe; the water in these pipes is drained into a 48”
main. From this main, all the water will be delivered into the drainage system belongs to Town of
Chapel Hill. There is also a 12” pipe draining some smaller pipes under the northern parking lot.
All the stormwater collected from the site will be delivered to a larger city network system.
8
Figure 6: Drainage System of Sheps Center
Rainfall Data
The rainfall data of the Sheps Center area can be found on the National Oceanic and
Atmospheric Administration (NOAA) National Weather Service website, Precipitation
Frequency Data Server (PFDS). The rainfall information is collected by station CHAPEL HILL 2
W, which is located at Orange Water and Sewer Authority (OWASA), about 2 miles away from
Sheps Center. The data provides precipitation depth and frequency estimates with 90%
confidence intervals. The information includes rainfall intensities for different lengths of duration
in minutes, and recurrence intervals in years. Duration describes the length of time over which Open Channel
9
given rainfall intensity occurs, and the recurrence interval (return period) refers to the average
period between events of such rainfall intensity. Treating each year as an independent hydrologic
event allows us to convert a recurrence interval or return period of 10 years to a probability that
in any given year, there is a one in ten chance of an equivalent (or more intense) storm occurring.
A depth-duration-frequency (DDF) curve can be found on the NOAA website, which can also be
converted into an intensity-duration-frequency (IDF) curve by dividing the depth by the duration
to calculate the rainfall intensity. The IDF curve is more useful than the DDF curve for drainage
design, as rainfall intensity is the form required by the rational method of flow estimation used in
this analysis, and described below. Data can be found in Appendix A.
Rational Method for Site Inflow and Outflow
Hydraulic analysis is an important part of drainage assessment and design. Among
different methods of hydraulic analysis, the rational method is regarded as a simple technique for
estimating a design discharge from a small watershed. Considering the condition of Sheps
Center, the rational method is an appropriate choice for the peak flow calculation of the open
channel, including SWMM simulation inflow data and channel capacity check.
Different catchment area surfaces can lead to different infiltration and runoff
characteristics and performance, reflected in the Rational Method runoff coefficient C. Through
online soil maps, aerial photographs and field observation of the site, this area consists of three
types, grass-covered clay soils, roofs of buildings and concrete pavement. The percentage of each
type is 77%, 10% and 13%, then the C value of the site is determined to be 0.33. Table below
10
in Figure 5. Detailed calculation can be found in Appendix B, Figure 6 provided by United States
Department of Agriculture (USDA) on its Web Soil Survey is the soil map for the site.
Subcatchment Area Runoff Coefficient Area (acres) Effective Area (C*A)
a 0.44 3.17 1.39
b 0.23 0.98 0.23
c 0.35 0.65 0.23
d 0.22 0.53 0.17
e 0.23 0.42 0.10
f 0.18 0.22 0.04
Table 1: Effective Area for each subcatchment area
Figure 7: Soil Map of Sheps Center2
Map Unit Symbol Map Unit Name
AuC Appling-Urban land complex, 2 to 10 percent
slopes
LoC Louisburg (Wateree) sandy loam, 6 to 15 percent
slopes
Ur Urban land
WmE Wedowee sandy loam, 15 to 25 percent slopes
Table 2: Map Unit Symbols of Soil Map
11
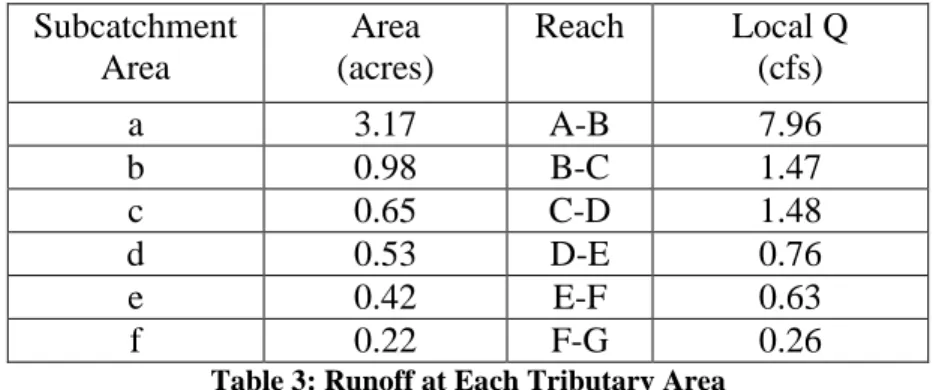
The inflow data for each sub-catchment areas computed using rational method can be
found in Table 3. From UNC Design Guideline (2010), a 10-year return period rainfall should be
used to evaluate this system. Detailed explanation of calculation can be found in Appendix B.
Subcatchment Area
Area (acres)
Reach Local Q
(cfs)
a 3.17 A-B 7.96
b 0.98 B-C 1.47
c 0.65 C-D 1.48
d 0.53 D-E 0.76
e 0.42 E-F 0.63
f 0.22 F-G 0.26
Table 3: Runoff at Each Tributary Area
Table 4 below shows the section characteristics and uniform flow capacity of each reach.
Compared this information with Table 3, we can find that reach E-F can be the bottleneck of the
channel.
Conduit Reach Subcatchment
areas included
Flow (cfs)3
Cross-Section Area (ft2)
Shape Reach
Length (ft)
Reach Capacity
(cfs)
1 A-B a 7.96 3.07 Rectangular 227 17.6
2 B-C a, b 9.33 7.29 Triangular 147 77.3
3 C-D a, b, c 10.5 4.63 Triangular 114 38.7
4 D-E a, b, c, d 11.0 4.74 Trapezoidal 107 32.8
5 E-F a, b, c, d, e 11.5 1.79 Triangular 83 9.13
6 F-G a, b, c, d, e, f 11.5 3.43 Triangular 66 14.2
Table 4: Characteristics of each Reach
12
Field Observation
Field observation is essential to understanding drainage system performance. Sally Hoyt
made field observations on December 30th, 2015, when the flooding occurred. The precipitation on that day was 2.54 inches over a 24 hours period, which is close to a 1-year return period. From
the pictures and videos taken by Sally Hoyt, there is severe ponding on both the northern and
southern parking lot. There are several gaps in the open channel where runoff spills out. Dead
branches were scattered everywhere and affect the route of runoff.
Another field observation was made by the author of this report during the storm event on
July 4th, 2017, when the total precipitation was 2.81 inches over a 24 hours period. This amount of precipitation is close to a 1-year return period. Four choke points were identified, and were
found to be blocked by debris or accumulated sediment to varying degrees and significantly
disturbing the flow of the runoff. These appeared most likely locations for overflow, and are
therefore analyzed in greater detail below. In addition to these choke points, the part of the open
channel parallel to the southern parking entrance and the part of channel connected to the
downstream culvert no longer have a regular shape; the sidewall is badly eroded, so water spills
out through the grassland to the southern parking lot. Finally, the channel connected to the
downstream culvert has limited depth to let the water pass because of the debris accumulated in
the invert.
In this study, field observations and trial hydraulic calculations establish that the main
cause of flooding lies in the open channel parallel to the building. Three likely constraints on the
performance of the channel are: (1) the upstream pipe inlet 121-D-017 to divert flow to the pipe
network may easily be clogged, (2) the downstream culvert may be blocked, poorly dimensioned,
13
a variety of points. The location of the pipe inlet and the culvert can be found in Figure 8. It is a
horizontal grate inlet to a pipe that is intended to divert flow from the inlet of the open channel to
the pipe network. The horizontal grating is almost certainly going be clogged with leaves and
debris. Field observation confirmed that both the upstream diversion inlet and the downstream
culvert were clogged by leaves, branches, and gravel. The channel capacity analysis will be
introduced in the following section.
14
Figure 9: Existing Situation of the Pipe Diversion Inlet 121-D-017
SWMM Performance
In order to model the real hydraulic performance of the open channel on a rainy day, the
Storm Water Management Model sponsored by the US Environmental Protection Agency (EPA)4
was used in this investigation. In SWMM, junctions and conduits are the two main types of
elements in a drainage network model. Necessary data includes inflows, outflows, shapes and
depths of conduits, invert elevation, roughness coefficient, etc. The value of these has been
4 Storm Water Management Model Version 5.1, Release 5.1.011. www.epa.gov/swmm
15
determined by previous calculation, online information and field measurement. These values can
be found in Appendix D.
During the field trip, an important potential cause of flooding was identified: short
“choke” points or bottlenecks in the channel. It can be observed from the pattern of visible
sediment and debris that the overtopping of water always happens at a choke point. At these
constrictions in the channel, (through narrowing width and/or decreasing depth) the water must
“back up” to clear the constriction. In such case, the water may no longer be able to clear the
choke point without overflow. Detailed discussion of this phenomenon can be found in Appendix
C. The four potential choke points identified during the site visit, these are caused by fallen
branches and rocks, or a rising unlined section bottom reducing the section area.
In SWMM, each choke point was modeled as a five-foot-long conduit. In total, the model
is made up of ten junctions, six conduits, four choke points and one outfall. Nodes including nine
junctions and an outfall are marked from upstream to downstream as A to K, and conduits are
marked from upstream to downstream as 1 to 10 (see figure 10). Runoff inflow hydrographs for
each junction are expressed in the form of triangular 3-point time series (starting time, time to get
the peak inflow, ending time). Based on the theory of the SCS hydrograph5, the length of time from peak inflow to the ending time is 1.67 times that from the start to the peak inflow, which is
1.1 tc. The shape of each part of the conduit was measured by Pete Kolsky, Sally Hoyt and me during the field trip. The length of the channel can be measured in ArcGIS, and upstream and
downstream elevations for each reach can also be found on ArcGIS website. The use of ArcGIS
for invert elevations is a fundamental limitation of this study’s analyses, and a detailed
5 Chow, V.T., Maidment, D.R., and Mays, L.W. (1988). Applied Hydrology. Chapter 7, subsection SCS
16
survey of the channel must be undertaken prior to any final decision on interventions. For the
simulation options in SWMM, routing model is selected to be dynamic wave and routing time
step is 15 seconds. As the water through the channel will go to a culvert which is connected to
another downstream conduit, and finally will be drained into Bolin Creek, a downstream
boundary condition must be established at the outfall type of the channel, and this is set to be a
free discharge type. The boundary is set at the downstream end of the culvert. , It was noted
during the field trip that the culvert invert is higher than the invert of the upstream channel, if the
installation of a new culvert results in the invert of the culvert being lower than the downstream
channel, then it will affect the free discharge outfall result.
SWMM reports flooding and its location on both a Status Report and the Summary
Result. The Summary Result of the existing conduits shows flooding at Junction H shown in
Figure 10. Besides, based on the observation of the profile plot of the model, Junction I is
17
Figure 10: Junction Points and Conduits Schematic
Combining the SWMM simulation result with field observations, Junction B, F, H, I, as
well as the clogged culvert at the downstream end are the five problematic locations of the site.
The invert elevation of the culvert is found to be higher than the upstream channel invert
elevation, trapping sediment upstream of the culvert, which will easily lead to clogging in the
culvert. Further information will be introduced in the following chapters.
Location Characteristics of Problem
B Clogged Junction
F Clogged Junction
H Overflow Junction
I Clogged Junction
K Clogged Culvert
18
19
CHAPTER 3: TECHNICAL OPTIONS ANALYSIS
Introduction
In this chapter, a set of technical options are proposed to eliminate the causes of flooding
at Sheps Center. These options were developed to address problems identified in previous
chapters. The evaluation of technical options is based on several criteria, including the SWMM
model performance of each option. All the options are described in detail below, and their
relative advantages and disadvantages are discussed and compared to develop final
recommendations.
Technical Options
In the previous chapter, we found that the main causes of the flooding appear to be
various capacity constraints in the existing drainage network and include: clogged diversion pipe
inlet 121-D-017, poor performance at the downstream culvert and potential choke points in the
channel. Considering these constraints, six technical options were developed; (1) fixing choke
points, (2) improving the diversion capacity of the pipe inlet 121-D-017, (3) increasing the
size/section of the open channel, (4) replacing the downstream culvert, (5) building or modifying
the open channel sidewalls, (6) preventing rocks and broken branches flowing or falling into the
open channel, and (7) doing nothing.
Option 3, increasing the size of the open channel, making it wider and deeper, can
improve its capacity to handle more runoff; this method can be regarded as the most
straightforward way to address the capacity problem. The downstream reach of the channel is
20
a more targeted approach compared to enlarging the size. As the overtopping of water was
always observed at choke points of the channel during a field visit, it can be more efficient and
cheaper to clear the debris which block the water flow in the channel, and ensure that the section
at the choke point is modified to be the same as the channel immediately upstream.
Option 2, consists of improving the performance of the upstream diversion pipe inlet, and
reducing the entry of blocking materials (branches, rocks) into the drainage network. There are
two possibilities, (a) design a protective cover/protection structure for the pipe inlet, and (b)
increase the inlet size. A protective screen should consist of vertical gratings, or wire screen with
sufficient open space to filter the debris which blocks the inlet, set on the upstream side of the
pipe inlet. A disadvantage is that there are few examples from which to draw, and uncertainty
about its effectiveness and reliability.
Expansion of the diversion inlet at the upstream end of the channel will require
excavation around the drainage inlet (details can be seen in figure 12). This option will also
require frequent maintenance and temporary flooding may occur. A shaped rock doughnut inlet
protection (figure 13) can be another choice, certain size of rocks are piled up like a doughnut
shape around the inlet, however in this condition, water flow through the pipe inlet will meet the
resistance of the rocks. Just putting some big stones closely around the inlet which is already
21
Figure 12: Excavated Drop Inlet Protection6
Figure 13: Plan View of a Rock Doughnut Inlet Protection6
Option 5, building stronger sidewalls is an option in order to prevent the shape of the
open channel section from collapse or erosion by water flow. Some choke points occur mainly
because of the unstable sidewall of the channel. Various materials like concrete lining or rip-rap
can be considered as choices for the sidewalls.
For option 6, a sheet of mesh or series of grates assembled on the side near the hill is
another thought to ensure the normal function of the open channel, but will also be subject to
clogging, which will limit inflow from the tributary area. Field observation showed that the slope
6 NC Department of Environmental Quality 2006, Erosion and Sediment Control Planning and Design Manual.
22
of the hill is great enough to let the debris on the hill roll down into the channel, so such a
protective design for the open channel is reasonable.
SWMM Method for analysis of options
In this study, SWMM was used for the hydraulic modeling. Different hydraulic results
will be shown based on different assumptions about the channel. Basic parameters, data of the
open channel and the runoff data are introduced in chapter two, and these data can be applied in
hydraulic model performance testing. All the detailed information can be found in Appendix D.
Considering the technical options mentioned above, four district situations need to be
simulated, (1) a model without choke points, (2) pipe inlet 121-D-017 can operate properly
diverting all the upstream water in the channel into the drainage system, (3) downstream reach
size being increased, and (4) downstream culvert being replaced. Option 5 (better sidewalls) and
6 (debris retention/exclusion) cannot be analyzed in SWMM directly since the simulation data
cannot be determined correctly.
The hydraulic analyses will be done in the order of increasing likely cost and complexity,
so simulating the model without choke points, option 1 is the first step. SWMM simulation result
shows that in this case, the node flooding and node surcharge no longer exist, but the flooding
still appears in the downstream reach of the channel. When choke points are eliminated, the only
reach that needs to be fixed after removing all of the choke points is Conduit 5, shown in Figure
23
Figure 14: Identification of the Location of Conduit 5 (Reach E-F)
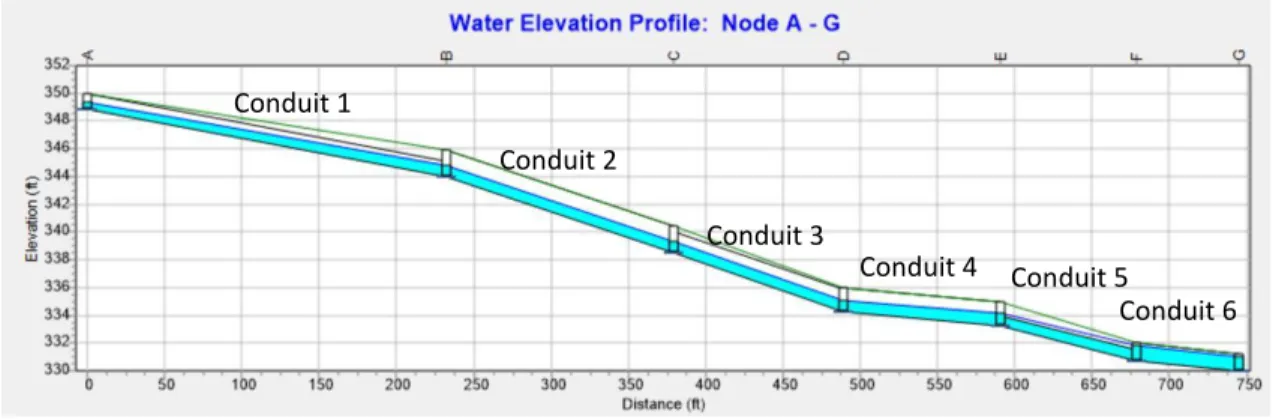
Figure 15:Profile Plot for the Hydraulic Condition of Option 1 in SWMM
Conduit 1
Conduit 2
Conduit 3
Conduit 4 Conduit 5
24
Option 2, pipe inlet protection work is another operation, if the pipe diversion inlet
performed as intended, all the runoff from the upstream catchment area would go through the
inlet and be drained to the piped storm water drainage system, reducing the capacity requirement
of the open channel by approximately 20%. As a result, node inflow is greatly reduced and the
risk of flooding is also decreased. In SWMM, the result of the model excluding the upstream
inflow only shows overflow at the choke point indicated in Figure 10 as the reach between
Junction I and J, which means dredging and protecting the pipe diversion inlet is an effective
method.
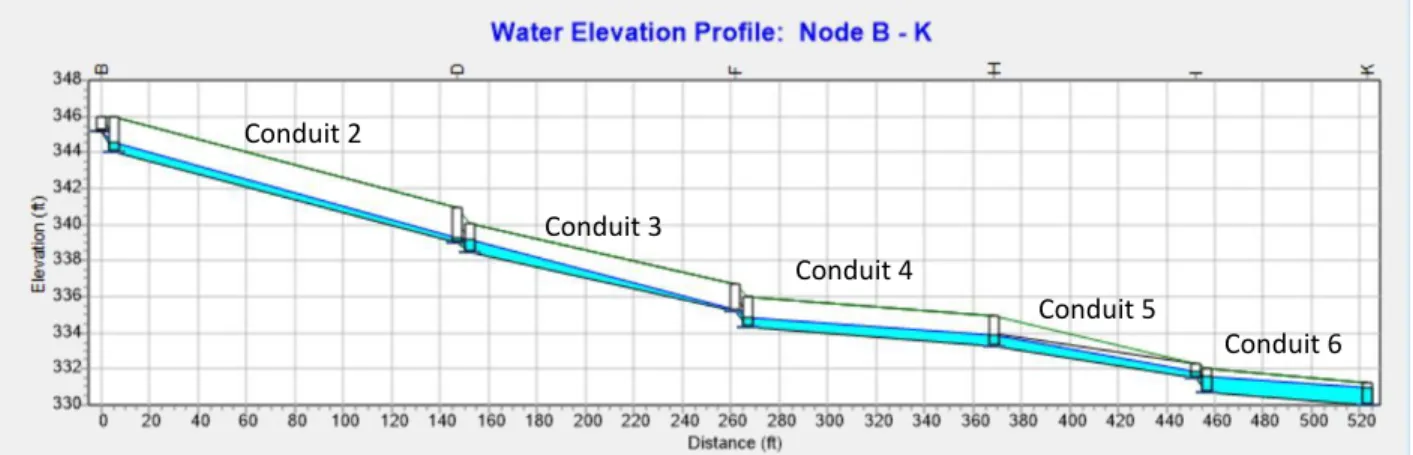
Figure 16: Profile Plot for the Hydraulic Condition of Option 2 in SWMM
Option 3, increasing the size of the channel is a straight forward method to address the
flooding problem. From the simulation of Option 1, it shows the only channel overflow happen in
Conduit 5 (see figure 15) despite of the choke points. So once the depth of Conduit 5 is increased
from 9 inches to 15 inches, and also increase the depth of its downstream conduit which is
described as Conduit 6, from 15 inches to 21 inches, the result of SWMM shows that the channel
overflow is avoided.
Conduit 2
Conduit 3
Conduit 4
Conduit 5
25
Figure 17: Profile Plot for the Hydraulic Condition of Option 3 in SWMM
Option 4, replacing the clogged downstream culvert, and setting its elevation so that its
invert is below the invert of all of the upstream channel would reduce sediment and debris
buildup in the channel. The simulation results, however, show that only making this change is
insufficient to avert upstream flooding. Summary results for all these simulation in SWMM can
be found in Appendix D.
Figure 18: Profile Plot for the Hydraulic Condition of Option 4 in SWMM
Once the four options mentioned above were combined, both channel overflow and node
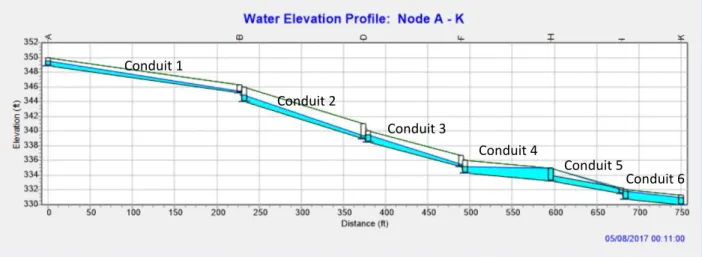
surcharge can be avoided in SWMM. Below is the water elevation profile.
Conduit 1
Conduit 2
Conduit 5 Conduit 3
Conduit 4
Conduit 6
Conduit 1
Conduit 2
Conduit 4
Conduit 5
26
Figure 19: Profile Plot for the Hydraulic Condition after Implementation of Sheps Center in SWMM
As most of the open channel still maintains a regular shape which is found during the
field visit, and the sidewall is still strong enough, it is not necessary to provide lining or sideslope
protection all along the conduit, so the option 5 will not be moved forward for further discussion.
And as option 6 (debris retention on tributary inflow) does not have enough construction
example, and is less practicable, it is also been dropped for now. From the hydraulic model, and
consultation with Sally Hoyt and Pete Kolsky, the four practical technical options which should
be compared include (1) increasing the open channel section, (2) fixing choke points, (3)
improving the function of the pipe diversion inlet 121-D-017, (4) replacing the downstream
culvert, and (7) doing nothing.
Explanation of Criteria
The five options will be compared using five major criteria: (1) effectiveness to address
the potential of flooding, (2) cost and ease of the implementation, (3) disruption during
construction, (4) reliability and maintenance needed, and (5) environmental impact.
Conduit 1
Conduit 2
Conduit 3
Conduit 4
Conduit 5
27
The effectiveness criterion describes the ability of each option to address the flooding
problem. A favorable ranking means the option can prevent most of the flooding and overflow of
the open channel, a medium ranking means it can prevent some of the flooding and overflow, and
an unfavorable ranking means it can do little help to improve the performance of the open
channel.
The cost and ease of implementation criterion shows the amount of funding and
manpower needed to implement the options. A favorable ranking means the implementation can
be done in-house by UNC Facilities Service staff and costs no more than $10,000, a medium
ranking means the option will cost from $10,000 to $20,000, and an unfavorable ranking means
the cost of the option will exceed $20,000.
The disruption criterion shows the potential impact to the employees and visitors in Sheps
building, as well as nearby traffic, during the construction period. A favorable ranking means it
will generate little disruption to the indoor staff and traffic, a medium ranking means it will have
some disruption to those people and traffic, and an unfavorable ranking means the construction of
the option will affect the regular work and life of the people in Sheps building or/and nearby
traffic.
The reliability criterion describes the likelihood of system failure in performance. A
favorable ranking means the option is very reliable, and is not subject to a major risk of failure in
everyday operation (e.g. from leaves and debris). A medium ranking means there is some risk of
failure during operation, probably requiring more frequent maintenance. An unfavorable ranking
means the option is very vulnerable to failure during routing operation, and/or frequent
28
The last criterion is environmental impact, which describe the amount of impact to local
environment made by the technical options. A favorable ranking means the option will produce
little impact to local environment, a medium ranking means it will generate some impact to local
environment and an unfavorable ranking means if will have great impact to local environment.
Comparison of Technical Options
Each option was rated high, medium or low in each criterion. The result is shown in the
Table 6 below. Different colors are used to separate different rankings visually. Green shows the
favorable ranking in each criterion, yellow the medium and red the unfavorable.
Option
Number
Options Effectiveness Cost and ease of
implementation Reliability & maintenance Environmen tal Impact Disruption
1 Choke Point Favorable Favorable Medium Favorable Favorable
2 Inlet Protection Medium Favorable Unfavorable Favorable Favorable
3 Enlarging
Channel Size
Favorable Favorable Medium Favorable Favorable
4 Culvert
Replacement
Medium Medium Medium Favorable Unfavorable
7 Doing Nothing Unfavorable Unfavorable Unfavorable Unfavorable Unfavorable
Table 6: Criteria for Technical Options for the Sheps Center Project
The first option is fixing the choke points of the open channel. According to the SWMM
result, it has great impact on reducing flooding and overflow possibilities in wet weather, so it
29
easy as it just focuses on small, critical areas, so little machinery and labor needed during
construction. The cost and ease of implementation can also have a favorable ranking. Part of the
first floor of Sheps building is used as a parking lot, as the office space is elevated-above the
parking area. From the plan view, each of the four choke point has a distance of at least 35 ft to
the traffic, so the disruption can be regarded as low. Once the choke points are fixed, regular
check and cleaning of the channel is required; its reliability remains to be seen, so a medium
ranking is made in this criterion. In fixing the choke points, the cutting down of only a few tree
roots and dead branches will have a slight environmental impact, so it can also get a favorable
ranking.
The second option is adding protections to the pipe inlet. This option has an optimal result
as modeled in SWMM, but the actual performance cannot be so ideal. Literally, by checking the
capacity of the inlet, all the runoff in the upstream catchment area is diverted to the piped
network by this inlet performing effectively. If this were the case, SWMM results show that the
flooding and overflow would decrease a lot, but outflow will still occur in the choke points. As a
result, the effectiveness of this method is determined to be “medium”. For the construction,
adding vertical gratings or wire screen, excavating around the pipe diversion inlet or a shaped
rock doughnut inlet protection would not generate a large amount of expense, and would be easy
to implement. Its disruption is minimal due to the pipe inlet location. A vertical wire screen or
expanding excavated area is usually treated as a temporary method for pipe diversion inlet
protection, and screening are subject to clogging, so the reliability could be a problem, and
frequent maintenance is also necessary. There is no additional disruption to the vegetation so its
30
The third option is increasing the size of the open channel. Considering the existing
situation, it is not reasonable to enlarge the section without fixing the choke points, so this option
assumes that the choke points have already been fixed. Thus the effectiveness of this option as
modeled by the SWMM is great. From previous analysis, only the downstream part of the
conduit need to be enlarged, so it would not cost much and would be easy to implement. By the
same reasoning, it is considered to have little disruption. Its reliability may not be optimal, since
blocking of the channel seems to occur easily at this part of the conduit due to the hill and large
amount of inflow, unless additional protection is provided. There is only minor root-cutting
needed, so its environmental impact, just like the former two options is minimal.
The fourth option is the replacement of the culvert. Although this option can only provide
limited help to solve the overflow in the upstream part of the channel based on SWMM, it is
necessary to re-lay the culvert to address building up debris in the channel. So for the
effectiveness, this method has a medium ranking. This culvert is installed under Greene Street,
demolition, excavation and a new culvert are needed in operation, so the cost and ease of
implementation will reach to a medium level. And according to its troublesome location, road
closure is needed for Greene Street, so it will have an inevitable disruption to the traffic. The
noise generated during the construction may also have negative impact to the employees in Sheps
building, so its overall disruption is in an unfavorable level. Once a proper size of culvert is
installed, it is reliable and but still need some maintenance, clearing and cleaning of debris may
be a frequent task. Besides, this method can get a favorable ranking in environmental impact
criteria.
The last option is doing nothing. Since the problem of flooding exists, doing nothing is
31
of real costs for the damage made by flooding, such as the parking problem cost and regular
maintenance cost for each storm which has a one-year return period or of a greater size.
Disruption remains a problem since the parking lots will suffer flooding whenever an event
32
CHAPTER 4: RECOMMENDED SOLUTION
Introduction
According to the analysis of a set of technical options, each option can only solve part of
the problem, so a combination of the four options was determined to be the best recommended
solution to this project.
Choke Points
The first part of the solution is fixing the choke points of the open channel. To achieve the
target, there are two steps to be taken: cleaning sediment and debris accumulated in the choke
points, and increasing the section of the choke points to the same as the upstream channel. The
schematic of the choke points can be seen in Appendix D.
Inlet Protection
A simple implementation for the pipe diversion inlet protection would help improve the
hydraulic performance of the channel. In the evaluation of the three inlet protection solutions,
installing a mesh-wire screen is the best option; the screen is used to prevent sediment, gravel and
other debris from entering the pipe diversion inlet. Digging excavated area needs some follow-up
actions including the modification of the corresponding channel size, and frequent maintenance is
needed. For the screen option, a wire-mesh screen will be installed around the perimeter of the
horizontal rectangular grate inlet. The reliability of this option will need to be monitored, and
33
Increasing the Channel Size
The second part of the solution is increasing the channel size. This work follows the
choke points improvement, so only the part of conduit where overflow occurs and its downstream
conduit need to be enlarged. From field observation, sediment is built up in this part of the
conduit, while the width of this part was not affected very much excluding the choke points. So
digging deeper is all that is required for this method. The channel with a proper size can provide
enough capacity to handle the upstream inflow, thus overflow of the conduit can be avoided.
Culvert Replacement
Culvert replacement is the final part of the solution. Although the ranking of this method
in previous comparison shows some weaknesses, it is still an effective option in preventing the
southern parking lot from suffering flooding problem.
The problem of the current culvert is not only the clogged condition, but also the
improper installation position. Once the sediment in the channel connected to the culvert is
cleaned, there will be an uphill slope before entering the culvert, which means the lowest point
from the start of the open channel to the culvert is not the entrance of the culvert. In this case,
sediment and debris will be accumulated at the lowest point of the conduit, which will eventually
reduce the hydraulic capacity of its upstream reach. For the time that the velocity of storm water
is great enough, these gravel or debris will be brought to the culvert and lead to blockage in the
culvert. For the implementation, the upstream end of the new culvert should be placed one foot
34
lower than any part of the conduit, while the downstream end can maintain its original position.
So the conduit at the downstream end of the culvert does not need to be dug deeper to fit the new
placement of the culvert. But as the invert elevations data of the culvert is from ArcGIS online
contour, these should be field checked. As noted earlier, the use of ArcGIS for invert elevations
is a fundamental limitation of this study’s analyses, and a detailed field-survey of the channel
must be undertaken prior to any final decision on interventions. The analyses presented in this
report are likely to have identified the nature and location of the main causes of flooding
problems, and are a basis for preliminary decision-making. However, a detailed field survey is
needed before the design work. If the downstream end of the culvert has to be lower, this will
also require lowering all the way to the next inlet.
Because the culvert is under Greene Street, which is a Town of Chapel Hill road, the town
would undertake the culvert repair.
35
CHAPTER 5: IMPLEMENTATION PLAN
Introduction
The implementation plan for the recommended solution describes the administration
requirements and approval process, scheduling, disruption minimization, resource requirements,
long-term operation and maintenance, technical problems, and costs. The information about
reviews and approvals for stormwater projects was provided by Sally Hoyt in the meeting on July
5th, 2017. The approval process of the project should be considered first, as it can provide a reference for making an implementation schedule. Estimation of the resource requirements,
including long-term operation and maintenance is the next step as construction plan is
determined. Some technical problems might be generated during the plan, and will need to be
discussed. The total cost estimates will be based on all this information.
Reviews and Approvals Process
The approvals required for this stormwater project depend on the answers to the following
questions: (1) Does the work involve a Town of Chapel Hill Road? (2) Does the work involve an
NCDOT road? (3) Does the project area include a water or sewer line? (4) Does the project area
include steam, chilled water, or electric conduit? (5) Is the landscaping being changed? (6) Will
the project impact parking or campus driveways/road?
From the solution introduced in the previous chapter, this project involves a Town of
Chapel Hill Road, which is Greene Street. However, the Greene Street portion of the project
would be conducted by the town. A water line and two secondary underground electric conduits
36
involving stormwater at UNC need approval from the UNC Stormwater Engineer. For the
reasons outlined above, approvals are also required from Town of Chapel Hill, OWASA, UNC
Electric Distribution Systems, and UNC Parking & Transportation.
Based on the information provided by Sally Hoyt, projects that cost no more than
$300,000 only need approval from UNC staff. Additional information indicates that the project
design will be managed by UNC Engineering Services, and construction will be managed by
UNC Construction Service, who must bid the project for construction.
Scheduling
The schedule of the project consists of three parts, bidding the project, awarding the
contract and the construction. Preparation before construction starting can require considerable
time. Documents for bidding need to be professional and well prepared after design, several
departments need time to review and approve the project, and then the contract can be bid. It
usually takes one month for contractors to develop bids, and then another month to award the
contract and start work.
Although the construction for the channel and the culvert can be performed separately by
different groups at the same time, it still makes sense to assume one month for construction. As it
is an outdoor project, weather can be an important factor. The construction needs to be paused or
37
Public Disruption
For this project, the major part of public disruption is the construction on Greene Street,
which will affect pedestrian traffic as well as vehicles. As the construction can be staged, one
lane of Greene Street can open for the traffic, which means detours can be avoided. During the
construction, lane closure signs should be placed on both sides. The function of the parking lots
of Sheps Center will not be affected by this project, while the exit of northern parking lot to
Greene Street might be blocked for some time.
Resources Requirements
As the work of fixing the open channel is mostly excavation, not much material is
required. The resources required for the culvert replacement include a new culvert under Greene
Street, compacted ABC stones as filling material, asphalt as road paving material, and backfill.
Labor, operation tools, and equipment including trucks are also needed as resources for the
project.
The size and material of the new culvert do not need changes, it can be just the same as
the old one, a 15 inches RCP, it just needs to be placed one foot deeper. Besides, wire screen and
four steel posts are needed for the inlet protection. As the reliability of the inlet protection method
38
Long-Term Operation & Maintenance
The inspection of the pipe inlet should be done once a month, or after every storm event.
It is also a good idea to inspect the location of the fixed choke points after each significant
rainfall event. Based on investigation, the hourly rate for a maintenance technician is
approximately $40, as the inspection period will take one hour or less, labor cost of O & M fees
is computed to be $480/year. Once problems are detected, additional costs for repair is needed.
These are counted at $100/year, so the total annual O & M cost of the project is computed to be
$580.
Technical Problems
The project for Sheps Center is an outdoor project, so the two factors need to be taken
into consideration are weather and unexpected accident. Bad weather including rainy can extend
the process of construction, especially for a storm water project. For the project work on the
street which disrupts the regular traffic, the closure of the lane on Greene Street will increase the
risk of car accident. An unexpected accident may require extra labor and time spent on it.
Another kind of possible accident is landslide, which could significantly affect the contract
implementation and cost.
Costs
The cost of this project consists of capital cost and long-term operation and maintenance
39
cost of this part is separated out. From Table 7, the capital cost of the channel portion of the
project based on data in 2013 is about $15,747.
Item Quantity Unit Unit cost ($) Total cost ($) Note
Earthwork
Excavation 20 CY 20.00 400 Soil, Debris
Erosion and sediment control Construction
entrance,
stabilized
1 Ea. 1,500.00 1,500
Inlet protection 1 Ea. 100.00 300 Inlet 121-D-017
Material and installation Drainage structure
Hardware cloth 1 Ea. 120.00 120
Steel post 4 Ea. 50.00 50
Site Management Utility
coordination
1 LS 2,500.00 2,500
Construction
survey
2 Day 1,100.00 2,200
Dump fees 2 CY 37.00 74
Subtotal 7,094
Construction Stakeout 354.7 (5% of subtotal)
Mobilization and demobilization 5,000 (10% of subtotal or $5,000,
whichever is greater)
Contingency 1,867.31 (15% of project)
CONSTRUCTION COST 14,316.01
CONST. ADMIN/UNC PM FEE 1,431.60 (10% of Construction cost)
TOTAL COST 15,747.61
40
Item Quantity Unit Unit cost ($) Total cost ($) Note
Earthwork
Demolition 1.48 CY 50.00 74 Road Surface
Excavation 12 CY 20.00 240 Soil, Debris and Pipe
Erosion and sediment control Construction
entrance,
stabilized
1 Ea. 1,500.00 1,500
Inlet protection 2 Ea. 100.00 200 Inlet 121-D-017 and Two
Inlets of the Culvert
Material and installation Drainage structure
New 15’’ RCP 20 LF 65.00 1,300
Roadway
Asphalt 2.53 Tons 135.00 341.55
ABC Stone 20.72 Tons 35.00 725.2
Site Management Utility
coordination
1 LS 2,500.00 2,500
Construction
survey
2 Day 1,100.00 2,200
Dump fees 2 CY 37.00 74
Subtotal 9,474.75
Construction Stakeout 473.73 (5% of subtotal)
Mobilization and demobilization 5,000 (10% of subtotal or $5,000,
whichever is greater)
Contingency 2,242.27 (15% of project)
CONSTRUCTION COST 17,190.76
CONST. ADMIN/UNC PM FEE 1,719.08 (10% of Construction cost)
TOTAL COST 18,909.41
Table 8: Cost Estimation for the Greene Street Portion of the Project (based on data in 2013)
This cost estimation is based on a project in 2013, historical cost indexes are introduced to
adjust the cost. The equation is:
Index for Year A
Cost in Year B Cost in Year A
41
From the index table provided by Sally Hoyt, index 2017 is 208.5 and index 2013 is
201.2, so the capital cost for the project in 2017 is calculated to be $14,831.02.
208.5
15747.61=16318.97 201.2
For the Net Present Value (NPV) of costs calculation, the following equation is used.
(1 ) 1
= *[ ]
(1 )
n n
i
NPV CC A
i i
Where CC = capital cost i = interest rate A = O & M fees
In this case, capital cost of the project is calculated to be $16,318.97, annual O & M fees
is $580, and the interest rate for a 50-year period is 2%. Then the NPV of costs is computed to be
$34,544.64.
50 50
(1 0.02) 1
16318.97 580*[ ]=34544.64
0.02(1 0.02)
Different rates of interest will generate different value of NPV, NPV cost will decrease
with the increasing interest rate as show in the Figure below. The sensitivity analysis for NPV
42
43
APPENDICES
Appendix A: Rainfall Data
Table9: Precipitation Frequency Estimates (in inches) (NOAA, 2013)
To get an Intensity-Duration-Frequency Curve, precipitation data should be transferred
from depth to intensity.
Table 10: Precipitation Frequency Estimates (in inches/hour) (NOAA, 2013)
7 Partial Duration Series
PDS7-BASED PRECIPITATION FREQUENCY ESTIMATES ((IN INCHES)
DURATION Average Recurrence Interval (in years)
1 2 5 10 25 50 100
5-MIN 0.411 0.484 0.558 0.615 0.676 0.718 0.756
10-MIN 0.657 0.774 0.893 0.984 1.08 1.14 1.20
15-MIN 0.821 0.973 1.13 1.25 1.37 1.45 1.52
30-MIN 1.13 1.35 1.61 1.80 2.02 2.18 2.33
60-MIN 1.40 1.69 2.06 2.35 2.69 2.95 3.20
2-HR 1.68 2.03 2.49 2.87 3.33 3.70 4.05
3-HR 1.79 2.16 2.66 3.08 3.61 4.04 4.46
6-HR 2.15 2.59 3.20 3.71 4.37 4.92 5.47
12-HR 2.54 3.06 3.80 4.44 5.28 5.99 6.71
24-HR 2.96 3.58 4.47 5.17 6.11 6.86 7.62
PDS-BASED INTENSITY FREQUENCY ESTIMATES ((IN INCHES/HR)
DURATION Average Recurrence Interval (in years)
1 2 5 10 25 50 100
5-MIN 4.93 5.81 6.70 7.38 8.11 8.62 9.07
10-MIN 3.94 4.64 5.36 5.90 6.46 6.86 7.21
15-MIN 3.28 3.89 4.52 4.98 5.46 5.79 6.07
30-MIN 2.25 2.69 3.21 3.61 4.04 4.36 4.65
60-MIN 1.40 1.69 2.06 2.35 2.69 2.95 3.20
2-HR 0.840 1.02 1.25 1.44 1.67 1.85 2.03
3-HR 0.597 0.720 0.887 1.03 1.20 1.35 1.49
6-HR 0.359 0.433 0.534 0.62 0.730 0.821 0.913
12-HR 0.211 0.254 0.316 0.368 0.438 0.497 0.557
44
45
Appendix B: Rational Method and Conduit Sizing
The rational method is considered as a simple technique in estimating the hydraulic
discharge. It was developed by Kuichling for small drainage system (Thompson, 2006). In this
report, the rational method was applied in both SWMM simulation and channel capacities check.
Here is the rational method equation:
QCiA
Where Q = peak rate of runoff (in cfs)
C = runoff coefficient
i = rainfall intensity (in inches/hour)
A = catchment area (in acres)
For SWMM simulation, the inflow data for each node is required to be calculated by the
rational method, following is the detailed description.
Subcatchment Area Area (in acres)
a 3.17
b 0.98
c 0.65
d 0.53
e 0.42
f 0.22
Total 5.97
Table 11: Subcatchment Area Data
Based on the divided tributary area, time of concentration can be determined by the
overflow distance, ground character and ground slope of each area. The schematic from the 3rd edition of the book WATER SUPPLY and WASTEWATER REMOVAL below shows the
46
Figure 22: Schematic for Inlet Time Determination (Shammas, Nazih K., 2011)
The overflow distance can be measured in the map from “inlet” to the farthest point of the
tributary area. Character of the ground can be observed by field trip, therefor a straight line can
be drawn and get an intersection point with the pivot line. Using these points and the slope
percentage value, inlet concentration time can be determined. Below is the table of concentration
time for each inlet’s local tributary area.
Junction Time (in minutes)
A 10.5
B 7.9
C 7.2
D 6.4
E 6.3
F 6.2
47
Rainfall intensity data can be found in IDF curves, a 10-year return period based on UNC
Design Guideline (2010) is applied, table 13 shows the rainfall intensity for each junction.
Junction Rainfall Intensity
(in inches/hr)
A 5.71
B 6.54
C 6.52
D 6.59
E 6.58
F 6.61
Table 13: Estimated Peak Inflow for each Junction
In this case, runoff coefficient of the site should be determined by the type of surface area
48
Figure 23: Runoff Coefficient Values (Haestad 2007, 142)
The total tributary area is measured to be 5.97 acres. The surface type of the tributary area
consists of 1.37 acres of paving or roofs of buildings, C value is 0.8. The rest of the area can be
regarded as grass-covered clay soil with slope 5%, C value is 0.2. So the overall C value of the
tributary area is:
1.37*0.8+4.60*0.2 / 5.97=0.34
49
For the individual runoff coefficient of each tributary area, it can be determined by its
own surface type, below is the table of runoff coefficient.
Subcatchment Area Runoff Coefficient
a 0.44
b 0.23
c 0.35
d 0.22
e 0.23
f 0.18
Table 14: Runoff coefficient for each tributary area
Once the values of runoff coefficient, rainfall intensity and area are determined, the
inflow data for each node in SWMM simulation can be calculated.
Junction Runoff Coefficient Intensity (in/hr) Included Area (in acres) Inflow (in cfs)
A 0.44 5.71 3.17 7.96
B 0.23 6.54 0.98 1.47
C 0.35 6.51 0.65 1.48
D 0.22 6.58 0.53 0.76
E 0.23 6.58 0.42 0.63
F 0.18 6.61 0.22 0.26
Table 15: Inflow data for each junction
Another application of the rational method is to check the capacity of each reach; it is
helpful to assess the normal flow capacity of each part of the conduit, and compare it with an
estimated flow to indicate whether the current size of the channel can handle the storm water. The
first step is to calculate the peak flow that each reach will take using the rational method. Unlike
the SWMM simulation, runoff coefficient, rainfall intensity and tributary area value is
determined for all the upstream tributary area of each reach. The methods for estimating C and
local areas are the same as described above for the SWMM model, but the intensity and flow
must be estimated from the cumulative time of concentration and tributary area upstream of each
50
For each junction, time of concentration equals to the sum of (a) the inlet time to the
entrance of the channel at Junction A, and (b) the travel time in the channel from Junction A to
the junction being considered.
Travel time in the channel is determine by the length of the channel and the velocity of
the water. While the length of the channel can be measured on the map, velocity of the water can
be calculated based on the Manning’s Equation:
2/3 1/2 1.49
( ) h
V R S
n
Where n = roughness of the conduit, approximately equal to 0.025 in this case
Rh = hydraulic radius, which can be expressed as A/P, P is the wetted perimeter of the conduit.
S = conduit slope
Then calculation of travel time is based on the following equation:
t L t
V
Table 16 below shows the value of these factors.
Conduit Reach Area (ft2) P (ft) Rh S V (ft/s) L (ft) tt (min)
1 A-B 3.07 5.0 0.62 0.02 5.72 227 0.67
2 B-C 7.29 8.8 0.83 0.04 10.6 147 0.23
3 C-D 4.63 7.2 0.65 0.04 8.34 114 0.23
4 D-E 4.74 6.1 0.78 0.02 6.90 107 0.26
5 E-F 1.79 4.4 0.41 0.02 5.07 83 0.27
51
Table 17 below shows the peak flow data for each reach.
Reach Time of
Concentration (min) Runoff Coefficient Intensity (in/hr) Combined Area (acres) Peak Flow (cfs)
A-B 10.5 0.44 5.71 3.17 7.96
B-C 11.2 0.40 5.62 4.15 9.33
C-D 11.4 0.39 5.61 4.80 10.5
D-E 11.6 0.37 5.58 5.33 11.0
E-F 11.9 0.36 5.54 5.75 11.5
F-G 12.2 0.35 5.49 5.97 11.5
Table 17: Peak flow data for each reach
The capacity of the reach can be calculated by assuming the reach flowing full under
Manning’s equation. If the peak inflow in table is less than the capacity of the conduit, it will lead
to flooding problem. The calculation of the reach capacity follows equation:
2/3 1/2 1.49
( ) h
Q AR S
n
Where A is the cross sectional area of the reach in square feet.
Table below shows the result of the capacity of each reach.
Reach Uniform Flow
Capacity (cfs)
Peak Flow by the Rational Method (cfs)
Peak Flow by SWMM (cfs)
A-B 17.6 7.96 7.96
B-C 77.3 9.33 8.84
C-D 38.7 10.5 14.3
D-E 32.8 11.0 10.2
E-F 9.13 11.5 10.7
F-G 14.2 11.5 8.87
Table 18: Capacity of each Reach
52
Appendix C: Choke Point Theory Calculation8
For the calculation about choke point theory, a rectangular section choke point is assumed
first, with depth of h, width of b, so the area of the section can be expressed as:
Ahb
And the water flow can be expressed as:
QVAVbh, then
Q V
hb
The energy of water ignoring the pressure head can be expressed as:
2 2 2 2 = 2 2 s v Q
E h h
g gh b
, while
2 2 2
Q
gb can be regarded as a constant K, then
2 s K E h h
The minimum allowable energy for water to pass the choke points can be expressed as Ec, from the above equations, we can get that when a section contracts, the width, b will decrease,
and then the constant K will increase. As a result, Ec will increase, requiring a greater value of h. This can lead to flooding at the choke points, and a significant backwater effect.
8 Henderson, F.M. (1966). Open Channel Flow. Chapter 2, The Energy Principle in Open Channel Flow, esp pp
53
Appendix D: SWMM Performance and Data
“The EPA Storm Water Management Model (SWMM) is a dynamic rainfall-runoff
simulation model used for single event or long-term (continuous) simulation of runoff quantity
and quality from primarily urban areas” (SWMM User’s Manual Version 5.1, 2015). It is a good
choice to simulate the storm event occurred on December 30th, 2015.
The three objects used in this simulation are conduit, junction and outfall. Figure 10 in
Chapter 2 is the background site map.
Those dots on the map represent junctions and the outfall, the long straight lines represent
reaches and the short lines represent choke points. All the nodes from the upstream end to the
downstream end are marked as Junction A to Outfall K, and the conduits and choke points from
the upstream end to the downstream end is marked as Conduit 1 to Conduit 10. Invert Elevation
of each nodes and the shape data of each conduits can be found in the table below, which is based
on ArcGIS online contours.
Junction Invert Elevation (in ft)
A 348.9
B 345.2
D 339.0
F 335.2
H 333.3
I 331.5
K 330.0
54
Conduit Shape Height
(ft)
Width (ft)
Left Slope (H:V)
Right Slope (H:V)
1 Rectangular 1.10 2.80 / /
2 Rectangular 0.79 3.38 / /
3 Triangular 1.96 7.42 / /
4 Trapezoidal 0.92 4 0.71 0.71
5 Triangular 1.54 6 / /
6 Trapezoidal 0.83 2.5 0.22 0.22
7 Trapezoidal 1.71 1.58 0.80 2.10
8 Triangular 0.75 4.78 / /
9 Trapezoidal 0.50 2.00 0.66 0.66
10 Triangular 1.25 5.50 / /
Table 20: Shape of each Conduit
Peak inflow data listed in Appendix B are imported to each node the mean of Time
Series. An example of Time Series data table and schematic can be seen below.
55
Figure 25: Time Series Schematic in SWMM
Eleven time series objects are created, each of them corresponding to the peak inflow of
seven junctions and four choke points. The inflows of choke points are determined as 5% of the
inflows of its connected reach.
Once all the required data is input into these objects, simulation is ready to be run. The
status report of this simulation is seen below:
EPA STORM WATER MANAGEMENT MODEL - VERSION 5.1 (Build 5.1.011) ---
********************************************************* NOTE: The summary statistics displayed in this report are
based on results found at every computational time step, not just on results from each reporting time step.
56
**************** Analysis Options **************** Flow Units ... CFS Process Models:
Rainfall/Runoff ... NO RDII ... NO Snowmelt ... NO Groundwater ... NO Flow Routing ... YES Ponding Allowed ... NO Water Quality ... NO
Flow Routing Method ... DYNWAVE Starting Date ... 05/08/2017 00:00:00 Ending Date ... 05/08/2017 06:00:00 Antecedent Dry Days ... 0.0
Report Time Step ... 00:00:30 Routing Time Step ... 30.00 sec Variable Time Step ... YES Maximum Trials ... 8 Number of Threads ... 1
Head Tolerance ... 0.005000 ft
57 Groundwater Inflow ... 0.000 0.000 RDII Inflow ... 0.000 0.000 External Inflow ... 0.289 0.094 External Outflow ... 0.287 0.093 Flooding Loss ... 0.001 0.000 Evaporation Loss ... 0.000 0.000 Exfiltration Loss ... 0.000 0.000 Initial Stored Volume .... 0.001 0.000 Final Stored Volume ... 0.002 0.001 Continuity Error (%) ... -0.134
*************************** Time-Step Critical Elements *************************** Link 9 (82.92%)
Link 8 (4.68%) Link 6 (1.72%)
******************************** Highest Flow Instability Indexes
******************************** Link 10 (14)
Link 9 (4) Link 4 (3) Link 6 (3) Link 5 (3)