•
Acknowledgments ... i
Abstract ... ii
Chapter 1: Introduction and Objective ... 2
Chapter 2: Literature Review ... 5
Chapter 3: Experimental Methodology ... 33
3.1 Laboratory Investigations- Supporting Studies 3.1.1 Analyte Recovery ... 33
3.1.2 Sorptive Capacity of the Carbon Trap ... 34
3.1.3 Analyte Loss from Activated Carbon Trap ... 3 6 3.2 Soil Vapor Sampling Method ... 37
3.3 Field Site Description ... 39
3.4 Field Sampling Procedures ... 41
3.4.1 Changes in Vapor Concentration Over Time .. 4 3 3.4.3 Effect of Depth on Vapor-Phase Concentration 43 3.4.4 Multi-Phase Contaminant Distribution ... 44
3.5 Analytical Methodology ... 45
3.5.1 GAC Extraction/Analysis Procedure ... 46
3.5.2 Target Compounds ... 47
3.5.3 Ground Water Extraction/Analysis Procedure. 48 3.5.4 Soil Extraction/Analysis Procedure ... 48
Chapter 4: Results and Discussion ... 50
4.1 Laboratory Analyses 4.1.1 Sorptive Capacity of Carbon Trap ... 50
4.1.2 Analyte Loss from Activated Carbon Trap ... 54
4.2 Gas Chromatographic Calibration of Target Compounds ... 55
4.3 Selection and Analysis of Target Compounds ... 55
4.4 Detection Limits of Target Compounds ... 62
4.5 Field Sample Analyses 4.5.1 Gasoline Vapor-Phase Concentration Contours at Camp Lejeune Site ... 64
4.5.2 Relationship of Vapor-Phase Concentrations to the NAPL... 72
4.5.3 Temporal Variation in Contaminant Concentations ... 76
4.6.2 Ground Water Vapor-Phase Distribution ... 85 4.7 Cost and Efficiency Comparison of Vapor-Phase
vs. Ground Water Assessment ... 88
Chapter 5: Conclusions ... 9 0
References ... 94
This project was funded by the North Carolina Water
Resources Research Institute under grant number 41790. I
would like to thank Drs. Francis Digiano and Cass T. Miller
for their support and insight into this project, Dr. Aziz
Amoozegar of North Carolina State University for the use of
the field augering equipment, and Randy Goodman for his
excellent construction of the sampling probe. Thanks also
go out to my friends and co-workers at Rosenau Hall for
making my stay an enjoyable and enlightening experience. Finally, I would like to give special thanks to my parents,
Martha and Joseph Wallingford for their everpresent love and
Abstract
Monitoring of contaminant vapors in the unsaturated
zone is a convenient method for detecting volatile organic
contaminants in the subsurface. This technique can be used
for optimizing the placement of monitoring and recovery
wells. The most common method uses a driveable ground probe
(DGP) to extract vapor sample followed by direct injection into a portable gas chromatograph (GC). However, many
regional offices of regulatory agencies do not have ready
access to such equipment. This research evaluates an
alternative method- the carbon adsorption method- in which
vapor is withdrawn by the DGP but concentrated on a small
activated carbon trap (150 mg). The carbon traps can be
returned to a central laboratory for solvent extraction and
GC analysis. This provides the advantage of a reduction in
field equipment and convenience of in-lab analyses (multiple
GC injections are possible) and also increased sensitivity
because any volume of soil vapor may be collected. A simple
DGP and carbon trap system was constructed and tested at a field site. Soil vapor concentrations of target compounds
to decrease in the direction of the ground surface as
expected. Measurements of target compounds in soil indicated
that the soil vapor contributed a large fraction of the total contaminant mass where a non aqueous phase layer (NAPL) had
been identified. As important is the rather uniform
contamination of soil outside the NAPL region. Finally, the
concentrations of target compounds in the soil vapor and ground water could be related in a manner roughly described
by a simple equilibrium model, although exceptions were
A majority of the existing underground gasoline storage
tanks were installed throughout the United States during the
1950's and 1960's. By some estimates these tanks have reached maximum life (18 years) and are now or may soon be
leaking (14). Those currently leaking are estimated to
number 75,000 to 100,000 (22). Those expected to leak in the next five years are estimated as 350,000 (41). Clearly,
leaking underground storage tanks (UST's) have been
identified as an important environmental concern.
The scope of technologies available for contaminant
detection and site assessment is beginning to be developed in
answer to this problem. Conventional investigative techniques employed for the evaluation of subsurface
contamination have been primarily limited to the installation
of groundwater monitoring wells and soil borings. These
methods are, however, inherently expensive and time
consuming. Moreover, given limited information, the initial locations of these monitoring points are seldomly sufficient
to assess site conditions. Sampling techniques and
volatile components, will partition significantly in the soil
atmosphere of the unsaturated zone. By using sampling
methods that collect soil vapors, the volatile fraction of
these multi-component compounds can be detected. Soil vapor
sampling affords a fast, economical avenue for detecting the
presence of leaked or spilled volatile contaminants.
Moreover, it can be used as a reconnaissance tool for
location of monitoring/recovery wells and soil borings. This
sampling method can also yield information regarding the
areal extent of contamination in the unsaturated and
capillary zones. Since contamination in these zones can
serve as a source of future groundwater contamination,
knowledge of the amount of this contamination is an important
criterion for the evaluation of long-term contaminant risk.
The objective of this research was to evaluate a
carbon sorption method for the measurement of gasoline vapors
in the unsaturated zone. This particular method involves a
driveable ground probe (DGP) to withdraw soil vapors for
collection/concentration on an activated carbon adsorbent.
The trapped vapors are then solvent desorbed and analyzed by
gas chromatography. This method was first described by
Thorburn et al. (44) and Colenutt and Davies (6) for the
detection of organic vapors in landfills, but has not been
thoroughly evaluated with regard to its applicability for the
for injection into a portable gas chromatograph. This
feature is a result of the ability to concentrate contaminant
vapors from a larger volume of the soil atmosphere. This volume-integrated sampling period also avoids the effects of
localized soil heterogeneities and thus a more accurate
measurement is obtained for delineating the areal extent of
2.1 Subsurface Contaminant Movement and Distribution
Immiscible organic liquids that have leaked from an UST percolate by gravitational forces through the unsaturated
zone in primarily a vertical direction. The rate of
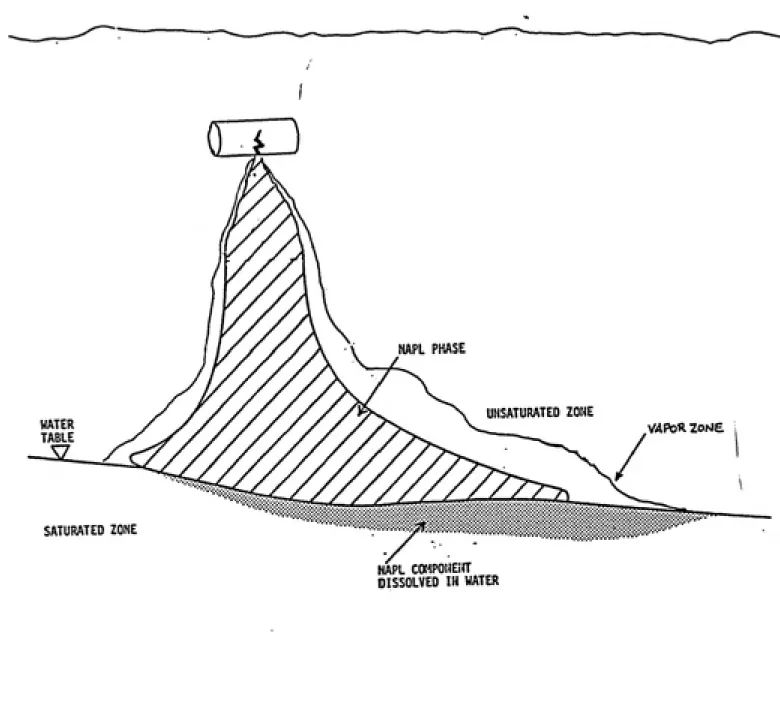
contaminant migration is largely determined by its density and viscosity (31). The amount of liquid retained by the porous media is dependent upon the height above the free liquid surface; the final distribution of contamination becomes an equilibrium condition between gravity and capillary forces (22). Figure 1 illustrates a typical
immiscible contaminant leak from a UST. Contaminants such as hydrocarbons (e.g. petroleum distillates), have specific
gravities as low as 0.7, and evidence exists as to the
"floating" of these and other such low density liquids on the
water table (31). For large spills, a local depression of the ground water table occurs as a result of the immiscible
UNSATURATED ZONE
WATER TABLE
VAPOR zone
SATURATED ZONE
NAPL COMPONEifT DISSOLVED IN WATER
Figure 1. Typical Gasoline Distribution from a Leaking
(partitioning) of some contaminant components into the adjacent groundwater may occur during this period.
2.1.1 Contaminant Sorptive Interactions
Sorption is a generic term that is used to describe the uptake of a compound (either vapor or solute) by soil,
without reference to a specific mechanism. Goring and
Haymaker indicate that organic compounds are sorbed onto soil particles by the following intermolecular forces: Van der Waals, London, hydrophobic repulsion, ion exchange, and hydrogen bonding (17). The mechanisms of sorption
include both partitioning (Van der Waals, London, hydrophobic repulsion) and adsorption (ion exchange, hydrogen bonding).
In adsorption, the adsorbate only occupies surficial sites on the adsorbent media. Chiou distinguishes adsorption into two categories: physical adsorption - chiefly Van der
Waals forces between adsorbate and adsorbent, and
"chemisorption" - adsorption related to chemical bonding forces (5). In contrast, partitioning refers to the dissolution or volatilization of sorbate into a phase by
solution forces (e.g. Van der Waals forces). The descriptive indicator of partitioning, the partitioning coefficient, is a function of the distribution of a compound between two
physical and chemical characteristics of both the soil and
the organic compounds involved.
In designing a sampling and analytical method for determining subsurface fate and transport of organic
contaminants, it is necessary to understand these processes
of sorption. Numerous studies have been made concerning the sorption of hydrophobic organic compounds in soil and
sediment systems. Many of these studies have shown the existence of a linear relationship between a compound's
sorption coefficient and soil organic carbon and octanol-water partitioning coefficients (25, 17, 4). Karikoff et al.
(25) researched hydrophobic contaminant interaction on sediments and reported that an estimate of sorptive
partitioning could be made using the organic carbon content of the soil (K ) and the octanol/water coefficient (K ) ofoc * ow the analyte. The authors found the functional relationship
between the organic carbon content of the soil, Koc, and the octanol-water partitioning coefficient of the organic solute,
Kow, to fit the empirical formula: log K ^ = log K „ - 0.21oc ow
Additional research by the authors confirmed this
relationship as a critical parameter to consider when estimating subsurface contaminant transport.
If, however, the soil has a very low organic carbon
be adsorption of the contaminant onto the mineral surface of the soil particles (18, 49, 21). Considering both of these
mechanisms of contaminant attenuation, the soil media can
probably best be described as a dual sorbent where the
mineral content acts as a conventional adsorbent and the
organic matter as a partitioning medium (5).
Moisture content has been shown to limit the sorptive capacity that soil has for certain organic compounds. Chiou et al. investigated the effects of soil humidity on the
sorptive mechanism and capacity for six aromatic compounds (4). Chiou's research data indicates that an increase in water vapor (relative humidity) sharply reduces the sorption uptake of organic vapors on unsaturated soils. This
reduction was attributed to adsorptive displacement by water on mineral surfaces. Since the relative humidity in the capillary fringe is higher than in the intermediate and soil zones, then the retentive capacity of this region would also be expectedly less. Thus, if the goal of vapor-phase
sampling in the unsaturated zone is to elucidate the
distribution relationship with the capillary and saturated zones, this phenomenon of moisture attenuation warrants
consideration.
As the contaminant mass is distributed in the
unsaturated and capillary zones, there is a concurrent
volatilization of organic compounds into the overlying pore spaces from this mass. The predominant mechanism for this contaminant distribution is gas-liquid partitioning.
Understanding this mechanism of volatile contaminant
distribution in unsaturated systems is necessary for valid
interpretation of soil vapor measurements obtained from
sampling in the unsaturated zone.
Partitioning from a liquid phase to a gaseous phase is termed volatilization. The degree of volatilization for a particular compound in a gas-liquid system can be described
by Henry's Law:
where C is compound concentration in the gas phase C, is compound concentration in the liquid phase
K, is Henry's Law constant
Henry's Law states, that in a dilute solution, the partial pressure of a solute is proportional to its concentration. Typical Henry's Law constants as well as other physical characteristics for selected components of gasoline are presented in Table 1. The high vapor pressures for most of
Table 1. Physical and Chemical Constants for Selected Gasoline Components
Benzene Toluene m-Xylene o-Xylene p-Xylene Molecular Weight | 78.12 92.14 106.17 106.17 106.17
(g/mol)
Specific Gravity
Henry's Law Constant (atm*m /moI)
Log Octanol-Water
Partition Coefficient
Vapor Pressure
(mm Hg a 20 C)
0.8765 0.8669 0.8642 0.8802 0.8611
5.5E-3 6.68E-3
1.86
76
Solubility in H 0 | 1780
(mg/l a20°C) I
2.46 3.20
22
150 200
5.27E-3
2.95
175
6.5
198
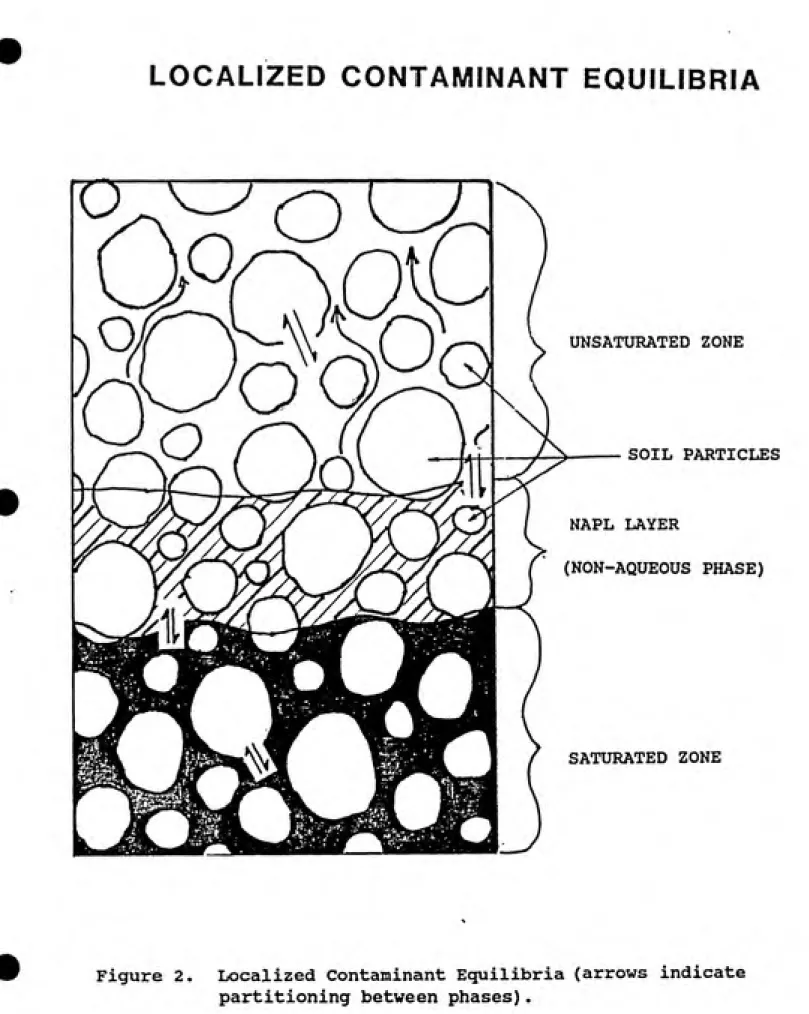
In the unsaturated zone, contaminants will partition
between the soil matrix, soil solution, and soil atmosphere
as illustrated in Figure 2. Gas/liquid/soil partitioning is
a measure of the tendency of these compounds to move into a
particular phase and is represented by the physio-chemical
functions termed partitioning coefficients. Henry's Law
constants are specific partitioning coefficients that can be
used to describe a linear partitioning relationship of the
contaminant between liquid and gaseous phases.
LOCALIZED CONTAMINANT EQUILIBRIA
Q
).
OQ
o
)
1
UNSATURATED ZONE
SOIL PARTICLES
NAPL LAYER
(NON-AQUEOUS PHASE)
SATURATED ZONE
Figure 2. Localized Contaminant Equilibria (arrows indicate
gaseous phase, assuming the two-phase system previously described. However, when a third phase (i.e. solid) is
introduced into the system, partitioning values must be derived for describing movement into this third phase from
the other two phases. This multi-phase problem is further complicated by the occurrence of biological and chemical
transformations if simulation of field conditions is desired
in a partitioning model. Considerable research attention has
been devoted to this multi-phase problem (24, 21, 38, 36),
yet it is clear that considerable work remains to be done.
Nevertheless, gross estimates of total contaminant mass can
be made if interphase equilibrium distributions and mass transfer rates are known or can be estimated using diffusion
and partitioning relationships.
The chief mechanism for mass transfer of volatilized
contaminants in the unsaturated zone is diffusion through
interstitial pore spaces of the soil. Assuming one
dimensional diffusion for simplicity, the concentration of contaminants in air as a function of time and distance, can be described by Pick's Second Law :
dC/dt = Dd^C/ dz^
where:
C is concentration of contaminant in air
Jury et al. indicate that for intermediate molecular weight compounds an estimated diffusion coefficient for a volatile
2
organic compound in air is 0.43 m /d (23). However, because
of the existence of a solid phase, this function cannot be applied to describe subsurface diffusion. Nevertheless, Jury
et al. derived a formula using Pick's Second Law for
estimating diffusion coefficients for volatile pesticides in soil (24). This diffusion formula accounts for the decreased
cross-sectional flow area and the increased length of travel due to increased tortuosity when compared to similar models
for air diffusion :
D^ = Da^O/V n2
where D^ is the diffusion coefficient in soil gas
D is the diffusion coefficient in air (e.g. 0.43 m /d)
a is the volumetric air content of the soil
n is total soil porosity
Experimental studies conducted by the authors indicate that
the coefficient for gaseous diffusion in soils is several
orders of magnitude greater than the liquid phase diffusion
coefficient (24).
The incorporation of Pick's Law and Henry's Law into a
mathematical model for describing volatile organic compound
behavior in soil can be seen in models developed by Jury et
2.2 Unsaturated Zone Monitoring
Detection of a leaking UST event has primarily been limited to the installation of groundwater monitoring wells
and soil borings. From these wells, a groundwater sample is
removed and analyzed by a procedure such as purge and trap
with subsequent GC/MS identification (46). The installation
of monitoring wells as a reconnaissance tool in order to
sample from the saturated zone can be both time consuming and
economically unfeasible. In response to these problems, an
increasing amount of research has been devoted to developing
faster and less expensive monitoring techniques. These newer
techniques have primarily focused on monitoring in the
unsaturated zone.
Two review articles by Everett et al. and Wilson discuss
several unsaturated zone sampling techniques, and thus serve
as good introductory reference sources (13, 47). The choice
of a suitable sampling methodology should be governed mainly
by the chemical nature (e.g., hydrophobicity, volatility) of
the suspected contaminant. Moreover, the type of sampling
matrix, required sampling volume, method simplicity and
reliability, and other additional sampling considerations are
important, as discussed by Everett et al. (13).
Unsaturated soil matrix sampling often is necessary for
monitoring hydrophobic, non-volatile contaminants such as
the soil solution or the soil atmosphere at appreciable concentrations. Obtaining samples from these latter phases
would prove inferior to a soil matrix sampling technique such
as soil boring. A tabulation of criteria for selection of
suitable soil solids sampling equipment is presented in an
American Petroleum Institute pxiblication (10) .
Contaminants that have an appreciable solubility in
water are often present in the soil solution in unsaturated soils. These compounds can be sampled with an apparatus such
as a vacuum lysimeter. Vacuum lysimetry removes available
water under capillary forces from the unsaturated zone, which
can subsequently be analyzed by conventional aqueous methods.
Unfortunately, this method often results in an inadequate sample volume because of the inability of the vaccuum pump to
withdraw water held under strong hygroscopic and capillary
forces.
For situations where the contaminant is of a volatile
nature, soil vapor-phase sampling in the unsaturated zone is
a viable alternative. Previous investigations into soil
vapor-phase sampling have produced many techniques potentially
applicable to leaking UST detection and assessment. A state
of the art review of shallow soil vapor-phase detection
methods for hydrocarbons is compiled in an API publication
(10). This literature search separates the unsaturated zone
sampling techniques into five categories: (1) grab sampling
of soil cores, (2) surface flux chambers, (3) downhole flux
These techniques are discussed below.
2.2.1 Grab Sampling
Grab sampling of soil cores involves obtaining a soil core by augering or hydraulically driving a tube into the suspected area of contamination. The removed cores are
sealed, allowing a minimal volume of headspace.
Subsequently, the remaining headspace gas is evacuated by the
introduction of an inert carrier gas and the outflow is
analyzed by gas chromatography. A comparison of three soil core analytical techniques by Slater et al. illustrates
typical methodologies involved in grab sampling (40). Figure
3 illustrates the apparatus used by Slater et.al. to desorb
contaminant vapors from soil cores. Unfortunately, spike and recovery experiments for the three organic analytes yielded
highly variable recoveries ranging from 42.56% to 164.40%.
Grab sampling of soil cores offers the advantages of being
simple, inexpensive, and quick. The main disadvantage is
that adsorbed contaminants, and those associated with bound
water are measured in addition to contaminants present in the
interstitial pore spaces of the soil; thus phase
distributional information is lost. Adsorbed contaminants
are desorbed from the soil using a continuous carrier gas
flow to create a concentration gradient which favors the
^/P^SS S^MPl/AlO
rose ~,
c
TO ^TM
CM/}PCOy^l COCtecr/A/a
ScProM-ͣ
:^^ppoM A/g r^A/k
ͣ
P£6UL/}TOR
^—-—CM>iPCo/^L P/i rep
^
F^m
-S£PTUA4
JyiP WITM TcPlOAJ IJAi'SO c/o
-/^c/JT/A/ii T/3Pif
—AJ; lA/JSCT/CAJ A/££aL£
SOIL roes
SO/t SJA^PtS
Figure 3. Apparatus Used by Slater et.al. to Desorb
delay between sampling and analysis are other considerable
disadvantages.
2.2.2 Surface Flux Chambers
Surface flux chambers incorporate an enclosure device over a defined area of ground surface. An example of a
surface flux chamber is illustrated in Figure 4. Gases
originating from the subsurface are sampled as they emit from
the surface. Carrier gas is directed into the chamber to
purge the vapor emmisions from the device. The exit gases
are then analyzed by GC. Previous research into surface
flux chambers is reviewed by Eklund and Schmidt (9)
Advantages of these designs are: undisturbed sampling of the
soil, a rapid sampling time, a suitability to all soil types,
and equipment simplicity. Principal disadvantages include:
dilution of the vapor sample with carrier gas and possible
hindrance of vapor transport by water saturated soil or
certain geologic heterogeneties.
2.2.2 Downhole Flux Chambers
Downhole flux chambers operate on the same principle as
surface flux chambers. However, downhole flux chambers are
modified to sample from the subsurface. Schmidt et al.
descibes such a chamber for sampling organic flux
SAMPLE COLLECTION AND/OR ANALYSIS
ON/OFF FLOW
CONTROL
GRAB SAMPLE TEMPERATURE
READOUT
DC MOTOR
\m
PORT FLOWMETER OUTLET
IMPELLER PLEXGLASS
THERMOCOUPLE
NLET
CARRER
Figure 4. Surface Flux Chamber and Associated Equipment Used
by Eklund et.al.
sup*cirr CABLE 0.25 In.
In-UNt TW.ON
1-k^
TTj
k^
0.25 In. outDuc
UNt TCT1.0N
7 in. length of
TEFIBNI0J31 ͣ
/
///
'/IFigure 5. Downhole Isolation Flux Chamber Used by Schmidt
shovm in Figure 5 is emplaced in the ground using a hollow-stem auger, although a hand auger could be utilized at
shallower depths. The advantages and disadvantages of these techniques are similar to those for surface flux chambers; the difference being that sampling occurs in the subsurface
where vapor concentrations are higher.
2.2.3 Accumulator Devices
Accumulator devices are used to collect soil vapors
by a mechanism of static or dynamic concentration. A typical
accumulator device is shown in Figure 6. The sensitivity of
the method can be increased by extending the length of sampling time. False-negative results caused by temporary
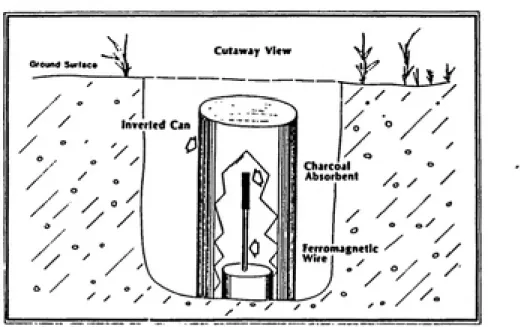
fluctuations in soil vapor concentrations are minimized by taking time integrated samples. Kerfoot et al. describe a
passive soil vapor sampling technique which incorporates
industrial hygiene samplers, suspended inside of metal cans
(26). The method was successful when applied to detect chloroform in a contaminated aquifer. Voorhees et al.
describe a surface static collection device made of an
activated carbon coated ferromagnetic wire (46). The
collectors are analysed by Curie point desorption mass
spectroscopy. Application of this method to a
tetrachloroethylene (PCE) contamination site proved
successful in detecting subsurface vapors. Advantages of
Cutaway View
inverted Can
Charcoal
Absorbent
Ferromagnetic
Wire . , /
sampling and analysis, suitability to various site conditions
(e.g. wet soils, rocky soils). Disadvantages include: long
sampling times (days), potential interference from background
concentrations, and undefined soil vapor sample volume.
2.2.4 Driveable Ground Probes
According to an API report (10), the preferred vapor
sampling technique for groundwater and soil contamination
investigations is the driveable ground probe technique
(DGPT). This technique uses a hollow tube that has been
hydraulically driven or hammered to a desired depth in the
unsaturated zone above the suspected site of contamination.
The tube has an opening(s) in the base to allow subsurface
vapors to enter the tube from the surrounding soil media.
Soil vapor-phase samples are pumped through the tube and exit
from an opening at the upper end of the tube. This method
alters the interstitial soil vapor composition adjacent to
the tube less than passively emplaced ground probe methods,
which require soil excavation (10).
Neglia and Favretto sampled subsurface vapors using
ground probes for surface geochemical prospecting of
petroleum and natural gas deposits (33). The researchers
used a driveable ground probe which was driven to depths of
2-3 meters and then raised 20-30 cm to allow an opening for
soil gas flow (see Figure 7a). A pump was used to withdraw
gas chromatographic analysis with flame ionization detection.
Although the results were inconclusive, hydrocarbon vapors were detected and measured at the part per million level.
Soil probe vapor sampling techniques have also been
developed for assessment of hazardous waste contaminations; some of these have been amended to leaking UST investigations
(44, 6, 29). Sampling methane and other vapors from landfill
sites, Thorburn et al. utilized a ground sampling probe which
consisted of an aluminum tube 1.2-cm diameter x 0.8-cm bore x
2-m length with 0.3-cm holes along the side (44). Individual
tubes were inserted with the aid of a pointed steel rod with
a pounding block on one end (see Figure 7b). The rod was
inserted in a tube and the two were hammered into the ground.
Once in place the rod was withdrawn to leave an evacuated
tube buried in the ground. The researchers used activated
carbon as an adsorbent to concentrate the vapors from the subsurface. The trapped vapors were desorbed in CS_ and analyzed in-lab by gas chromatography. Colenutt and Davies
also utilized a sampling device similar to the device of
Thorburn et al. in their study of organic vapors from
landfill sites (6).
A ground-probe method developed by Tracer Research
Corporation was successfully applied by Lapella and Thompson
for the detection of trichloroethylene (TCE) in unsaturated
zones that ranged in thickness from a few meters to over 30
meters (28)(see Figure 8). With their method, 10-milliliter
(a)
Diameter h iJ
Q.2 in. I 1
6.6 ft
Sampling
Tube
(Aluminum)
(b)
2 in.
6.7 ft
Steel Rod
Figure 7. (a) Driveable Ground Probe used by Neglia and
Favretto and (b) Ground Probe Design Used
lA IB
'10 CC GLASS SYRING€
SYRINGE.
NEEDLE HOSE
CLAMP^
SILICONE RUBBER TUBE
• 1/4 IN. TUBING
X
*>*l
5-rn
SILICONE RUBBER TUBE CONNECTION
TO VACUUM PUMP
, ADAPTER FOR SAMPLING SOIL-GAS PROBE
CLEAR TUBING SLEEVE CONNECTOR (DISPOSABLE)
SOIL-GAS FLOW DURING SAMPLING
•5/4 IN. GALVANIZED PIPE
DETACHABLE DRIVE POINT
Figure S. Soil Vapor-phaae Sampling Apparatus of Lapella and
Thompson: (a> Close-up view of syringe sampling
through an evacuation line, (b) vapor flow through
the evacuation line, which runs inside the length of the ground probe. The samples are immediately analyzed by
injection into a gas chromatograph which is located in an
equipped analytical field van. Although sensitivity is
reported to be high (0.01 ppb for total hydrocarbons), it is limited by the syringe volume. Further inquiry into the this method indicated that 2-ml sub-samples are injected into the
GC and that the sensitivity of the GC is 70-picograms for petroleum hydrocarbons (11). This level of sensitivity may
not be sufficient for adequate peak separaion from the
baseline. Evans and Thompson utilized the Tracer method to
delineate the areal extent of two subsurface petroleum
hydrocarbon spills (12). The researchers indicated that
total hydrocarbon concentrations in the soil vapor-phase
decreased rapidly outside of the edge of the groundwater
contamination plume.
Radian Corporation reported that a ground probe sampling
program, implemented at the site of a subsurface hydrocarbon
spill, was able to detect contaminant plume advancement, but
that only the lighter fraction of gasoline was detected near
the surface (37).
2.3 Vapor Sample Acquisition
2.3.1 Preconcentration vs. Direct Injection
a gaseous stream or evacuation vessel involves either a
direct injection or a preconcentration step. Direct
injection involves withdrawing an aliquot of the vapor-phase
sample using a gas-tight syringe for injection into a
portable gas chromatograph. The principal advantage of using this method is a minimal number of sample workup procedures. The use of gas-tight syringes has produced some satisfactory
quantitative results if proper direct injection handling
techniques are used (see Grob and Remhards (15)). More
commonly, quantitative results via direct injection are less
than satisfactory and should be used only as empirical or preliminary results (35). This is due in part to higher
detection limits when compared with preconcentration methods, since analytes of moderate vapor pressure would be found in
lower concentrations relative to compounds with higher vapor
pressures. Since gasoline contains components with a wide
spectrum of vapor pressures, this may preclude its use in
this application.
Preconcentration involves the physical sorption of
analytes on a solid adsorbent, which are subsequently desorbed. Desorption of analytes from the adsorbent is
achieved by either solvent or thermal means. In a review on
analyses of vapor phase compounds, Nunez indicates that
activated carbon, carbonaceous materials, molecular sieves,
and porous polymers offer the most promise as vapor
adsorbents for preconcentration (35). Preconcentration is
volatiles and has been extensively applied in air pollution studies. In order to properly implement this procedure,
knowledge of analyte breakthrough volumes for each analyte is required. The breakthrough volume is dependent on: (1) type of adsorbent, (2) mass and specific surface area of the
adsorbent, (3) chemical nature of the analytes(s) and (4)
complexity of the sample. Therefore, prior to implementing
this procedure into a soil vapor sampling methodology,
breakthrough times for the analytes should be determined. Solvent desorption is made possible by the propensity of
the analyte to partition from the adsorbent into the eluent.
The primary advantage of solvent desorption is the
opportunity for multiple injections of the same eluate. Often when handling samples of unknown concentration, the possibility for saturation of the chromatographic column
warrants the neccessity of a second injection in order to
obtain an accurate analysis. This advantage is conditional
upon a sufficient concentration of analyte in the extract.
Solvent desorption would, however, be an unfavorable method
when the solvent elution time approaches that of the absorbate(s). The resulting chromatogram from such a
combination would show incomplete chromatographic resolution
or coelution of the analyte with the solvent peak;
quantitative and qualitative determinations would thus be hindered. A further disadvantage of solvent desorption is
the possibility for artifact introduction from the solvent,
Alternatively, thermal desorption involves heating the solid adsorbent and directing the desorbed analytes onto a GC
column. Advantages of thermal desorption include: no
coelution or chromatographic interference from a solvent peak
and the elimination of a dilution factor since all of the adsorbate is desorbed. However, the hardware required for thermal desorption of analyte to chromatographic column is often expensive and complex. Since the entire sample is
desorbed, only one chromatogram is obtained per sample. This
may be a problem if the instrument settings (e.g.
attenuation) are improper resulting in the loss or inaccuracy
of the measurement. Furthermore, the storage of undesorbed samples for extended periods of time may jeopardize the
retention and chemical integrity of the adsorbate(s).
2.3.2 Solid Adsorbents
The proper choice of solid adsorbent is essential for successful soil vapor sample aquisition and should be
governed by the objectives of the analysis and the
characteristics of the sample. Unfortunately, there is no
ideal adsorbent that is applicable to all analytical
situations. For soil gas, researchers have primarily
utilized adsorbent compounds such as porous polymers
(e.g.Tenex) (42), and granular activated carbon (GAC)(6). A
discussion of the properties of these and other solid
compounds is presented in an review article by Nunez et al.
(35).
Because water actively competes for sorption sites on the solid adsorbent, water vapor adsorption can possibly
hinder the adsorption of the analyte vapor. Sampling in relative humidities greater than 50% has been shown to decrease the adsorptive capacity of activated carbon (AC)
(35). Porous polymers have less affinity for water than
activated carbon. Nevertheless, Grob (1978) has shown AC
"capable of adsorbing organic compounds from a stream of
steam, a far more severe test than that likely to be encountered with (soil) gases from landfill sites" (6). Novotny et al. noted significant displacement effects when
trapping volatiles on Tenax (35) which is a less significant
problem with AC. This phenomenon was observed in complex
samples containing analytes of different chemical potentials
and present in different concentrations. Generally, the less
volatile compounds were more effectively collected. Thus,
the use of porous polymers as tools for monitoring volatiles
may be precluded in such complex samples because of its
demonstrated low capacity.
AC has been extensively used for air sampling due in part to its low cost and the problems with other adsorbents
such as those previously described. The adsorbent has a much
greater surface area and specific activity than porous
polymers which lessens displacement and may often more than
properties also allow the use of small traps which can be desorbed with minimal solvent dilution. However, because of excessive surface activity, irreversible adsorption may lead
to recovery problems with certain organic compounds on AC (35). Contrary to this observation, Colenutt and Davies report 94% - 100% recovery of 16 organic compounds from AC
(6). Similarly, Colenutt and Thorburn obtained good
recoveries for hydrocarbons in the part per million range (7). If thermal techniques are to be used for desorption, porous polymers adsorbents are preferential to AC adsorbents. This is because thermal desorption requires temperature so high that many compound may thermally decompose if adsorbed
Experimental Methodology
3.1 Laboratory Investigations- Supporting Studies
3.1.1 Analyte Recovery
A study was undertaken to determine the recovery efficiency of "select" components of gasoline from the
type of carbon traps which were used in the soil vapor-phase sampling method. For this research, these "select"
components are referred to as the "target compounds" and
the motivation for their selection is discussed in section 3.5.2. This study was necessary because recovery of an
adsorbate(s) from an adsorbent is often hindered by a strong sorptive reaction. Although usually more of a problem with polar organics, certain non-polar compounds are recovered
poorly from activated carbon adsorbents (36).
The carbon traps consisted of a small glass tube sealed at both ends and containing 150 mg of carbon. A known
quantity of target compounds (76 ug of each component) was injected with a 10-ul syringe directly into an open end of
the carbon traps. Recovery controls were prepared by
directly injecting the same known quantity into 2 ml of CS2.
with the following temperature program: 35 C for 8 minutes,
then temperature programmed to 145 °C at 4°C/minute.
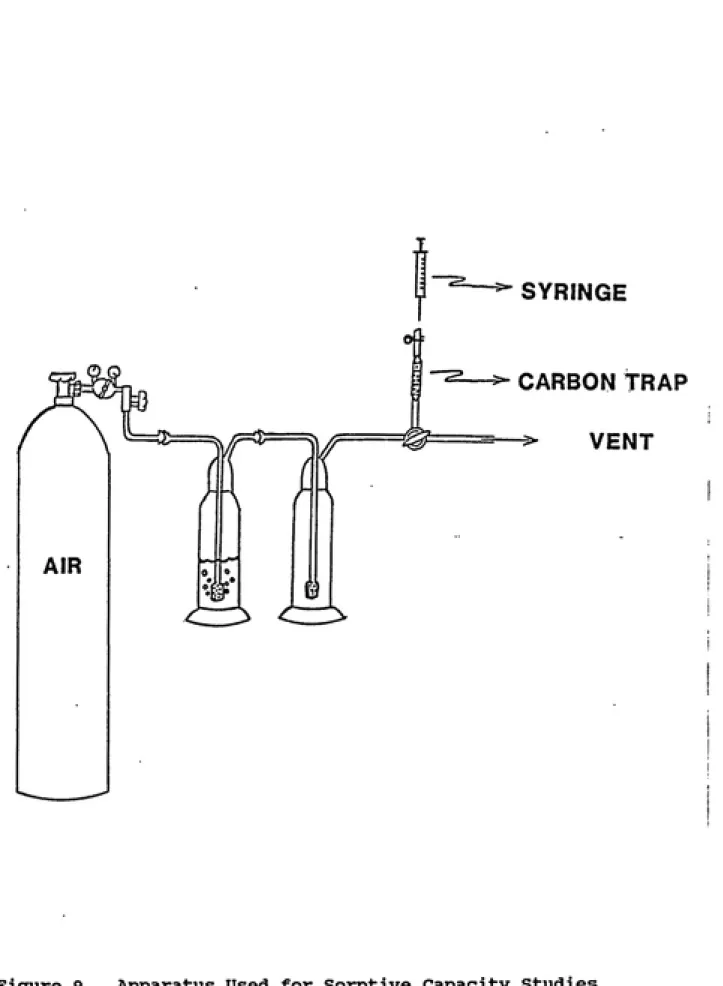
3.1.2 Sorptive Capacity of the Carbon Trap
A laboratory experiment was devised to determine the
sorptive breakthrough characteristics of the activated carbon
traps which were used in the field vapor sampler. This experiment was necessary because sorption kinetics and/or equilibrium sorptive capacity can limit the practical
application of such trap devices. If sorption kinetics are
slow, some target compounds may escape adsorption. If the equilibrium sorptive capacity is too low, the adsorbent may
saturate quickly and allow the target compounds to pass
through the carbon trap- severely restricting the sampling time of the trap. In either case, the vapor-phase
concentration calculated from the mass recovered from the
trap may be lower than the actual concentration because not all of the target compound introduced to the trap is
captured. The apparatus for studying breakthrough
characteristics is shown in Figure 9.
A vapor-phase of either unleaded gasoline (100 ml) or
individual components of gasoline (Burdick and Jackson
Laboratories Inc.) was produced by purging with zero grade
SYRINGE
CARBON TRAP
VENT
glass T-valve either to the carbon trap or into a fume hood. This flow rate was adjusted to the rate of the field sampler. Samples of vapor leaving the carbon trap were taken at timed
intervals using a gas-tight syringe (Precision Sampling
Corporation) and immediately injected into a Varian 3700 gas
chromatograph with a flame ionization detector. Splitless injection onto a capillary column was employed, with an
initial temperature of 50°C, temperature programming 10°C per
minute, to a final temperature of 165°C. Compound
identification was obtained through retention time indices.
3.1.3 Analyte Loss from Activated Carbon Trap
The purpose of this study was to determine if there was
any loss of analytes from the time of field sampling until
desorption of the trap. The utility of this study can be
appreciated in a field situation, where the investigator may
not return to the laboratory for several days or may have stored the field samples in a freezer for later analysis.
Five of the "target" compounds were selected for evaluation of loss over time. A spiking solution of the
standards was prepared in CS. from solutions of the
individual compounds with 1-chlorodecane as an internal standard. Carbon traps were then injected with 10 ul of
spiking solution so that when desorbed in 1 ml of CS , the
final concentration of the eluate was 17.5 ppm (12.5 ppm for
either at -13°C or 27°C. Four traps (two at -13°C and two
at 27°C) were desorbed at 0, 1, 3.5, 6.5, 10 and 15 days.
GC-FID areal responses were quantitatively compared to a prepared standard curve.
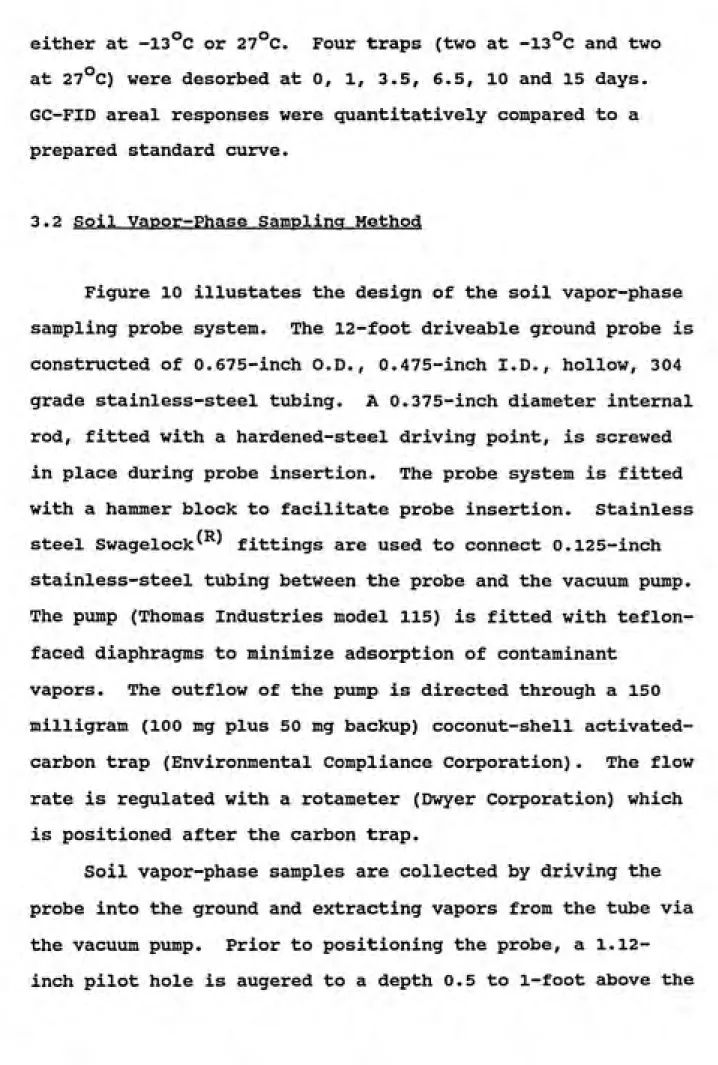
3.2 Soil Vapor-Phase Sampling Method
Figure 10 illustates the design of the soil vapor-phase sampling probe system. The 12-foot driveable ground probe is constructed of 0.675-inch O.D., 0.475-inch I.D., hollow, 304 grade stainless-steel tubing. A 0.375-inch diameter internal
rod, fitted with a hardened-steel driving point, is screwed in place during probe insertion. The probe system is fitted with a hammer block to facilitate probe insertion. Stainless
steel Swagelock^ ' fittings are used to connect 0.125-inch
stainless-steel tubing between the probe and the vacuum pump.
The pvimp (Thomas Industries model 115) is fitted with teflon-faced diaphragms to minimize adsorption of contaminant
vapors. The outflow of the pump is directed through a 150
milligram (100 mg plus 50 mg backup) coconut-shell activated-carbon trap (Environmental Compliance Corporation). The flow rate is regulated with a rotameter (Dwyer Corporation) which
is positioned after the carbon trap.
Soil vapor-phase samples are collected by driving the
probe into the ground and extracting vapors from the tube via
/,
C3
^
Ground Surface
Inner Rod
^
I
//
00
sampling depth. The inner driving rod is then removed to
reveal a 1-cm opening at the driving end of the probe; it is
from this opening that vapors are withdrawn. This design
eliminates the possibility of clogging the tube opening with
soil and since all parts of the probe are removed from the ground no field equipment is left behind after sampling is
completed.
3.3 Field Site Description
An extensive field site investigation was conducted at a gasoline station on the Marine Corps Base - Camp Lejeune, in Jacksonville, North Carolina. A chronology of the gasoline contamination and cleanup effort is given in Table 2.
Although this account may not be complete, it is the best
that can be construed from the limited information available.
Soil drilling logs, taken during monitoring and recovery well installation, reveal 8-10 feet of yellow-brown clay with a moderate silt content, underlain by 10-35 feet of medium to
fine grained, well sorted sands. The thickness of the
unsaturated zone is approximately 24-28 feet. Groundwater
flow within the immediate vicinity of the site is currently governed by the cone of depression that is created by the recovery pump. Under quiescent conditions, the direction of flow was in the east direction. This slight gradient was indicated from data collected prior to the recovery period,
Table 2. Camp Lejeune Contamination and Cleanup Event Chronology
Period
. Late 1940's-1950's
Event
Gas station built and underground gasoline tanks
installed-• 19oO's-Present
• 21 September 1985 • Late September 1985 • January 1986
• IT January 1986
• July 1986
. 23 July 1986
• September 1986-Present
• 10 December 1986
Small leaks of product may occur.
4,400 gallon loss of premium unleaded gasoline occurs.
Leaking tank taken out of service.
Recovery system and 11 monitoring wells installed.
Recovery system begins operation. Monitoring of water lev¬ els and product thickness in monitoring wells begins. Testing of recovered product reveals the presence of leaded
product.
3,000 gallon leaded gasoline tank confirmed to be leaking and is taken out of service.
Recovery system continues to operate but with numerous
periods of system shutdown due to equipment failures. Remaining two underground gasoline tanks (unleaded) tested
for leaks. No leaks are found in tanks, but delivery pipes from tanks to gasoline dispensers are found to be leaking.
Although artificial conditions (i.e. cone of
depression) created by the concurrent recovery effort should have some effect on the distribution of contaminant vapors, this site was chosen because of its accessibility.
3.4 Field Sampling Procedures
At the Camp Lejeune site, vapor-phase samples were taken at depths between 7-11 feet. The variability of sampling depths is in response to a lack of specific
information about the lithology at each sampling point, prior to the actual sampling. The depths of the sampling points were varied in an attempt to sample from an approximately
consistent pedologic formation, a white sandy layer directly underneath the upper clay layer. A site map indicating the locations of these sampling points is presented in Figure 11.
Subsurface vapors were pumped for 5 to 30 minutes through a carbon trap to collect volatile contaminant compounds. Most often, 10- and 30-minute sampling time
periods were taken from each hole, except in close proximity to the suspected source where 5-minute samples were taken. The vapor-phase sample volumes that were drawn through the
traps measured between 235 and 1410 cubic centimeters. The
adsorption traps were then capped for return to the laboratory. Precautions were taken to eliminate
cross-contamination of samples by rinsing the sampling probe with
S
tW.N
ti:-i'-'ji-'-::--v<:ii*di'A'<u^--:^-:i;-:::-;;:';i:-j:r'i:t'i:i:<w-4:t'^
•ͣ^^;
A^v..,.,.,...A_______M:^
\
r"
f UndergroundA
Tanks ^».,-^.'
RD-**
mV^
Seals
I I I I
0 10 20 30 Ft
Figure 11. Site Map Indicating the Locations of Sampling
The pumping system was then purged with ambient air for
2-minutes to remove any residual contamination.
3.4.1 Changes in Vapor-Phase Concentrations Over Time
Sample aquisition at the Camp Lejeune site covered a
four month period. During this time, the contaminant
recovery operation may have significantly affected the
gasoline vapor concentrations. Therefore, a check was needed
in order to ascertain if temporal variations caused by this
and other factors such as biodegradation and volatilization
loss had any affect on vapor-phase concentrations. This
required taking replicate samples from three specific
locations, at the beginning and end of the sampling period.
These samples were taken at the same depths and within 2 feet
of their original sites. Analytical procedures for these
samples is described under Methods 3.5.1.
3.4.2 Effect of Depth on Vapor-Phase Concentration
The effect of sampling depth on measured concentration
should be in accordance with the laws of diffusive flux.
The closer samples are taken to the source, the higher the
expected concentration of contaminant. Although the
sensitivity of the method is increased by sampling deeper,
more time and expense is required in order to take thesesampling costs and sensitivity requirements must be made. The
variance in concentration measurements resulting from
sampling within a window of depths can also be evaluated as accountable error if this type of study is made prior to the
actual sampling regime.
For this study, vapor samples were obtained from three
different depths (6.5, 9.5, 11.5-feet) from the sandy layer. Consecutive replicate samples could not be taken from the same sampling point because re-equilibration of contaminant vapors would not occur immediately following devaporization
(sampling). Therefore, samples were taken at four points located in an approximately six-foot circular area
(designated collectively as location RD** on Figure 11); this
distance also eliminated transverse devaporization between sample locations, while obtaining as close to a replicate sample as possible. The sampling and analytical procedures
were identical to those used for the other field vapor
samples.
3.4.3 Multi-Phase Contaminant Distribution
Soil and water samples were taken in addition to the
vapor sampling at the Camp Lejeune site. The motivation for
obtaining samples from these latter two phases was to observe
3.4.3a Ground Water Sampling
Samples of groundwater were taken from monitoring wells
in close proximity to corresponding soil and vapor-phase
sampling points. A bailer was used to take water samples
from monitoring wells. In order to prevent cross
contamination of wells, the bailer was rinsed thoroughly with
acetone and distilled water, respectively, and dryed between
wells. Samples were transferred to 40-ml glass vials, topped
off with pentane to eliminate headspace, and capped with
teflon-faced septa. The samples were then returned to the
laboratory and stored at 6°C.
3.4.3b Soil Sampling
Soil samples were also taken at points adjacent to
monitoring well and vapor sampling points. A hand auger with
a coring attachment was used to remove intact cores from the
desired depths. Soil cores were retreived at depths as close
as possible to corresponding vapor-phase sampling depths. Upon withdrawl from the borehole, samples were immediately
transferred into 40-ml glass vials, covered with n-pentane
(pesticide grade), and sealed with teflon-faced septa screw
caps. Samples were returned to the laboratory and stored at
-13°C until analysis.
3.5.1 GAC Extraction/Analysis Procedure
The field samples were processed in the laboratory by desorbing the activated carbon into 1 ml of carbon disulfide
(CS_). Two internal standards (IS), 1-chlorooctane and
1-chlorodecane, were added at 35-ppb to the CS, stock
before the solvent aliquots were delivered to the desorption
vials. These ISs were added in order to account for
differences in sample injection volumes so that samples could
be corrected to a mean value of IS area response. The
solvent extracts from the carbon traps were analyzed using a
Varian 3700 high-resolution gas chromatograph with a
flame-ionization detector (FID). Separation was achieved on a
Supelco 30-meter SPB-1 fused-silica capillary column with splitless injection and temperature programming: the initial
temperature of 35°C was held for 8 minutes, and then
programmed to a final temperature of 200°C at a rate of 6°C
per minute. The injector temperature was set at 285 C; the
flame ionization detector temperature was set at 300 C; and
the helium carrier gas flow rate at 1.7 milliliters per
minute. If hydrocarbons were not detected by the GC
analyses, the samples were evaporated under a gentle stream
of nitrogen to 0.1-ml. These concentrated samples were then
rerun under the same conditions.
Gas chromatography/mass spectrometry (GC/MS) compound
quadrupole mass spectrometer with a Hewlett-Packard data system. Electron ionization (EI) was employed (70-electron
volt source potential) with a scan range of 40 to 400 atomic
mass units. The same temperature program used in the gas chromatographic analyses was also used for the GC/MS runs.
Library spectral matching was employed for identification purposes and included 25 major peaks after 6 minutes, and
before 18 minutes, of the temperature program.
3.5.2 Target Compounds
If the quantitative analysis was only for one compound,
sample measurements could easily be extrapolated to the define a mass of contaminant per volume of soil gas.
However, gasoline is a mixture of many different component
compounds. A representative group of compounds must be
selected in order to gain some quantitative description of
the extent of contamination. These "target compounds" were
chosen from among those selectively identified by GC/MS
library spectral matching and determined by gas
chromatography to be present in high concentrations in vapor
samples; additionally, they must sorb well onto activated
carbon. Unfortunately, the percentage of individual
components of gasoline vary markedly from commercial brand to
brand and from season to season. Thus a calculation of theoriginal total mass of gasoline based on these percentages is
selection of target compounds does provide important "markers" for describing the extent of sxibsurface
contamination.
3.5.3 Ground Water Extraction/Analysis Procedure
Samples of water from the monitoring wells were stored at 6 C prior to extraction. Each vial of water was
transferred to a 125-ml separatory funnel in addition to 40-ml
aliquots of pentane used as vial rinsates. These
water/solvent samples were shaken for 2 minutes and allowed
to separate for 10 minutes. After the separation period, the
water (which has a higher density than pentane) was eluted
from the funnel back into the vial. The pentane extract
was added to 500-ml Kurderna-Danish (KD) concentrator
apparatus. The water eluates were returned to the separatory funnels and the procedure was repeated two additional times.
The samples were concentrated in the KD apparatus to
approximately 5 ml. Further concentration to 2 ml was
performed under a gentle stream of nitrogen gas. Gas
chromatographic analysis of the concentrates employed the
same capillary column, instrument conditions and temperature
program as those used in the soil vapor analyses.
3.5.4 Soil Extraction/Analysis Procedure
spatula and 30-ml of acetone to 25-ml glass centrifuge bottles; 100-ml aliquots of pentane were added to the
mixtures. In order to remove soil moisture, 30-g of sodium sulfate (Na_SO.) was mixed into the soil for approximately 2
minutes with a teflon stirring bar.
The soil-solvent mixtures were then capped and placed in a water bath with a sonicator probe (Tekmar model TM-soo)
submerged 3.8 cm below the water surface. Sonication was
applied at 90% pulsed duty and full power output (500 watts)
for 10-minutes. Each sample was centrifuged at 2300 rpm for
10-minutes; the supernatant was then added to a KD apparatus
for concentration to approximately 5 ml. A gentle stream of
nitrogen gas was used for final concentration to 3-ml.
Chromatographic analysis was the same as used in the water
4.1 Laboratory Analyses
4.1.1 Sorptive Capacity of Carbon Trap
The results from the sorptive capacity experiment gave
an indicaton of the maximum allowable sampling time to assure
complete analyte recovery of the target compounds. Figure 12
shows the breakthrough of toluene and xylenes (o-,m- and p-) when introduced to the carbon trap as single vaporized
components. Figure 13 shows the breakthrough of these same
components when present in a gasoline mixture. Figures 12 and
13 can be used to understand the effects of competitive
adsorption and more importantly, the proper selection of
target compounds and sampling durations. If the chosen components to be monitored break through before the end of
the sampling period, the sorptive capacity of the trap has
been exceeded and subsequent analysis of the extract from the
trap will underestimate the concentration of the contaminant.
The results presented in Figures 12 and 13 are not
directly comparable for two reasons. First, the
chromatographic peak originally identified by retention time
indices as toluene was found to be a coelution product of
Toluene Breakthrough
o
• 1
0.9
12 16
"tlnna (minutes)
Xylene Breakthrough
I
Time (minutes)
t*-,P—Xylenes O—Xylene
o
o
1.9
Toluene
Benzene
B
Figure 13.
Time — minutes
vapor phase concentrations introduced to the carbon traps were not the same in both experiments, the time to
breakthrough will necessarily be different even if
competitive adsorption did not occur. Nonetheless, the
relative ordering of breakthrough is given from the single
component experiments (Figure 12) and the same ordering is
seen in the mixture (Figure 13). The relative ordering of
adsorbability (from weakest to strongest) is:
toluene/trimethylpentane; octane; ethylbenzene; m- and
p-xylene (treated as one because of poor chromatographic
resolution); and o-xylene. That the concentration of toluene
leaving the trap exceeds that being introduced is proof of
competitive displacement by more strongly adsorbed
components. Here, the exit concentration rises above the
feed concentration, i.e. C/C >1 because the previously
sorbed toluene/TMP is displaced by the xylenes and other more
strongly sorbed components. Although displacement of weakly
adsorbed components is apparent, further interpretation of
the shape of the curves is impossible because C may not have
remained constant over time. Evidence of this anomaly is
illustrated by the failure of the benzene breakthrough curve
to approach C/C_ = 1 as must occur when sorptive capacity is
exhausted.
These laboratory experiments nevertheless suggest that
the xylenes are excellent components to field monitor because
breakthrough does not occur within 40-minutes or more of
they will not be present in as high concentrations as the other analytes. Octane, and toluene/TMP are also good choices if sampling times are limited to less than
approximately 10-minutes in highly concentrated areas. These are conservative estimates of allowable sampling time because
the experiment was conducted by volatilizing pure gasoline; thus the feed concentrations were maximized and breakthrough times were minimized. In actual field situations, some
gasoline partitioning into the soil and aqueous phases will occur and thus, the vapor phase concentrations will be
accordingly lower. The possibility also exists for
increasing the mass of carbon in the trap if longer sampling times are desired. However, increasing the mass of adsorbent
necessitates using a larger volume of solvent for desorbing
the traps, thus introducing additional dilution of the
sample.
4.1.2 Analyte Loss from Carbon Traps
One of the major advantages of the proposed sampling methodology is the elimination of expensive, sophisticated
field equipment. However, this advantage would be diminished
if additional handling procedures restricted the convenience
of the method. Most often, access to refrigeration and
chemical stocks is usually unavailable at remote field locations. Thus, any adsorbent employed in field sampling
over the duration of the sampling trip. The results from
this experiment indicates the degree of tenacity to which
activated carbon adsorbs the "target" compounds. Figure 14
a) and b), respectively indicate no significant change in
concentration can be seen over the ten day experimental
period at either room or freezer temperatures.
4.2 Gas Chromatographic Calibration for Target Compounds
A standard curve, a plot of peak area response versus
mass injected, was prepared for each of the target compounds.
All curves showed excellent linearity (r > 0.998), although
some deviation was seen at the lower concentrations.
Response factors (RFs), generated from these curves for each
target compound, were used to convert peak area responses to
mass measurements. Since the instrument was not dedicated
exclusively to hydrocarbon analysis, standard curves were
prepared for each run of sample analyses to avert any changes
in FID sensitivity. Moreover, standard solutions were
prepared prior to each analytical run because of the high
volatility of CS^, the solvent used to prepare these
solutions.
4.3 Selection and Analysis of Target Compounds
At the onset of this study, the following were chosen
c 8 c 0 o 20 19 18 -£p 17 16 15 14 13 -12 -• 11 -10 9 a 7 5 5 4 3 2 1 -0
Analyte Loss <s> 27 Degrees Celcius
S
m A
LEGEND
Q Toluene/ TMP
ͣ 0^ n-Octane A Ethylbenzene -^ m,p-Xylene "1---n 2
1 n
6 "1---r 8 10 —1---r 12 —I---r 14 IS
Time — doys
Analyte Loss at —13 Degrees Celcius
c
c
8
20 19 18 -16 - i
a 0 A 15 14 -ͣ 13 -" 12
11 -o
o
O 0
10
-9 - LEGEND
8
-7 - p Toluene
S - O n-Octane
5
4
-A Ethylbenzene |
+ m,p-Xylene
3
-2 -1
1 -^
0
-<
1 1
3 2
1 i
4
1 1
6
1
8
1 1 1 1 1 1 1 10 12 14 1
Figure 14.
Time — Days
Target Compound Loss from Activated Carbon Trap
gasoline: toluene, octane, ethylbenzene, m,p-xylene and
o-xylene. Several initial field samples were analyzed and compared to the retention times of these five target compounds. All five of these compounds were tentatively identified in field samples by retention time indices.
However, retention time matching is not confirmation. Later
in the research, samples of vapor eluant, from two sampling
locations (BB and W on Figure 11) at the Camp Lejeune site, were submitted to the North Carolina State University GC/MS
facility for identification. A GC/MS total ion chromatogram for one of the samples-location BB, is shown in Figure 15.
Table 3 lists 27 major components found by this analysis; the
conditions of the specified search range can be found in Section 3.2.2. All of the selected target compounds
(designated by an asterisk) were confirmed.
Table 3. Major Gasoline Components Selectively Identified by GC/NS 1. Hexane 13. 2,3,4-Triinethyl Pentane *25. m-Xylene 2. 2,2-Dimethyl Pentane U. 4-Methyl Heptane *26. p-Xylene 3. 2-Methyl Hexane *15. 2,3,3-Trimethyl Pentane *27. o-Xylene
4. 3-Methyl Hexane *16. Toluene
5. 2,2,4-Triinethyl Pentane 17. 3,3-Diniethyl Hexane 6. 2,2-Diinethyl Hexane 18. 2-Hethyl Heptane
7. 3-Hethyl Hexane 19. 3,4-Dimethyl Hexane
8. 2-Methyl Hexene 20. 3-Methyl Heptane 9. 3-Methyl Hexene 21. 2,4-Dimethyl Hexane
10. 1,1,3-Trimethyl Cyclopenetane 22. 2,4,4-Trimethyl Hexane
11. 2,5-Dimethyl Hexane 23. 3,4-Diinethyl Octane *12. n-Octane *24. Ethylbenzene
4500001 400000' 350000" 300000 (0 c. ^ 250000
C H
0) 200000
>
•H
-P
<o ? 50000'
0)
100000
50000
^-1-^^-JA.'-M-u\j'^
''LL-0 -T--r I ' I ' I ' I ' I ' I ' I ' I
AA I J'V
Minutes'1 ' I ' I ' I ' I ' I ' I ' I ' I ' r
4.6 5,3 5.R B.O fi. 4 H. H 7? 7. H R. 0 R4 H. P 9. P ^R 10 File >12146 40.0-400.0 amu.
4Q0 .,..4^0. , sqo. leooooi 140000' tn 120000 ͣ 1 J ͣ p •H rn 100000 c « 4J (J H soooo 0) > •H •P BOOOO (0 rH (U « 40000 20000"
30 BUL EI 30M CGI 35(7)-20<)§6EteG/MIN
. 650 , 7q0...75Q..,.8Q0. ,..8.^0. ,
Toluene/ TMP 11 10 n-Octane / 0 ^-^
OxLilJlAiJ'->_A--.>^-.-^.yu,'..-^^y
10.0 —1—I—r-T—I—I—r-1—r—1—i—t—i—i—i—i---__"|'---,'—'—i—'—I—P—i—i—r-r-' '—'—i—'—I—P—i—i—r-r-' '—'—i—'—I—P—i—i—r-r-' Minutes
____iUl_______12J]______13J]______14JL 1?. Q 16. [)
Figure 15. GC/MS Total Ion Chromatogram of Vapor Sample at
File >12146 40.0-400.0 amu. BB-30 6UL EI
, . .I.OPO. . , . ͣ .12P0C TIC 14PP
36000
32000
>i
^ 2B0001
C
^ 24000
C
H
0) 20000"
>
Id 160 00
12000
BOOO
40001
30M DBl 35(7)-200g60E6/MIN
. . , 1.6,00 .... . 18P0 ....
Ethylbenzene m-,p-Xylene
I
,o-Xylene
[ I t 1 M ' ' "^'^ T T '• 1" Y T T I T ! I T I I I I I -lur ' *»,,A- 1. ^-1 1 T I * T f I T T T T~T-rT-T T T T T t It I T T T T » 'I 1 I T 1
'...Minutes'
IB. 0 17. Q JH. 0 19. Q ?0. 0 ?\. 0 ?? 0 ?1 n ?4. 0 7n 0 ?R. 0 ?7. 0 ?a. Q ?9. 0 30. 0
Figure 15. GC/MS Total Ion Chromatogram of Vapor Sample at
an aliphatic hydrocarbon- trimethyl pentane (TMP)- coelute. Matching of the TMP spectra (Figure 16) to library reference
spectra tentatively identifies this compound as 2,3,3
trimethyl pentane. In order to resolve the problem of distinguishing toluene from the TMP for quantitative
determination of each, samples samples were analyzed on a more polar capillary column. The percentage contribution of
each compound to the total peak area was estimated by
reanalyzing three field samples, AA, BB and W. These samples
were re-analyzed in duplicate pairs, first on a Supelco Inc.
SPB-1 (non-polar) 30-meter capillary column and subsequently
on a J&W Scientific Inc. DB-5 (slightly polar) 30-meter
capillary column. Because toluene is a slightly polar
compound, its retention time is increased on the more polar
column. Thus the lowering of response of the co-elution peak
using the DB-5 column was attributed to the toluene eluting
later. The results of this analysis indicate that toluene
accounts for 23.2%, 1.5%, and 1.5% of the toluene/TMP peak
seen using the SPB-1 non-polar column for samples AA, BB, and
W, respectively. Analytical variability between duplicate
samples from each location was between 0.00% and 0.82%.
Chromatographic response factors, which are a relative
measure of the response of the FID to a known mass of analyte
are 1.07 and ~1.0 for toluene and TMP, respectively (8), so
that quantification of the peak area response for the two can
be calculated with no more than 7% additional error.
File >12147 Z-1X)05UL EI 30M DBl 35 (7)-200
Scan 633Bpk Ab 9!
34^ SUB ADD DVC
12. 65 £in,
1 eooo
ͣ
ͣ
p •H
c
43
^'0
c 4000"
>
^]^ 135 224
290A
j"40
ͣ
P
l...i . .1,
...i. / ./
\T)
I 1 r "I r T--I 7 r-T T j-r-T i-j t i i i i i i i- i-i -r i i i r i i i i j i i i | i i
Atomic Mass Units