Invited Paper
Tip Geometry Eects in Surface Characterization
with Amplitude Modulation AFM
H. Nejat Pishkenari
1and A. Meghdari
1;Abstract. In the present work, characterization of the surface trenches and vacancies with Amplitude Modulation AFM (AM-AFM) using Molecular Dynamics (MD) is simulated and the eects of the tip shape on the resulting images are investigated. The simulated system includes a recently developed gold coated AFM probe which interacts with a sample including a surface trench or a single-atom vacancy. In order to examine the behavior of the above system, including dierent transition metals, a Molecular Dynamics (MD) simulation with Sutton-Chen (SC) interatomic potential is used. Special attention is dedicated to the study of tip geometry eects such as the tip apex radius, the tip cone angle, the probe tilt angle, the tip apex atoms number, and the tip axis direction with respect to the FCC lattice structure on the resulting images.
Keywords: Surface trench characterization; Amplitude modulation AFM; Tip shape eects.
INTRODUCTION
The Atomic Force Microscope (AFM) has evolved into a useful device for obtaining atomic resolution images of the surfaces of metals, biomaterials, dielectrics, semiconductors and polymers [1]. Particularly, AFM-based systems supply additional abilities and benets relative to other microscopic methods, such as Scan-ning Electron Microscopy (SEM) and Transmission Electron Microscopy (TEM), with regard to studies of metallic surfaces and microstructures by providing reliable measurements at the nanometer scale [2,3]. The AFM key component is its tip, because the AFM tip interacts with the sample and measures the surface topography. The problem with tip geometry most often occurs when imaging specimens are smaller than 500 nm in size, which includes many samples. If the tip is much sharper than the sample feature, the true edge prole of the feature is represented. On the other hand, the tip apex prole has a profound eect on
1. Nano-Robotics Laboratory, Center of Excellence in Design, Robotics and Automation, School of Mechanical Engineering, Sharif University of Technology, Tehran, P.O. Box 11155-9465, Iran.
*. Corresponding author. [email protected]
Received 10 May 2010; received in revised form 31 July 2010; accepted 18 September 2010
the observed atomic image when the tip size is equal to or larger than the specimen surface features [4]. The inuence of probe tip shape on the reactive forces between tip and sample was investigated and it was demonstrated that the general surface topography could be measured even when a at tip probe was used due to the periodicity of the sample surface [5]. Yan et al. [6] presented an experimental calibration method measuring three-dimensional scratching forces on the AFM nanoscratching process. They studied the eects of tip geometry on scratching forces, friction coecient and specic energy. Imaging of the surface trenches with the AFM probe presents signicant challenges due to the sharp step edges that disturb the tool and prevent it from eectively measuring the sample topography [7]. Although considerable progress has been made in the investigation of the tip structure eect on the mechanical imaging of a wide range of nanostructures, there still remain signicant matters to be addressed, such as characterization of small trenches with width and depth on the order of a few nanometers, development of accurate simulation methods, and study of the eects of tip geometry on the imaging of these features.
As the main challenge of working at the nano-scale, understanding the atomic processes occurring at the tip-sample interface is a fundamental concept
relevant to many technological problems. So far, ap-proximate models based on van der Waals and contact forces have played a strong role in the modeling of these interfacial interactions [8,9]. However, in most cases, these methods do not consider the individual atomic interactions and, hence, the realization of imaging with true atomic resolution. One of the simulation tools at the atomic scale is Molecular Dynamics (MD). This approach has been utilized in the modeling of interfacial processes, such as friction, tribology, inden-tation, adhesion and manipulation [10-15], at the nano-scale. Recently, some research has been devoted to modeling tip-sample interaction in the imaging process by molecular dynamics [16-20]. As one of the initial theoretical studies in the eld of AFM images [21], models of a single-atom tip or multiple-atom diamond tips were used to simulate scanning a graphite surface. Along this line, the eects of diamond tip orientation and its apex structure on force distributions and resulting images were investigated. In a recent work, Solares et al. [20] investigated the inuence of the carbon nanotube probe tilt angle on the eective probe stiness and image quality using MD simulations. In another work [16], Pishkenari and Meghdari simulate surface defect characterizations with frequency and force modulation AFM with the aid of the MD method. In this study, an online imaging simulation of the probe and sample is performed, and the eects of dierent system parameters on the resulting images were inves-tigated. In a dierent research [18], Trevethan and Kantorovich, using model systems consisting of ionic tips interacting with ionic surfaces, performed Non-equilibrium molecular dynamics simulations of atomic scale imaging in Non-Contact Atomic Force Microscopy (NC-AFM), at a close approach to the surface, to investigate the hysteresis mechanism observed in the experiments. On the other hand, using model systems consisting of metallic tips interacting with metallic surfaces, the eects of dierent system parameters such as environment temperature, tip orientation, surface plane direction, system size the distance of the closest approach and tip oscillation frequency on the dissipated energy in NC-AFM were investigated [17].
In our research, the MD simulation method is used for detection of a sample surface with a gold coated nano probe. Due to enhancing the laser reectivity of the cantilever, the gold coating can be used in various special applications [22]. The gold coated probe is particularly attractive for applications in the elds of biology and life sciences, such as force spectroscopy, binding force spectroscopy and chemical spectroscopy [16,17,23].
In this paper, the eects of tip geometry on the characterization of surface trench and vacancy are investigated. Along this line, dierent tip geometry eects including tip apex radius, tip cone angle, probe
tilt angle, tip apex atoms number and tip surface plane are considered. The specimen surface is characterized with a gold coated probe using Amplitude Modulation Atomic Force Microscopy (AM-AFM). AM-AFM [3] is the most common dynamic imaging mode, which uses a driving force of constant amplitude and frequency to excite the cantilever. In this mode, the cantilever height above the surface is adjusted to keep the tip motion amplitude at a constant value (amplitude set-point). The specimen topography is directly obtained from the cantilever base height as a function of its horizontal position.
Another challenge in the present model is the combination of MD and the cantilever dynamics, in spite of their dierent time and length scaling. In multi-scale modeling, both methods are run simul-taneously and a shaking hand area is utilized to connect them together [24]. As a more feasible and simple alternative approach for combination, one can consider these two sub-models (MD and the cantilever dynamics) separately. In this combined technique, which is used in the present work, force data calculated by MD simulations is used in the cantilever dynamics simulations.
The following sections of this paper include an explanation of the AFM model, a description of the simulation method and an investigation of the dierent tip shape eects on the imaging quality.
AFM MODEL
The AFM cantilever lumped-parameter model that has been extensively used [3] is as follows:
d2y
d2=
Q
dy d+
f
kcos(v)
ftip sample
k y
2;
(1) where = 0t is the dimensionless time (0is the
can-tilever natural frequency in free vibration), y is the in-stantaneous tip position with respect to its equilibrium rest position (yc), k is the cantilever stiness, = 2, Q
is the cantilever quality factor, f is the excitation force amplitude, v = =0 is the dimensionless frequency
and ftip sample is the vertical component of the
tip-sample interaction force calculated through molecular dynamics.
SIMULATION METHOD
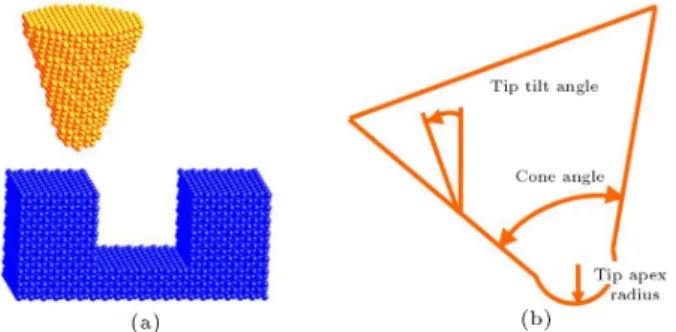
The MD simulation method is used for simulation of the interactions between the specimen surface and a gold coated nano probe (Figure 1). In our conducted simulations, the probe tip is modeled by a cone with a sphere embedded in the end that is made up of gold atoms with a FCC lattice structure. The sample is a
Figure 1. View of the model used in the MD simulation of the tip-sample interaction. a) The gold coated probe over an Ag sample including a trench surface. b) Tip is modeled by a cone with a sphere embedded in the end.
cubic lattice of Ag atoms with a FCC lattice structure including a surface trench (Figure 1).
In all simulations, the tip and sample planes are considered to be (0 1 0), unless a dierent plane is assigned. The signicance and accuracy of the MD simulations in reproducing the experimental observation depends entirely on the realistic choice of a potential energy function. A variety of inter-atomic potentials for modeling the physics of dier-ent classes of material have been developed. The simplest potential, the Lennard-Jones potential, does not incorporate the many-body eects, because it is a two-body potential, and the two-body potential of metals has neither environmental dependence nor accounts for the directional nature of the bonding. The major physical characteristic of the many-body potential is that the bonds become weaker when the local environment becomes more condensed [25,26]. We have used a multi-body long-range potential proposed by Sutton and Chen [27], which has been extensively applied in physical investigations of FCC metals [13-17]. The SC potential was created for explanation of the energetics of the ten FCC elemental metals. This potential is particularly designed to model the mechanical interactions of clusters of atoms, such as the interaction of an atomically sharp tip with a at substrate [25]. The general form of the SC potential is [27]:
ESC =1
2 X
i
X
j6=i
V (rij) "c
X
i
p
i; (2)
V (rij) = "
a rij
n
; i=
X
j6=i
a rij
m
; (3)
where " is a parameter with an energy dimension, a is a parameter with the dimension of length and is normally taken to be the equilibrium lattice constant, and m, n(n > m) and c are positive constants. The use of a SC potential has been extended to binary alloys by Rai-Tabar and Sutton [28] and will be utilized to
model the interactions of unlike materials (e.g. between tip and substrate) in our studies. The system includes two kinds of atoms, namely, boundary atoms and thermostat atoms; thermostat atoms obey Newton's second law. The velocities of thermostat atoms are adjusted at every specic time step of the computation in order to stabilize the average temperature of the thermostat layers at 0.1 K. Since at higher tempera-tures, thermal uctuations produce a noise and avoid a reliable determination of the force, the environment temperature is set to be 0.1 K. In the simulations, Nose-Hoover dynamics [29,30] are utilized as a heat bath to impose the environment temperature on the system. Accordingly, equations of motions in the velocity Verlet form have been used for the simulations [31]. The top layer of the tip and the bottom of the substrate are boundary layers and are xed in space. These sites serve to reduce the edge eects and maintain the proper symmetry of the lattice.
The MD simulations consist of equilibrium (re-laxation) and approaching movement stages. To avoid the eect of the long-range attractive force between tip and substrate in the equilibrium phase, they were positioned 20 A apart. In this stage, at rst, the initial positions of the tip and substrate atoms are assigned according to their crystalline structures, respectively, and the initial velocities are assigned randomly in accordance with the environment temperature. Next, both the tip and the substrate are allowed to be relaxed to their equilibrium atomic congurations due to the interatomic forces acting on each individual atom. In the second stage of the MD simulation, the tip approaches the surface vertically with a uniform movement of all the tip atoms, and in each vertical position, the vertical force is determined by the MD simulation code. The interaction force is dened as the total force exerted on all atoms of the tip. To calculate the interaction force as a function of the tip vertical position, the tip must approach the surface. In order to compute the tip-sample interface force at a xed horizontal position (i.e. at a point (x; y)), the tip approaches the sample vertically, and in each vertical position, the vertical force is determined by the MD simulation code. If this process is done in other horizontal positions, the interaction force can be obtained as a function of x and y, i.e. Fint(x; y).
The tip height is measured as the distance between the lowest tip atom (the apex atom) and the surface after the initial atomic relaxation (when the tip and surface are 20 A apart), and prior to local atomic relaxation caused by tip and sample interactions.
The interaction force in dierent horizontal posi-tions considerably changes, and in fact this distinction will create a dierence in topography. The control of the cantilever's vertical position in AM-AFM was performed through a proportional-integral loop based
on the following formula [7]:
yc(j + 1) = yc(j) p(A(j) Asetpoint)
i
j
X
i=j 9
(A(i) Asetpoint): (4)
Here, yc is the cantilever vertical position and A is
the eective tip oscillation amplitude. AM-AFM's response follows changes in the oscillation amplitude, which is approximately linearly dependent on the can-tilever position with respect to the specimen skin [7].
When the microcantilever travels horizontally over the surface, the interaction force data is contin-uously updated to reect the changes in the relative horizontal position of the tip and the sample. In order to have a stable oscillation on the sample surface, the tip was brought into oscillation in the rst (left) point for 100 steps (j = 100 is equivalent to time = 0.001 s) before traveling from left to right. Along this line, the sample topography can be calculated at each horizontal position, based on the dierence of the cantilever vertical position and the set-point amplitude (i.e. yc Asetpoint).
The AFM system parameters selected for simula-tions are as follows. The cantilever force constant is set to be k = 1 N/m, the cantilever quality factor is Q = 10, the cantilever free resonant frequency and the excitation frequency are 0 = 100 kHz, and the free
oscillation amplitude is set to be A0= 10 nm.
The amplitude setpoint and scan speed are two parameters which can signicantly aect the resulting image. When the amplitude setpoint decreases, the maximum repulsive force increases and leads to larger deformations of the tip and sample. On the other hand, increasing the scan speed decreases the image accuracy and also leads to a lateral shift of the surface image in the scan direction. Figure 2 shows a trench image taken by AM-AFM for two amplitude setpoints,
Figure 2. The eect of amplitude set-point on the measured topography. The image taken by AM-AFM is impressed by dierent phenomena including the tip-sample deformation, the tip-sample convolution and scan speed eect.
Asetpoint= 9:9, 5 nm, and compares them to the actual
geometry of the trench and to the image obtained by a non-deformable tip and sample. The trench width and depth are 4.9 nm and 2 nm, respectively; the tip diameter is 4.1 nm. The image obtained by the rigid tip and sample is dierent from the true trench geometry because the probe width is greater than zero, which prevents its axis from contacting the side walls when it is inside the trench. Due to an increase in the sample deformation for Asetpoint = 5 nm, the
precision of the image with respect to the real surface geometry decreases, while at higher amplitude setpoint, Asetpoint = 9:9 nm, the maximum repulsive force and
sample deformation decrease and, therefore, the image resolution improves. In fact, AFM technique accuracy is limited by elastic deformations, which change the sample topography. Another striking feature depicted in Figure 2 is the eect of scan speed on topography, which is illustrated by the lateral shift of the image. In summary, during scanning, three major TM-AFM artifacts can appear:
1. Increase of prole width, due to tip-sample convo-lution
2. Decrease of image height, due to elastic deformation of the tip and sample.
3. Lateral shift of image, due to non zero scan speed. In the following sections of the paper, the amplitude setpoint is set to be Asetpoint = 9:9 nm to reduce the
artifact of the tip-sample elastic deformation.
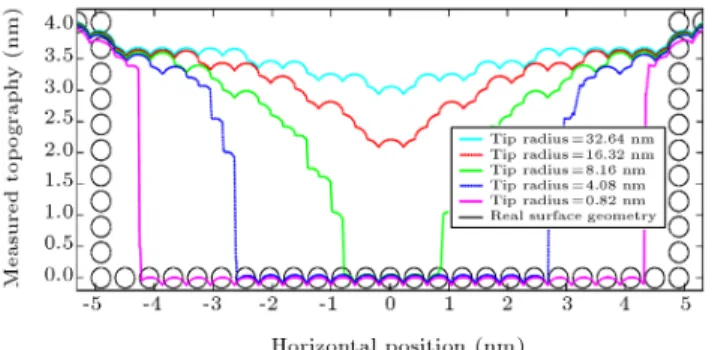
Figure 3 shows the eect of tip radius on the measured topography. In this simulation, the surface trench width and depth are 9.8 nm and 4.1 nm, respectively, the tip cone angle is 10 degrees, and the simulated values for the tip apex diameter are 0.82 nm, 4.08 nm, 8.16 nm, 16.32 nm and 32.64 nm. As expected, when tip diameter increases, it fails to measure the surface trench eectively (Figure 3). In fact, when the sample feature is sharper than the tip, the image will be dominated by the shape of the tip. Since tips with larger radii have a lower exibility, the height lowering is smaller in these larger tips.
Figure 3. Tip apex diameter eect on the measured topography.
The eect of tip side wall angles on the measured topography is depicted in Figure 4. In the conducted simulation, the surface trench width and depth are 6.5 nm and 4.1 nm, respectively, and the tip apex diameter is 2.5 nm. The simulated tip cone angles include 10, 40, 60 and 90. As Figure 4 depicts,
sharper tips (tips with a lower cone angle) reproduce more accurate images of the surface trenches. Indeed, surface features with a sidewall angle larger than the tip sidewall angle cannot be measured successfully; on the other hand, large values of tip cone angle prevent the probe from touching the trench depth eectively.
One of the imaging artifacts in an AFM image arises from the probe tilt angle, with respect to the axis normal to the surface. In this simulation, the surface trench width and depth are 7.4 nm and 4.1 nm, respectively; the tip cone angle is 1 degree and its apex diameter is 2.5 nm. The simulated tip tilt angles include 0, 10, 20 and 40. Figure 5 illustrates how
the tip tilt angle aects the image quality. Despite the symmetric trench, the measured topography is not symmetric and depends on the scanning direction. The dierence between the measured and the real topography increases with increasing the tilt angle.
One of the tip geometry parameters aecting the
Figure 4. Tip cone angle eect on the characterization of a surface trench.
Figure 5. Tip tilt angle eect on the measure topography.
sample topography is the tip atness, or on the other hand, the number of tip apex atoms. When the number of tip apex atoms increases (at the nearest layer of the tip to the sample skin), the tip fails to track the sample surface eectively. Figure 6 shows how the number of tip apex atoms aects the measured topography of a surface trench. In the conducted simulation, the trench width and depth are 3.3 nm and 2.5 nm, respectively, and the tip diameter and cone angle are 1.6 nm and 1,
respectively. If a bottom layer of tip \i" is removed, tip \i + 1" is generated. In order to illustrate the eect of the number of tip apex atoms, another simulation is performed. In this simulation, a sample with a single-atom vacancy is studied. Figure 7 shows that only tip 1 is able to detect the vacancy site in the sample.
In dierent planes (dierent directions) of the FCC lattice structure, the atoms placement and density are unlike. Since the tip axis direction (the axis normal to the surface), with respect to the FCC lattice structure, can aect the interaction force between tip and sample, the eect of this parameter on the measured topography is investigated. Figure 8 shows three tips with dierent axis directions, the same tip diameter of 4.1 nm and also the tip-sample interaction
Figure 6. Eect of the number of the tip apex atoms on the measured topography.
Figure 7. Characterization of a single atom vacancy. Only tip with a single atom apex can detect the single-atom vacancy site.
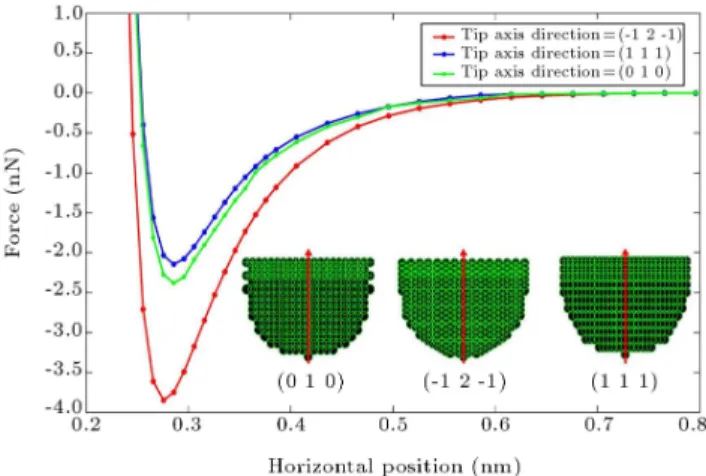
Figure 8. Tip-sample interaction force for three dierent tips. The structure of three tips with dierent axis directions and the same tip radius are shown in the gure as well.
force for these three tips when the tip is over an Ag atom of the surface. It is expected that these tips interact dierently with the sample due to their distinct atom placements and normal forces. The tip with an axis direction ( 1 2 1) has the maximum interaction force, with respect to other directions, because, in this direction of the tip, the density of atoms is more than in other directions. Figures 9 and 10 show how the tip axis direction, with respect to the FCC lattice structure, can aect image quality in the characterization of a sample with a surface trench and a sample with a
Figure 9. Characterization of a surface trench (tip axis direction eect).
Figure 10. Characterization of the vacancy site (tip axis direction eect).
single-atom vacancy. The trench width and depth are 4.9 nm and 2 nm, respectively. As can be seen, three dierent tips can image the trench approximately with similar quality. Although all the tips can detect the vacancy site, it seems that the tip with the axis direction of (0 1 0) can better illustrate the existence of vacancy. However, this result cannot be generalized to the other samples with dierent geometries and dierent surface planes.
CONCLUDING REMARKS
The work presented here, similar to other theoretical studies, involves some limitations that need attention in order to understand its applicability. It must be noted that the use of gold coated nano probes is generally limited, and, therefore, the simulations performed with parameters corresponding to gold ma-terial approximately measure what one might observe using other tip materials that have similar geometry. Nonetheless, this research presents a computational study of AM-AFM in measuring the topography of nanoscale surface trenches, and along this line, the dierent inuences of the tip geometry on the resulting images are investigated. Some of the main conclusions demonstrating the eects of the dierent parameters on the topography measurements are as follows: The geometry of the tip superimposes itself on the
raw scan data measured from the specimen. In fact, the sample prole width is increased due to the tip-sample convolution.
The sample height is decreased because of the tip and sample elastic deformations.
Since the scanning speed is a value more than zero, the image is shifted laterally in the scanning direction.
Tips with large radii are not able to detect small trenches. When the sample feature is sharper than the tip, the image will be dominated by the shape of the tip. Since tips with larger radii have a lower exibility, the height lowering is smaller in these larger tips.
Surface features with sidewall angles larger than the tip sidewall angle cannot be measured successfully. The tip tilt angle leads to an unsymmetrical image
of the trench.
When the number of tip apex atoms at the nearest layer of the tip to the sample skin increases, the tip is not able to scan the sample surface suitably. For instance, the results show that only the tip with one atom at its apex can detect the vacancy site in a sample with a single-atom vacancy.
The tip axis direction, with respect to the FCC lattice structure, has a profound eect on the tip-sample interaction force and, so it aects the mea-sured topography of the sample skin.
REFERENCES
1. Jalili, N. and Laxminarayana, K. \A review of atomic force microscopy imaging systems: application to molecular metrology and biological sciences", Inter-national Journal of Mechatronics, 14(8), pp. 907-945 (2004).
2. Goeken, M. and Kempf, M. \Microstructural proper-ties of super alloys investigated by nanoindentations in an atomic force microscope", ActaMater., 47(3), pp. 1043-1052 (1999).
3. Garcia, R. and Perez, R. \Dynamic atomic force microscopy methods", Surf. Sci. Rep., 47, pp. 197-301 (2002).
4. Abraham, F.F., Batra, I.P. and Ciraci, S. \Eect of tip prole on atomic-force microscope images: a model study", Phy. Rev. Let., 60, pp. 1314-1319 (1988). 5. Shimizu, J., Zhou, L. and Eda, H. \Molecular
dy-namics simulation of afm/m surface observation: inuence of probe tip shape", Proceedings of the 35th International MATADOR Conference, pp. 271-274 (2007).
6. Yan, Y.D., Sun, T. and Dong, S. \Study on eects of tip geometry on AFM nanoscratching tests", Wear, 262, pp. 477-483 (2007).
7. Solares, S.D. \Characterization of deep nanoscale sur-face trenches with AFM using thin carbon nanotube probes in amplitude modulation and frequency-force modulation modes", Meas. Sci. Technol., 19, pp. 1-10 (2008).
8. Jalili, N., Dadfarnia, M. and Dawson, D.M. \A fresh insight into the microcantilever-sample interac-tion problem in non-contact atomic force microscopy", ASME J. Dyn. Syst. Meas. Control, 126, pp. 327-335 (2004).
9. Yuan, L. and Jian-Qiang, Q. \Higher harmonics gener-ation in tapping mode atomic force microscope", Chin. Phys. Lett., 26, pp. 100703-(1-3) (2009).
10. Rubio-Sierra, F.J., Heckl, W.M. and Stark, R.W. \Nanomanipulation by atomic force microscopy", Ad-vanced Engineering Materials, 7, pp. 193-196 (2005). 11. Sunga, I.H. and Kim, D.E. \Study on nanoscale
abra-sive interaction between nanoprobe and self-assembled molecular surface for probe-based nanolithography process", Ultramicroscopy, 107, pp. 1-7 (2007). 12. Lin, J., Fang, T., Wu, C. and Houng, K. \Contact and
frictional behavior of rough surfaces using molecular dynamics combined with fractal theory", Computa-tional Materials Science, 40, pp. 480-484 (2007). 13. Mahboobi, S.H., Meghdari, A., Jalili, N. and Amiri,
F. \Precise positioning and assembly of metallic nan-oclusters as building blocks of nanostructures: A
molecular dynamics study", Physica E, 42, pp. 182-195 (2009).
14. Mahboobi, S.H., Meghdari, A., Jalili, N. and Amiri F. \Two-dimensional atomistic simulation of metallic nanoparticles pushing", Mod. Phys. Lett. B, 23, pp. 2695-2702 (2009).
15. Mahboobi, S.H., Meghdari, A., Jalili, N. and Amiri, F. \Qualitative study of nanocluster positioning process: Planar molecular dynamics simulations", Current Ap-plied Physics, 9(5), pp. 997-1004 (2009).
16. Pishkenari, H.N. and Meghdari, A. \Surface defects characterization with frequency and force modulation atomic force microscopy using molecular dynamics simulations", Current Applied Physics, 10(2), pp. 583-591 (2010).
17. Pishkenari, H.N. and Meghdari, A. \Investigation of the atomic-scale hysteresis in NC-AFM using atomistic dynamics", Physica E, 42, pp. 2069-2077 (2010). 18. Trevethan, T. and Kantorovich, L. \Molecular
dy-namics simulations of atomic scale processes at close approach in non-contact atomic force microscopy", Nanotechnology, 16, pp. S79-S84 (2005).
19. Harada, M., Tsukada, M. and Sasaki, N. \Energy dissipation mechanism of non-contact atomic force microscopy for movable objects", I e-J. Surf. Sci. Nanotech., 6, pp. 1-6 (2008).
20. Solares, S.D., Matsuda, Y. and Goddard, W.A. \In-uence of the carbon nanotube probe tilt angle on the eective probe stiness and image quality in tapping-mode atomic force microscopy", J. Phys. Chem. B, 109, pp. 16658-16664 (2005).
21. Sasaki, N. and Tsukada, M. \Eect of the tip structure on atomic-force microscopy", Physical Review B, 52, pp. 8471-8482 (1995).
22. http://www.budgetsensors.com/Gold.html 23. http://www.nanovip.com/node/6395
24. Park, H.S. and Liu, W.K. \An introduction and tutorial on multiple scale analysis in solids", Computer Methods in Applied Mechanics and Engineering, 193, p. 1733 (2004).
25. Rai-Tabar, H. \Modelling the nano-scale phenomena in condensed matter physics via computer-based nu-merical simulations", Physics Reports, 325, pp. 239-310 (2000).
26. Li, J.H., Dai, X.D., Liang, S.H., Tai, K.P., Kong, Y. and Liu, B.X. \Interatomic potentials of the binary transition metal systems and some applications in materials physics", Physics Reports, 455, pp. 1-134 (2008).
27. Sutton, A.P. and Chen, J. \Long-range nnis-sinclair potentials", Philosophical Magazine Letters, 61, pp. 139-146 (1990).
28. Rai-Tabar, H. and Sutton, A.P. \Long-range nnis-sinclair potentials for F.C.C. metallic alloys", Philo-sophical Magazine Letters, 63, pp. 217-224 (1990).
29. Nose, S. \A unied formulation of the constant tem-perature molecular dynamics methods", Journal of Chemical Physics, 81, Section IIB, pp. 511-519 (1984). 30. Hoover, W.G. \Canonical dynamics: equilibrium phase-space distributions", Physical Review A, 31, pp. 1695-1697 (1985).
31. Rai-Tabar, H. \Modelling the nano-scale phenomena in condensed matter physics via computer-based nu-merical simulations", Physics Reports, 325, pp. 240-310 (2000).
BIOGRAPHIES
Hosein Nejat Pishkenari was born in 1981. He received his B.S. and M.S. degrees in Mechanical En-gineering from Sharif University of Technology in 2003 and 2005, respectively. He is currently a Ph.D. student of Mechanical Engineering and a member of Center of Excellence in Design, Robotics and Automation (CEDRA) at Sharif University of Technology, Tehran, Iran. His research interests include Molecular Dynam-ics Simulations, AFM Modeling and Control Analytical Dynamics, Nonlinear Dynamics and Robotics.
Ali Meghdari received his Ph.D. in Mechanical En-gineering from the University of New Mexico in 1987, and joined the Los Alamos National Laboratory as a Research Scientist for one full year. In 1988, he joined the Sharif University of Technology in Tehran as an As-sistant Professor of Mechanical Engineering. In 1997, he was granted the rank of Full-Professor of Mechanical Engineering at S.U.T. Dr Meghdari has performed extensive research in the areas of Robotics Dynam-ics, Flexible Manipulators Kinematics/DynamDynam-ics, and Dynamic Modeling of Biomechanical Systems. He has published over 160 technical papers in refereed international journals and conferences, and has been the recipient of various scholarships and awards, the latest being: the 2002 Mechanical Engineering Distin-guished Professorship Award by the Iranian Ministry of Science, Research and Technology. He was also nominated and elected as a Fellow of the ASME (American Society of Mechanical Engineers) in 2001. He is currently the Vice-President of Academic Aairs, and the Director of the Center of Excellence in Design, Robotics and Automation (CEDRA) at the Sharif University of Technology.