An evaluation of a community-based risk
prevention programme in three neighbourhoods
report are, however, those of the authors and not necessarily those of the Foundation. Joseph Rowntree Foundation
The Homestead 40 Water End York YO30 6WP
Website: www.jrf.org.uk
© Joseph Rowntree Foundation 2004
First published 2004 by the Joseph Rowntree Foundation
All rights reserved. Reproduction of this report by photocopying or electronic means for non-commercial purposes is permitted. Otherwise, no part of this report may be reproduced, adapted, stored in a retrieval system or transmitted by any means, electronic, mechanical, photocopying, or otherwise without the prior written permission of the Joseph Rowntree Foundation.
ISBN 1 85935 183 2 (paperback)
ISBN 1 85935 184 0 (pdf: available at www.jrf.org.uk)
A CIP catalogue record for this report is available from the British Library. Cover design by Adkins Design
Prepared and printed by: York Publishing Services Ltd 64 Hallfield Road
Layerthorpe York YO31 7ZQ
Tel: 01904 430033; Fax: 01904 430868; Website: www.yps-publishing.co.uk
Further copies of this report, or any other JRF publication, can be obtained either from the JRF website (www.jrf.org.uk/bookshop/) or from our distributor, York Publishing Services Ltd, at the above address.
Acknowledgements vi
1 Introduction 1
Introducing the report 1
Introducing Communities that Care 2
Introducing the research 6
Qualifications and concluding remarks 12
2 Southside 14
Southside profile 14
Phases One and Two 16
Phases Three and Four 20
Evidence of change and local impact 25
Conclusion and postscript 31
3 Westside 33
Westside profile 33
Phases One and Two 36
Phases Three and Four 36
Evidence of change and local impact 46
Conclusion and postscript 47
4 Northside 49
Northside profile 49
Phases One and Two 51
Phases Three and Four 56
Evidence of change and local impact 60
Conclusion and postscript 61
5 Discussion and recommendations for the future 62
Introduction 62
Evaluation limitations 62
Implementation of the Communities that Care approach 63
Key findings and recommendations 64
Lessons for the future: Every Child Matters and the new policy agenda 76
Concluding remarks 78
Notes 80
References 86
This report has been written by Iain Crow and Alan France. It could not have been achieved without the contributions from Mary Hart, Sue Hacking, Tim Conway and Deborah Beck. Although the evaluation research was a collaborative effort it is important to recognise individual contributions. Iain Crow took central responsibility for the outcome evaluation, overseeing the analysis and writing up of this section of the report. Alan France had core responsibility for the process evaluation and oversaw the collection and analysis of data and the writing up of this section of the report.
We would also like to thank the following people for their contribution and support. Special thanks go to Charlie Lloyd at JRF for his continued support throughout this lengthy process. Thanks also to members of the Advisory Group: John Graham, Paul Ekbolm, Ann Fairington, Tim Newburn, David Utting, Rowan Astbury and David Riley. Their comments and ideas were invaluable and helpful at all times. Special thanks also go to all those who volunteered their time and effort within the CTC
demonstration sites. Without their help and willingness to talk to us this evaluation could not have been completed. Finally, thanks to Dawn Lessels, our administrator, who helped us all with organising the fieldwork and the day-to-day management of the research.
Introducing the report
In the mid-1990s the Joseph Rowntree Foundation (JRF) funded the Communities that Care (CTC) prevention initiative.1 This early intervention programme targets
children living in communities and families that are deemed to put them at risk of developing social problems. The CTC approach focuses on specific geographical areas and involves bringing together local community representatives, professionals working in the area and senior managers responsible for service management. Participants are given training and provided with evidence of the levels of risk and protection in their community. From this they design an action plan that seeks to enhance existing services or introduce new ones likely to reduce risk.
Although it has become international, CTC has its origins in the USA.2 In
commissioning the CTC programme in the UK, JRF had to develop an infrastructure to facilitate the implementation of the Communities that Care approach. This
involved four main elements:
• the transference and anglicising of techniques developed in the USA to a UK setting
• setting up an independent charitable organisation responsible for running the CTC programme in the UK
• funding three demonstration projects in the UK
• funding an evaluation of these projects.
This is the second evaluation report on the first three CTC demonstration projects. The first report was based on interim findings and focused on the early development and set-up of the programme. This is the final report of the five-year evaluation. In making the assessment of CTC we incorporate findings from the first interim report while looking in more detail at how the demonstration projects have developed and what impact they had between January 2000 and July 2002. Everything the reader needs to know about the findings of the evaluation is available in this report. In the remainder of this chapter we explain what the Communities that Care programme is about, and say how we set about evaluating the three demonstration projects. Chapters 2, 3 and 4 describe what happened in each of the three areas, what was delivered as a result of CTC activity and what changes, if any, took place as a result of CTC demonstration projects. In the final chapter we discuss the main findings of
Introducing Communities that Care
The empirical and theoretical base of the CTC prevention approach
Two main strands underpin the Communities that Care approach to prevention. First, empirical evidence shows that certain risk factors within communities are associated with particular types of future problem behaviour (Hawkins et al., 1992; Farrington, 1997). Risk factors are types of behaviour and attitudes that children, their siblings, friends or parents may have (Farrington, 2000). They include such things as lack of discipline in families, poor supervision by parents, underachievement in primary school, lack of neighbourhood attachment, and having friends involved in problem behaviours.3 Risk factors are seen to increase the chance that a child will grow into a
young person with problem behaviours (Farrington, 2000). Hawkins et al. (1992) reviewed the longitudinal research evidence in the USA to show how risk factors cluster around four domains: the family, the community, the individual and the school. Farrington (2000) argues that those most at risk of developing problem behaviour are those who have multiple risk factors across the four domains. Twenty-four risk factors have been identified as important in CTC USA, and 17 in CTC UK (see Appendix 2).4
The Communities that Care approach proposes that early intervention and
prevention with children and their families has to be guided by evidence throughout (Hawkins et al., 2002). This is achieved through three processes. First, CTC has developed a number of research tools that are used to identify and measure the levels of risk and protection within geographical areas. The CTC approach to prevention aims to identify and measure the levels of risk factors in defined
geographical areas, highlighting those that are most likely to lead to greater social problems amongst young people, and then target them with interventions. These tools are school self-report surveys and the collation of information from local and national records that constitute a risk audit. Second, CTC provides evidence of ‘what looks promising’ in terms of tackling risk. In 1999 JRF produced a publication called Promising Approaches. It provided information on programmes that had been assessed to be either effective in reducing risk factors or showing promise of doing so.5 Finally, CTC projects are encouraged to evaluate the initiatives they put in place,
and to undertake a regular review of risk and protection by rerunning the risk audit and reassessing the Action Plan after a period of time.
The theoretical basis for CTC is what Catalano and Hawkins (1996) call the social development model. For them, child development is influenced by the quality of the interaction between children and adults. They argue that for children to grow up problem free and healthy they need to be given clear standards of behaviour and
have positive social bonding with adults. To aid this process children and young people need to be given opportunities to be involved and valued in their families, schools and communities, to gain social and learning skills, and to be given recognition and praise, ensuring that their positive behaviour is recognised. The social development model therefore sees the development of pro-social factors as a means of protecting children from the consequences of risk factors. Protective factors are seen as more cross-cutting and contribute to reducing risk in all areas. The CTC approach therefore advocates the reduction of risk factors and the
promotion of pro-social factors that will help children to manage their circumstances better (Pollard et al., 1999).
CTC as a process not a programme
It is important to recognise that, although often referred to as a programme, CTC is more of a process leading to the identification of a programme of work, and a method of facilitating the delivery of well co-ordinated services that reduce risk and increase protection. CTC does not deliver services by itself but facilitates and activates change in a local area. The changes it aims to influence are:
• to transform professional practice (both operational and strategic), creating multi-agency and partnerships working around the provision of children’s services
• to actively involve the local community as partners in the process of identification of risk and protection and designing of programmes to address risk and increase protection
• to use evidence to make changes to services. CTC identifies problem risk and protective factors and levels of protection by the use of locally collected data
• to bring new resources into the area that might enhance existing services, or create new programmes of work.
Table 1 outlines how the CTC process is structured. One of its attractions is having a set-out process that participants can follow. Each CTC project is expected to follow this model.
How CTC is meant to work
The first phase of the CTC process is community readiness. Communities that are interested in using the CTC methodology are assessed on how prepared they are for setting up and implementing an early intervention and prevention programme
(Hawkins et al., 2002). There is limited knowledge in the UK about how this operates in practice although in the USA there has been a growing debate about how
communities can be assessed as ready to receive community-based interventions (Hawkins et al., 2002). It is suggested that readiness needs to ‘define the community that will be involved, identifying key stakeholders who should be engaged, recruiting a community leader to champion the process, assessing conditions, activities and initiatives already operating in the community, and assessing conditions that could inhibit successful implementation of the CTC system’ (Hawkins et al., 2000, p. 959). In our previous report (France and Crow, 2001) we highlighted two factors that seemed most important. First, areas need to assess the quality and extent of partnership arrangements in the area. If there is a history or problem or limited experience of partnership working difficulties arise. Second, there needs to be an assessment prior to implementation of the infrastructure for community engagement. If this does not exist, community involvement can be problematic. Since our report Table 1 The Communities that Care process
Phase One Community readiness 1 Identify and assess the readiness of areas to receive a CTC project
Phase Two Measuring risk and 1 Involve broad membership of community and local protection and auditing professionals, forming Community Boards and existing local resources Key Leader Groups
2 Run training for local community on CTC process Involving a wide range of 3 Undertake a risk and protective audit that
partners in the process measures level of risk and protection 4 Undertake a resource audit to assess local
resources that are already in place and identify gaps
Phase Three Constructing an Action Plan 1 Bring evidence together from risk and resource audits to identify priorities
2 Identify relevant programmes of work to be implemented and write implementation plan. Use
Promising Approaches (Utting, 1999) Phase Four Implementation 1 Identify service delivery agents
2 Identify resources for programmes of work 3 Implement programmes
Phase Five Review 1 Reassess levels of risk
2 Evaluate impact 3 Set new targets 4 Return to Phase Two
Feinberg et al., in their 2002 study of 21 CTC projects in the USA, have also suggested that the attitude of professionals towards prevention also needs to be assessed as negative perspectives can act as a barrier to implementation.
Once an area decides to use the CTC methodology and contracts CTC to provide the materials, Phase Two of analysis and training begins. At the start, a CTC project forms two boards. One is a Community Board that aims to involve a broad range of local people and local practitioners working in the programme area. This could include local teachers, district nurses, community development workers and social workers. The Community Board is responsible for the day-to-day running of the project, the management of resources and the overseeing of the development and implementation of the local Action Plan.
The second group is a Key Leaders Group. This involves senior professionals such as Directors of Education and Social Services responsible for strategic development and services across the city. Key Leaders are seen as essential to the programme and are expected to meet regularly to help the programme progress. They help the Community Board in four ways. First, they support the involvement of local workers. They ensure that time is allocated in the workloads of professionals to give priority to the work of CTC. Sending a strong message about the importance of the CTC
programme to local managers and professionals ensures that it gets local support. Second, Key Leaders identify resources and opportunities for drawing in financial support for the programme. This can include linking CTC into other national
initiatives and funding programmes. Third, Key Leaders have the power to resolve problems that may be hindering the work. Finally, Key Leaders have a role in
‘championing’ the CTC programme, ensuring it is recognised locally as an important initiative that needs to be fully integrated into strategic planning. It is expected that both these groups will, over the life of the programme, have a change in personnel.
CTC also advocates the use of a local co-ordinator. These should be brought in early to help the local project go through the assessment process that they have designed. They also have responsibility for involving and supporting the local community,
liaising with the strategic partners and other agencies, and fundraising. Co-ordinators are not expected to deliver programmes, but they are expected to help bring in
funding and resources from other services or initiatives so that the Action Plan can be implemented.
their areas. This risk audit, as it is called, is compiled from questionnaires completed by young people in the area, and from records available locally and nationally (what American researchers refer to as archival data). From this evidence the Community Board identifies between three and five risk factors that need to be targeted and reduced and undertakes an analysis of resources (a resource audit) to identify gaps in services where changes need to be made. Once risk and resource audits have been undertaken the Community Boards design an Action Plan to be implemented in local areas. This Action Plan matches the risks to be tackled with the services that need to be put in place to reduce those risks. The selection of programmes is guided by existing evidence of what works or looks promising,6 ensuring that initiatives
chosen are evidence-based. Local projects are encouraged to select programmes suitable for tackling elevated risk factors and low levels of protection identified for targeting. Once the Action Plan is in place, projects are expected to set up task groups with a mixture of professionals and local people. Their role is to oversee the implementation of the programme of work and to resolve any difficulties that might occur. Since CTC itself has no resources to deliver services, delivery is the
responsibility of others.
Introducing the research
Reading about how research was done is often regarded as the least interesting part of any report, but it is important to explain how we studied the first three CTC
projects in the UK.7 The evaluation of community-based prevention programmes in
general, and of CTC in particular, has itself been the subject of much debate. This is not the place to describe that debate in detail, although a review of the debate and our response to it can be found elsewhere (Crow, 2000 and Crow, 2001, pp. 52–6), and it is also referred to in the methodological paper available at http://
www.shef.ac.uk/ccr/.
Our evaluation sought to address three main questions:
1 Has CTC been successfully implemented? This involved looking at how the CTC process has been used and what new services were delivered to children and families as a result of the three CTC demonstration projects’ involvement with the CTC process.
2 Did any change occur in the three demonstration areas?
3 What caused any change and what role (if any) did the three demonstration projects have in influencing any identifiable change?
Looking at process and outcomes
In order to address these three questions we looked at both the process by which the projects were implemented and their outcomes. While CTC is a programme that has a theoretical base and guidance on how it should be implemented, it was still necessary to look carefully at how it was implemented. Process research enables researchers to look at the extent to which the programme has been implemented in the way intended, what problems have been encountered in implementing the programme, and what lessons can be learned that can be passed on to others (Weiss, 1998; Shaw, 1999). It also enables the researchers to interpret the results of the programme, so that it is possible to say not only whether it worked, but why it may have worked or not, and whether some aspects worked better than others in particular contexts (Pawson and Tilley, 1998). The process evaluation mainly involved qualitative research, including observations and attendance at meetings, analysing documentary sources, and interviews with the key personnel concerned, but more structured questionnaires were also used. For example, the research team attended over 150 meetings and interviewed over 200 professionals and local people over the life of the evaluation.
The outcome of the CTC demonstration projects can be evaluated by reference to both its long-term goals and its medium-term aim. In the long term, the goal is to reduce the levels of four problem behaviours among young people: drug abuse, youth crime, school-age pregnancy and school failure. The CTC proposition is that these behaviours can be influenced by addressing certain factors which either increase the risks of young people becoming involved in them or protect them against involvement (Hawkins et al., 1992). Thus, in the medium term it is critical to look at the extent to which there are changes in the risk and protective factors as a measure of outcome. Measuring changes in problem behaviour can only come further down the road of implementation. Our evaluation could only, at this stage of implementation of the local projects, hope to establish a baseline measurement and detect short-term effects indicated by changes in the percentage of children with high levels of risk or low levels of protection using an instrument similar to that
recommended by CTC USA. It is far too early to identify longer-term outcomes.
Research design
The research in this evaluation incorporated a before-and-after design to evaluate the impact of CTC by measuring the amount of change in the risk and protective factors before and after intervention in the three areas where CTC was taking place.8
the University of Oxford conducting a survey of schools in the summer of that year and producing a report on archival data the following year. The information from that survey was used as the basis for the three demonstration risk audits. Our intention was to use this material as the basis for our evaluation baseline (before measure).
In addition to collecting information from the three areas where CTC was taking place, it was also decided to collect similar information from comparison areas that were as similar as possible to the CTC implementation areas. Amongst researchers this is known as a classic ‘experimental’ and ‘control’ design, although our
experience of large-scale social research told us that in the kind of study that we had in prospect, this kind of terminology, which is more appropriate to the laboratory, should not be used too literally. Instead we saw the non-CTC comparison areas as being more of a point of reference outside the area where the projects were being implemented so that we could see what was happening elsewhere, it would also help us judge the impact of CTC compared to other trends and developments in youth behaviour and attitudes.
Thus the original research design can be represented as shown in Table 2.
The original intention of our evaluation was to measure change in risk and protection using the same data collected for the risk audits undertaken by CTC UK for the three CTC demonstration projects. This included school survey data, and local and
national records. However, the original data collected and collated by CTC UK9 was
problematic and not of the quality we required for our analysis. In our review of the risk audits we discovered that the data collected did not conform to CTC USA
standards of measurement (see Hawkins et al., 1997). The school-based self-report survey did not use the USA-validated questions and many questions that would contribute to constructing a reliable measure of risk and protection were missing. We also identified significant problems with response rates and the process used to collect the survey data. It was also the case that the local and national records proved to be inadequate for the purpose of evaluation. First, much of the data used did not have temporal or spatial relevance. Second, the quality of the data was questionable. We had concerns that much of it was unreliable or limited in its ability to measure change over time. As documented elsewhere,10 getting good-quality data
on local areas is very difficult. The various items of information used for CTC risk
Table 2 CTC research design
CTC Non-CTC
Northside A X
Westside B Y
audits were assessed by us on five criteria: their robustness, spatial and temporal viability, availability and comparability. Only schools data met all five criteria.11 Thus,
the archival records material has been used here mainly to place the areas studied in their social and economic contexts, and only in a few instances to explore
changes.12 To undertake this we have relied upon the Deprivation Index (DTLR,
2000), Neighbourhood Statistics (ONS, 2001) and schools data (DfES, 2002).
As a result, the main instrument for our evaluation for measuring change was a school-based self-report survey that we designed. In the CTC model the school survey stands as a proxy measure of community-level risk and protection (Hawkins et al., 2002). We took the USA survey as the basis for the construction of our evaluation survey and although it still needed some ‘anglicising’ it reflected the standards set by the USA as a measure of risk and protection (Arthur et al., 1999; Pollard et al., 1999). Modified versions of our survey have since been used by CTC UK for risk audits in new projects, in addition to those studied here. It has also been used for a national survey (Beinert et al., 200213) and for the national evaluation of
On Track phase one (Armstrong et al., 200414).
One final point that the reader needs to be aware of was the delay in implementation of the three demonstration projects.15 It was assumed by all involved in developing
CTC in the UK that implementation would take place over a three-year period. Our evaluation strategy was designed around this time frame. After 18 months it became clear that this time frame was inappropriate and that if we were to be in any position to comment on outcomes of the programme a longer time period was needed to capture implementation of the Action Plans. As a result JRF agreed an extension to the evaluation, taking it from three years to five. Our questionnaire was therefore administered on two occasions, immediately prior to the implementation of the CTC Action Plans (1999/2000) and just over two and a half years later (Autumn 2002). The findings in this report relate to this timescale although where appropriate we have brought information up to date (January 2004).
The school surveys
It is necessary to say a little more about the school surveys and the response rates (see Appendix 3 for details of response rates). Nearly 11,000 children answered the two school surveys (5,516 the first and 5,334 the second). The surveys included questions about pupils’ personal and social circumstances, their families,
responses to the various questions were put together to compose 16 risk factors and seven protective factors.16 Identical questionnaires were used for both surveys.
Inevitably such a large-scale study produced a wealth of information that cannot be presented in detail here. What follows highlights the main results relevant to the evaluation of CTC.
All the children in schools covering the CTC and comparison areas completed survey questionnaires. All schools undertook a second run of the survey with those students who had been missing first time around. This increased the response rates across the whole programme. However, only some of these children actually lived in the CTC or comparison area concerned. Therefore it was possible to distinguish between four groups of pupils on the basis of whether they went to schools covering the CTC or comparison area, and on whether or not they actually lived in the CTC or comparison areas, or lived outside them, as Table 3 illustrates.
Initially the intention was to make before-and-after comparisons between children who lived in the CTC areas with those who lived in the comparison areas. However, preliminary analysis showed that, apart from Northside, the children from the CTC and comparison areas were not comparable in various respects. Furthermore, that approach would not eliminate any effects the schools themselves might have: that is, additional interventions run as part of the school programme not included in the measurement, or simply differences in the quality of the schools.
Table 3 Research cohorts17
CTC Non-CTC
(a) Live in area (b) Live outside area (c) Live in area (d) Live outside area 2,233 (31%) 4,943 (69%) 2,860 (57%) 2,179 (43%)
Consequently the main focus of the analysis presented here compares only those children who went to schools serving a CTC project area who actually lived in the CTC area (cell (a) above), with those pupils who went to the same schools, but did not live in the CTC area (cell (b) above).18
In looking at whether there was any evidence of change we concentrated on whether the proportion of children in the CTC area scoring positive for risk factors had
changed. We also looked at children scoring very high on these risk factors and for reductions in high risk. We therefore considered data that showed the percentage change in the proportion of the population having ‘any risk’ and ‘high risk’. ‘Any risk’ simply means the percentage of children who were at risk at all in relation to the various CTC risk factors, and ‘high risk’ refers to those children who said ‘yes’ in response to more than half of the questionnaire items that made up a risk factor.19 It
is important to point out that the ‘any risk’ measure includes ‘high risk’. ‘High protection’ refers to children scoring positive for more than half of the items in the factors and ‘any protection’ refers to children with any items positive. High protection is good and low protection is a matter of concern. These factors were considered in relation to the various ‘domains’ that CTC uses: community, family, school and friends. To be able to understand what the results refer to it is necessary to know what the risk and protective factors refer to, and a table summarising them is presented in Appendix 2.
The construction of alternative risk audits
As a part of our analysis we decided that it would be valuable to conduct our own risk audits to help us assess how effective CTC had been in targeting the most appropriate risk and protection factors in the three areas. CTC UK provided all three demonstration projects with a risk audit in 1999 based upon data collected in spring 1998. As outlined above, the survey used by them was not the instrument
recommended by CTC USA and it did not assess risk and protection appropriately. Furthermore the archival data did not conform to CTC standards (Hawkins et al., 1997). Once it became clear that the data used in the risk audits was inappropriate for our evaluation needs we collected data in 1999/2000 for our before measure (as discussed above). Our average was taken from the mean scores of all the population surveyed in the CTC schools living in and out of the CTC area and in the comparison areas. It is important to recognise this is not a national average, but functions
adequately as a comparison for deprived neighbourhoods for this study. Although this data is 12 to 18 months newer than the original risk audit data collected by CTC UK we would not expect the levels of risk and protection to have changed
substantially. As a result we have used our before data to undertake and construct a risk and protection audit of the three demonstration projects and the comparison areas. Initially, we used the CTC USA method of aggregating items to risk factors to construct an average figure for risk comparing the results from each area. We did not use standardised scoring because there were no national comparisons. This was the method used in the first risk demonstration audit so our results should reflect these findings. In constructing this analysis we have drawn upon measurement methods used by CTC USA. They have a long history of measuring risk and have developed a detailed methodology that identifies, scientifically, levels of risk and protection through the school survey. Our final audit did not replicate the method for two
reasons. First, some of the survey questions used to construct the risk and protective measures vary between the USA and UK and therefore we were not in a position to
reasons of integrity of methods, that this is a reliable and accurate measure for identifying categorically high levels of risk and low levels of protection equivalent to the system used by CTC USA. This being said, the differences between the two methods of analysis are minimal for this study and therefore we would not expect major differences to emerge in the identification of values of risk or protection that are outside the range expected for a normal population.
Qualifications and concluding remarks
There are four important factors that need to be kept in mind when reading this report. First, evaluating a new project in its early stages is always inclined to be problematic (Fulbright-Anderson et al., 1999). The three demonstration projects are still in their formative stages, and what one studies may not be the projects in their final form. It is also the case that social interventions seldom achieve a static form, being more likely to evolve as personnel, and the circumstances in which they have to operate, change. Evaluation is a documentation of this process as much as anything else and sometimes it is difficult to know what is being measured. Second, Communities that Care is a long-term programme, the true results of which have to be viewed over many years, whereas we were only able to look at the first two and a half years. It could be argued that the projects will have had insufficient opportunity to make a noticeable impact in this time. Several of the initiatives in pilot areas, based on Promising Approaches,20 involve work with very young children and their
families. While the school surveys are used as an indicator of community change in CTC, because they were carried out in secondary schools they were not able to measure change for those under the age of eleven (or for parents and the wider community). Third, measuring changes that arise as a result of community-based programmes like CTC is incredibly challenging and complex (Weiss, 1998; Fulbright-Anderson et al., 1999). Being able to capture the impact of individual programmes on individual behaviour is hard enough (Utting et al., 2001) but CTC is a community-focused initiative and we were asked to measure CTC not at the level of individuals but at the community level. Evidence from elsewhere shows that such an approach is not without its potential difficulties and problems (Pawson and Tilley, 1998;
Fulbright-Anderson et al., 1999; Hollister and Hill, 1999). For example, making connections between project work programmes and evidence of social change is incredibly difficult. In the discussion that follows it is important to remember this issue because it may have implications for our final results. We shall also return to it in our concluding discussions. Finally, it is also important to recognise the likelihood that being evaluated had some impact on the demonstration projects concerned. In the early stages of the research the project participants were very aware of being studied, and their co-operation in obtaining information and in obtaining access to schools was critical (France, 2001). We also provided each school with its own report
of its data. How they used this in their planning remains an unknown. The
researchers did maintain a clear role as researchers, rather than as agents in the change process. Nonetheless the possibility that the research did have some unintended influence in making the projects more self-conscious about what they were doing needs to be borne in mind in reading this report.
What follows is a report about how these three demonstration projects have developed over the first five years of their project life. It is not necessarily an indication of how they will always be, or of their long-term outcomes. Neither is it a definitive evaluation of the CTC approach although it can, we believe, make an important contribution to this debate. Subsequent CTC projects that have not been evaluated as yet may well have developed differently. They are also likely to have developed differently for a number of other reasons, not least because they and CTC UK will have had the lessons and experiences of these first three projects available to draw on as well as the products of the evaluation: for example, the new school survey. So care needs to be taken in assuming that the results of this study can be generalised to other CTC projects in the UK.
Southside profile
The Southside CTC area was located in a Welsh city with a population of just under 250,000. Historically, its economy was built upon shipbuilding and coal mining. These industries declined substantially in the 1980s leaving the city with a high level of unemployment, although by 2001 unemployment had dropped to near the national average.1 The city was predominately white, with only 1 per cent of its population being
from ethnic minorities.2 Levels of crime in the city varied. Sexual offences, robbery and
burglary were all below the national average, while the highest levels were in motor vehicle offences, with the rate of theft of a motor vehicle being more than double the national average. Figures for theft from a motor vehicle were also high.
The economic and social profile of Southside
The CTC area consisted of one full ward and a small section of an adjoining ward.3
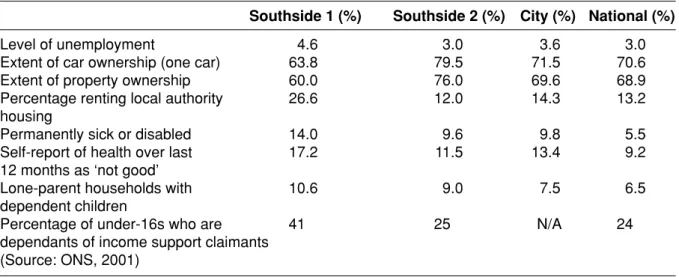
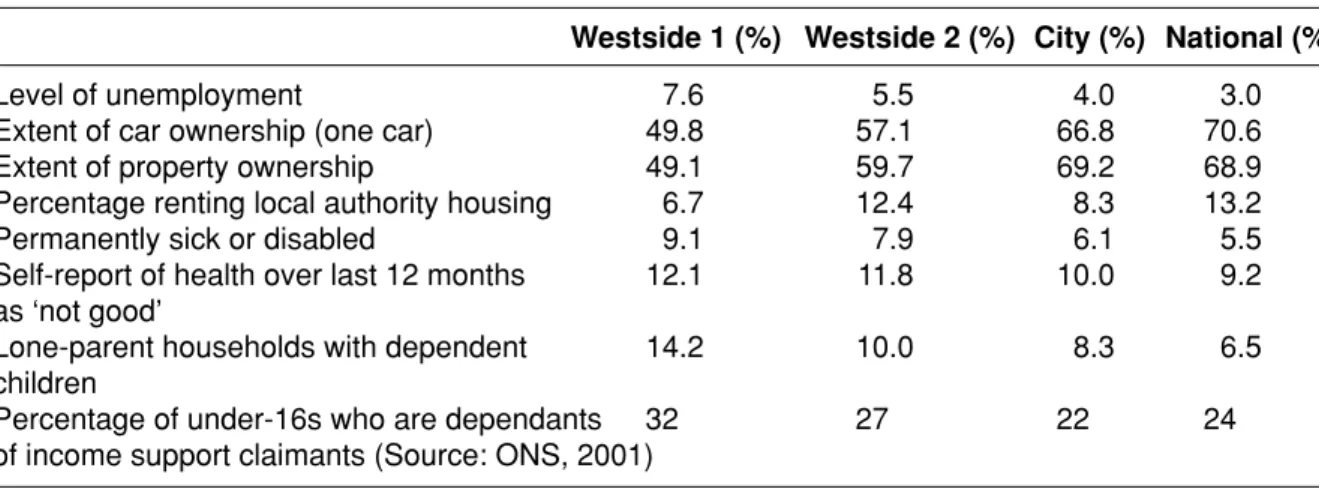
The main ward (Southside 1) had a population of 6,342. It was predominately white, and the proportion of young people (under 18) was above the national average. In terms of deprivation, the main ward is within the top 15 per cent of the most deprived wards in Wales (see Table A2 in Appendix 1).4 As shown in Table 4, unemployment in
the area was higher than both the city and national average and the number of people not owning a car was also below the national average. Sixty per cent of households owned their own property, although there were also a large number of people who rented from the local authority. Most of the property in the area was of a high or good standard. Health was also a problem with those registered as
permanently sick or disabled being three times the national average. Similarly for those asked to self-report their health the figures for poor health were nearly double the national average. It was this ward that the work in Southside CTC focused upon.
Table 4 Economic and social characteristics of Southside
Southside 1 (%) Southside 2 (%) City (%) National (%)
Level of unemployment 4.6 3.0 3.6 3.0
Extent of car ownership (one car) 63.8 79.5 71.5 70.6
Extent of property ownership 60.0 76.0 69.6 68.9
Percentage renting local authority 26.6 12.0 14.3 13.2
housing
Permanently sick or disabled 14.0 9.6 9.8 5.5
Self-report of health over last 17.2 11.5 13.4 9.2
12 months as ‘not good’
Lone-parent households with 10.6 9.0 7.5 6.5
dependent children
Percentage of under-16s who are 41 25 N/A 24
dependants of income support claimants (Source: ONS, 2001)
The part ward (Southside 2) was included because, although official figures did not show it as an area of need, and it appeared to be reasonably affluent and without major social problems, senior local professionals believed that the area had
significant problems relating to housing and youth nuisance which had never been properly recognised in the allocation of resources until then. Levels of deprivation were also low compared to the other CTC areas. For example, it was ranked 466th in terms of deprivation (see Table A2 in Appendix 1).5 None of the officially
recognised deprivation domains were in the top 15 per cent of most problematic areas. As shown in Table 4, in terms of housing tenure, two-thirds of the population owned their own property with 12 per cent renting from the local authority and 7 per cent renting privately. Unemployment was also below the national average and the number of people with a car was well above the national average. Despite this it was felt that these figures masked pockets of deprivation and other social problems that only local professionals and local people were aware of. For example, while
deprivation seemed low, health problems were well above the national average. Those registered permanently sick or disabled are nearly double the national average.
From our school survey data collected in 2000, Southside was, in the majority of cases, similar to the average community in the UK.6 It was a reasonably stable
environment with only 15 per cent of young people saying they had changed homes more than three times. Young people living in the CTC area also had positive
perspectives of their communities. Eight out of ten children said they liked living there. About a fifth of young people indicated they would like to leave their neighbourhood, while a quarter (24 per cent) felt unsafe at night. Where figures differed from the national average was in perceptions of crime and drug dealing. In national figures 23 per cent of all young people stated that they thought crime and drug dealing was a problem in their communities; in Southside this figure was 38 per cent.
The Southside schools
The CTC area in Southside had a large secondary school located in the centre of the main ward. A large proportion of local children and young people attended this
school. Historically, it was a school with substantial difficulties regarding
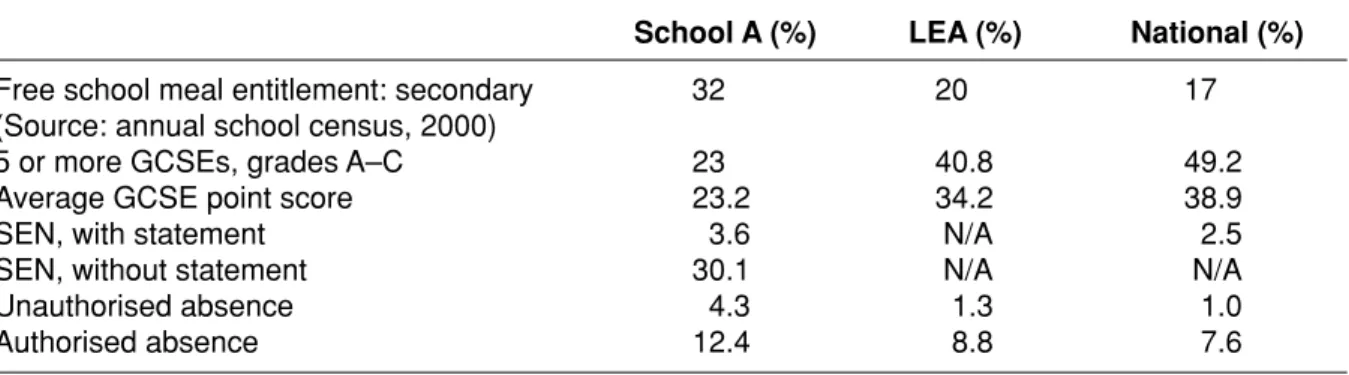
achievement. For example, in 1996/97 only 19 per cent of students managed to achieve five GCSEs at grades A–C. By 2000 the school had managed to improve its results to 28 per cent (see Table 5). The school saw itself as a ‘community school’, encouraging closer working relationships with parents and local people. As a result it
For example, in 2000 it appointed an Attendance Manager who was responsible for monitoring and improving attendance. The school also reconstructed its discipline policy and improved its internal referral system for children identified as having problems. A second secondary school was located on the edge of the main ward, close to the boundary with the part ward. Approximately 20 per cent of this school population lived in the CTC area.8 Historically this school had been more successful.
For example, as shown in Table 5, 45 per cent of its pupils in 2000 who took GCSEs gained five passes at A–C. In general young people from the CTC areas who
attended these two schools said that they liked their school experience. For example, from our self-report data 75 per cent said that they often or very often enjoyed school subjects. These figures matched the national average,9 as did figures
on truanting or being bullied. Variations existed between age groups, with older pupils (above Year 7) likely to have less positive attitudes about school, to have truanted more and to have experienced bullying.10 This is comparable to national
figures.
One of the unique developments in Southside was the introduction of a Learning House. Only four of these exist in the country, involving two schools working
collaboratively to try and improve local levels of achievement. Its key objective was to target resources at children who were disaffected and lacking the skills to gain access to the mainstream curriculum. After being assessed, identified children attend for two days a week. It was claimed that the results were very good, with attendance improving by 90 per cent.
Phases One and Two
Set-up and early implementation in Southside
The Southside ward had a well-established community development programme in place from the mid-1990s. In the early stages of the CTC project, concerns were raised about the ability of CTC and the community development programme to work together. As work progressed, although tensions remained, the two programmes managed to work well together, and both projects found collaboration possible and
Table 5 Southside school indicators, 20007
School A (%) School B (%) LEA (%) National (%)
Free school meal entitlement 39 24 21 18
(Source: annual school census, 2000)
5 or more GCSEs, grades A–C 28 45 46 48
Unauthorised absence 13.6 1.4 1.9 1.5
valuable. As a result of an existing social infrastructure there were many local people already active within the local area. This was a benefit for the development of the CTC programme. In addition, the community development programme was already developing partnership working within the local area. Many professionals met on a regular basis and knew each other’s work prior to CTC arriving. The main city of Southside also had a long history of partnership working, which was already well established at the strategic level, and senior professionals were already working collectively to develop more co-ordinated services. As a result of both of these developments CTC was able to integrate with, and build upon, an existing local infrastructure. This aided its setting up and early development (France and Crow, 2001). As a result Southside was one of the most active demonstration projects. It had the broadest membership of local professionals and had the highest numbers of local people involved. While it was the last to start it completed Phase Two (set-up) almost at the same time as the other two projects.
The selection of risk and protective factors
The selection of risk and protective factors in Southside was lengthy and
challenging. The audits provided by CTC UK were too complex, not well focused on measuring risk factors, had no evidence about protective factors and were poorly presented. There was also a major problem with the audits because there was no national average against which to compare Southside levels of risk. As a result, people working in the project found it difficult to make a judgement about which risk and protective factors to select. Although they tried to maintain an objective and scientific approach to analysis it remained a struggle. The selection process became a negotiation between local perspectives and understandings and the ‘scientific’ evidence provided by the risk audit. CTC UK claim that this is an important part of the process in that it allows for an analysis to be made that considers and reflects local circumstances.
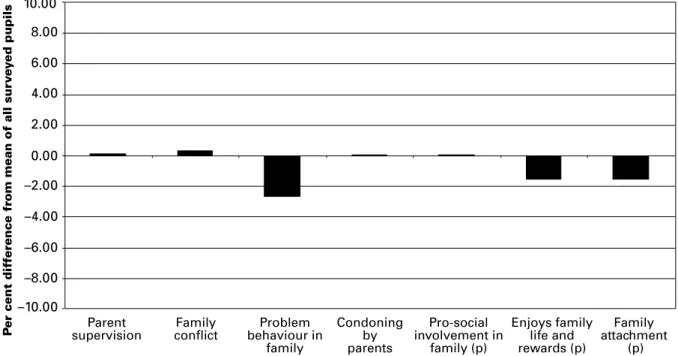
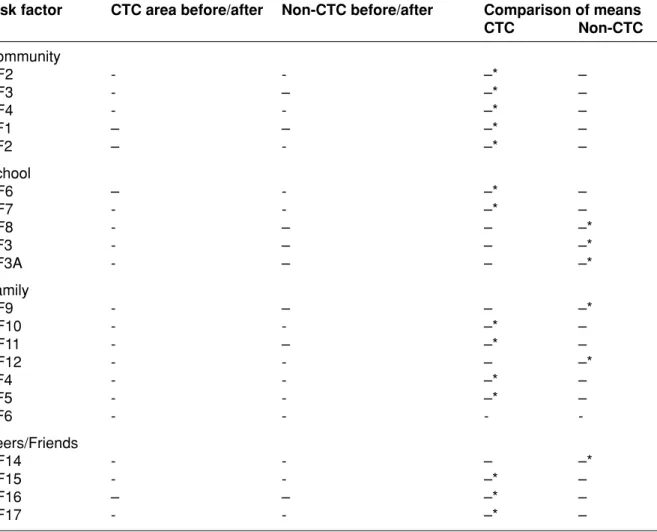
Southside selected five risk factors: disadvantaged neighbourhoods, low achievement in schools, poor parental supervision, availability of drugs, and alienation and lack of social commitment. As outlined above we undertook an alternative risk audit constructed around the method used in the USA (see Figures 1–4).11 In Figures 1–4 the risk and protective factors are outlined in domains. If the
risk factors are above the ‘0’ line then the risk is above the average (negative). If protection is below the ‘0’ line then protection is below the average (negative). When it comes to looking at our survey data the risks selected by the CTC project do not
fact there are no risk factors within the family domain that are a point above the average. This being said, protection is lower especially in the area of family rewards and family attachment. Finally, like the other three risk factors targeted by the CTC audit, alienation and lack of social commitment (Figure 2) comes below the average score. In fact ‘friends involved in problem behaviour’ would have been a more relevant risk factor to target.
8.00 10.00
Parent
supervision conflictFamily behaviour inProblem family Condoning by parents Pro-social involvement in family (p) Enjoys family life and rewards (p) Family attachment (p) P
er cent dif
ference fr
om mean of all sur
vey
ed pupils 6.00
4.00 2.00 0.00 –2.00 –4.00 –6.00 –8.00 –10.00 8.00 10.00 Aggressive
behaviour Alienation/socialcommitment Condoningattitudes Early involvementin problem behaviour
Friends involved in problem
behaviour
P
er cent dif
ference fr
om mean of all sur
vey
ed pupils 6.00
4.00 2.00 0.00 –2.00 –4.00 –6.00 –8.00 –10.00
Figure 1 Risk and protection profile relative to average scores: family factors, Southside
Figure 2 Risk and protection profile relative to average scores: peer/individual factors, Southside
Figure 3 Risk and protection profile relative to average scores: school factors, Southside
8.00 10.00
Lack of commitment
and truancy disorganisationSchool involvement (p)Pro-social communicationPositive home/school (p) 6.00
4.00 2.00
0.00 –2.00 –4.00 –6.00 –8.00 –10.00
Per cent dif
ference fr
om mean of all sur
vey
ed pupils
Figure 4 Risk and protection profile relative to average scores: community factors, Southside
8.00 10.00
Disorganisation and neglect
Drugs/substances available
Neighbourhood attachment
Involvement/ activities in neighbourhood (p)
Friendly neighbours (p)
P
er cent dif
ference fr
om mean of all sur
vey
ed pupils 6.00
4.00 2.00
0.00 –2.00 –4.00 –6.00 –8.00 –10.00
Southside also selected two risk factors that were not measured by the survey and therefore could not be measured using our survey data. These are ‘disadvantaged neighbourhoods’ and ‘low achievement in schools’. The evidence from national data sets for selecting these two risk factors is not strong. In terms of deprivation the main CTC area in Southside comes out in the top 15 per cent of deprived communities in Wales and although the levels in Wales and England cannot be compared Southside would not come into the top 10 per cent of deprived communities in England. It is also the case that the second ward included in Southside as a part of the CTC area is even less deprived than the first. This weakens the case for targeting the CTC area as a disadvantaged neighbourhood. Similarly, in terms of low achievement the schools that serve the CTC in Southside have historically been improving. While the main secondary school is still below the national average it is a school that is
improving every year. The second school is even better in that it has just about reached national-average status.
Clearly, the problems associated with the construction and development of the Southside risk audit had a major effect on the ability of the project to select the
highest and most problematic risk factors. Not having the quality risk audit report that matched the standards set down in the USA and not having a normative measure created real problems for Southside to be able to select the highest risk factors. We believe that if the local Community Boards had been given a risk audit that
conformed to the CTC USA standards it is likely that their choice of risk and protective factors would have been different. This is an important issue and something we will return to in our concluding discussion in Chapter 5.
Phases Three and Four
Project development and action planning
In the first phase of the CTC programme Southside engaged more professionals and local people than any of the other demonstration projects, and was also more
focused and organised. As a result, when it came to implementation the project was in a stronger position to achieve success. Southside’s Action Plan was developed in consultation with local and city-wide organisations and had an extensive range of targets (19). This allowed for failure of individual targets without resultant programme failure. The targets were broad, and included changing and enhancing existing
services, as well as creating new services. They also included some ‘quick win’ targets, which helped sustain community engagement, as well as keeping professionals interested in the programme, since it could be seen to deliver
outcomes quickly. The organisational approach to implementing the Action Plan was similar to Northside and Westside. Task groups were organised around each risk
factor, and their brief was to ensure that all the relevant targets were worked on and implemented. The task groups themselves had regular reviews and there was an annual Action Plan review. This allowed the Action Plan to remain relevant, and kept the work focused on the entire range of targets.
Implementation of the Action Plan
The Poor Parental Supervision and Discipline task group (see Table 6) oversaw the implementation of four of the six programmes outlined in the Action Plan. Enhanced detection and treatment of post-natal depression and the Home Start programme were implemented before the CTC Action Plan was established. Both were city-wide initiatives that trained professionals. The task group’s most evident success during the demonstration project was the running of three different parenting courses, two of which were in Promising Approaches (Parent Network and Children’s Behaviour). Six courses were run in total across the three parenting programmes. Twenty-six parents took part with 19 completing the full programme of training. Courses ran for eight weeks and each session was for one to two hours. The task group was also responsible for introducing the High Scope curriculum in a local nursery with a Mother and Baby group. No information was available about how many people took part. No progress was made on the plans to improve screening and speech therapy provision for young children during the demonstration period.12
The Disadvantaged Neighbourhood task group organised two joint action projects. The housing management initiative was developed with the help of CTC. It appointed a senior dedicated officer for a local estate that had suffered from high levels of vandalism and voids. The task group also achieved a number of other successes, including the implementation of a multi-agency clean-up campaign, the employment of part-time community wardens on the estate and the development of a local newsletter.
The second joint action programme was the Community Policing Initiatives. Part of the work involved training housing department and police staff in mediation skills. Twelve members of staff were identified, but difficulties arose over getting training in place, as a consequence of which little happened. This task group also established a Domestic Violence forum involving over 40 people. It set up its own steering group that met regularly during the demonstration period. It developed localised systems of communication with the aim of speeding up response times to identified problems.
The Availability of Drugs task group developed a number of local projects that aimed to reduce young people’s involvement in the abuse of tobacco, alcohol and other drugs such as cannabis. This involved a crackdown by police, Trading Standards and customs on unlicensed traders of tobacco and alcohol. As a direct result of the task group’s recommendations, local agencies targeted tobacco and alcohol
bootlegging in 2000. This included a raid on a local estate by Customs and Excise in summer 2000, the secondment of a local officer temporarily to the Drugs Squad, and a telephone number to report bootleggers.
The task group for the risk factor related to alienation and lack of commitment helped increase the level of youth work provision within the area. The local community development project developed Youth Work Alliance, which sought to co-ordinate and expand youth provision. Objective One15 money that CTC had secured was
used to run programmes of work. Ten initiatives were developed under this
programme of work of which CTC was a partner. This included the appointment of Table 6 Programme overview and change
Risk factor Action planned Action Change Was change
identified implemented identified attributable
over timescale to CTC?
Disadvantaged Housing management Housing management Not able to
neighbourhood project project measure ___
Domestic Violence forum Domestic Violence forum No More Repeats
programme
Training of mediators
Availability of Drugs availability Drugs availability Promising Possible
drugs campaign campaign evidence
Peer education programme
Poor parental High Scope programme High Scope programme
supervision Decrease in Possible
Health visitor Health visitor risk levels in
Home Start Home Start family domain13
Parent training Parent training Training social workers
Speech therapy
Low Parent classes in school Increase in
achievement Cognitive skills programme GCSE results
in schools Home/school project 5 with A–C. No
Mentoring project Increase in Key
Stage 2 results in 5 out of 6 primary schools
Alienation and Youth work initiative Youth work initiative Decrease in Possible
lack of Access to further risk levels in
new staff, the running of targeted programmes for young people at risk, and the development of new facilities in the area. The project did not collect information on the number of young people involved, but it was claimed to be ‘substantial’.
The only task group that was unable to fully implement any initiatives was the School task group. The task group suffered from having no direct representation from
primary schools. Some of this tension was felt to stem from the negative
connotations of the title of the risk factor, ‘low achievement beginning in primary school’. Another problem was a history of poor interaction between the schools. CTC was directly responsible for the introduction of Project Charlie in one local primary school but the hoped-for introduction of Talk Health made little progress. There was also limited progress in establishing after-school facilities, with some primary and secondary schools running different forms of provision, using Neighbourhood Opportunities Fund (NOF) funding.
What factors affected implementation?
Southside managed to implement the most initiatives amongst the three demonstration projects. This happened for three main reasons.
Good project infrastructure and management
Part of the strength of the Southside project was the establishment, early in the life of the programme, of good principles of project management. Two factors made
substantial contributions. First, although the project did not undertake any formal evaluation each task group had to undertake regular reviews of its work. This
involved all partners reflecting on practice and identifying whether targets were being met. From this it was possible for the Action Plan to be continually assessed, and to identify problems and difficulties. As a result resources and energy could be
deflected from areas of work where little progress was being made. For example, it was recognised early in the process of implementation that schools needed senior management involvement because the problems were of a deep-seated nature. Second, possible future problems were identified in advance so that they could be avoided. This was especially relevant regarding a change in co-ordination. Southside had a change of co-ordinator, but unlike Northside and Westside a strategy was developed that help to avoid problems and delay in the changeover. This approach to project management helped to maintain continuity and momentum.
towards the end of the period, CTC became part of the city’s developmental plan so that it could be continued and extend its area of cover. Additionally, Southside had the bonus of committed and relevant Key Leaders. For example the Key Leaders Executive included the Head of Social Services, the Head of Probation, a senior police officer, the Director of Housing and the local secondary head teacher. This ensured that there was CTC representation at almost all levels.16 At the operational
level, Southside workers were well supported by senior management in their CTC role, and therefore it was easier for them to remain involved. There also was a commitment to replace them by senior management if local professionals moved post. However, despite the local Director of Education’s role as chair of the Key Leaders, and the local head teacher being a Key Leader, Southside did have real difficulties implementing programmes in schools, as detailed above.
From the beginning of the demonstration project there were attempts to ensure that there was as little divide as possible between Key Leaders and the Community Board members. This was addressed by the use of mixed meetings and events and giving access to all meetings of representatives from either or both groups. The advantage of this was the enhancement of partnership working and sometimes more tangible benefits were evident. The Southside project also involved a broad section of the community. There were several factors that helped to achieve this. The CTC area itself covered one entire ward and a small part of another. Although there was little shared sense of community, efforts were made from the beginning of the project to ensure that no parts of the CTC area were excluded. Therefore meetings were rotated around the area and events were held in all the different parts. There was already a history of community engagement in the area, without the tensions that had existed in Westside. Tenants’ groups were running, which made it easier to attract people to become involved in CTC, and some shared facilities already
existed. It was also the case that a community development programme was already running when CTC was set up. Initially there were concerns that this could cause some tension, since the two projects had similar remits. However the two worked well together, which benefited CTC by giving it more access to the community, and allowed it to build on existing partnership working and community engagement. Of further benefit to the CTC project was the fact that a Family Centre was set up at the same time as CTC. This created opportunities for community involvement that were well utilised, and gave a geographical focus to the community. CTC was well known in the community due to concerted efforts to publicise it at a number of different locations and events throughout the area, and through working alongside the community development programme and the Family Centre. The range of programmes that were being run, or overseen, by CTC helped with community engagement. A broad range of people were involved in the Community Board at the beginning of the project and their support continued during the planning stages, but there was less of a role for them once the task groups were set up. Southside did
find it difficult to recruit new community representatives, and there was little
representation from young people. As in the other two demonstration areas, people were concerned that the representation was not broad or extensive.
Funding
One of the critical factors that helped the process of implementation in Southside in the early stages of the programme was access to funding. The CTC co-ordinator was insightful in identifying an early opportunity to build CTC into a number of critical long-term developments that were taking place within the local area. First, the local
secondary school had been active in developing a local Family Centre. CTC built a number of programmes into its Action Plan that would be part of this development. As a result, resources for some of the work were already in place when CTC moved towards implementation. Second, a similar situation arose with the bidding for the first wave of Sure Start17 monies. The CTC planning team was in the process of
constructing their Action Plan when a call for Sure Start bids was made. The CTC co-ordinator took central responsibility for writing the bid document and built CTC
objectives into the plan. As a result, when the bid was successful money was made available for the development of the family-based work in the CTC Action Plan. Having this funding available at the time of implementation made the process much simpler.
But the question of funding was also a reason why some parts of the Action Plan did not get implemented. For example, from the schools’ point of view lack of resources attached to the proposed actions was a problem. The primary schools were happy to consider options being proposed by the Southside CTC project but not if it was going to either cost the school money or require staff to give up time to help develop
funding bids. As a result they did not get engaged in the process.18 Finding funding
was a constant challenge for the CTC co-ordinator. She found herself very much involved in developing funding bids and trying to raise money consistently. One of her regular complaints was that a co-ordinated funding base or infrastructure where a small pot of money was made available to the CTC project would have helped them increase their levels of implementation.
Evidence of change and local impact
Because Southside implemented CTC more successfully than the other areas, we looked at changes that occurred within each cohort separately in order to provide a more detailed explanation (see Figures 5–11). The analysis compared the
The black columns in Figures 5–11 show change in overall risk (all children
responding positively for any risk question, including those at high risk) and the grey columns show change only in those children classified as high risk (more than half the items comprising the risk factor answered positively19). This is because there are
often different patterns evident for the majority of children who may score quite low and the children who are scoring very high, who are a source of most concern. Children responding negatively to all the questionnaire items that comprise a risk factor are considered not at risk and are not shown.
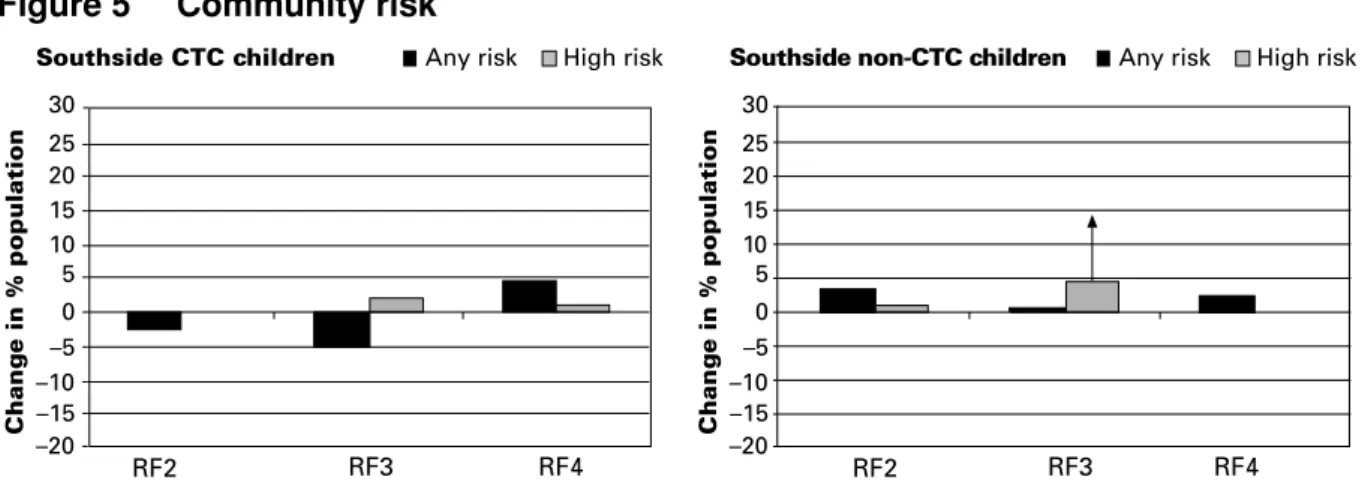
For community-related factors, the CTC children reported less increase in risk generally than the non-CTC children although RF4 (lack of neighbourhood attachment) increased more in the CTC group than in the non-CTC group, but not significantly, and overall, risk went down (remembering that ‘any risk’ includes ‘high risk’). The grey columns showing high risk for availability of drugs (RF3) increased, but not significantly, while for non-CTC children, high risk for availability of drugs increased significantly.
RF1 (disadvantaged neighbourhood) cannot be measured by the use of the school-based self-report data. As discussed previously they require national data gathered from other databases and settings.
Figure 5 Community risk
25 30
RF2 20
15 10 0 –5 –10 –15 –20
Change in % population
Southside CTC children Any risk High risk
5
RF3 RF4
25 30
RF2 20
15 10 0 –5 –10 –15 –20
Change in % population
Southside non-CTC children Any risk High risk
5
Figure 6 Community protection
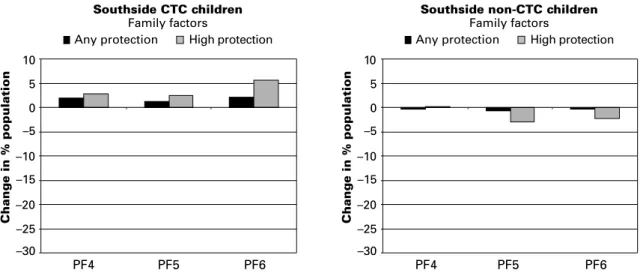
Clearly increases in risk are not desirable, whereas increases in protection are, and
conversely a decrease in protection may indicate increased risk. There were changes in both of the protective factors relating to the community. Opportunities for pro-social involvement in activities and sports in the area (PF1) declined generally amongst the CTC children (–4.3%, n.s.) and in the non-CTC children (–5.3%, p<0.001). Seventeen per cent fewer children attended two or more activities (giving high protection in our terms, p<0.001) in both areas, and this result seemed to indicate a general decline in outside activities for Southside. For protection factor 2, rewards for pro-social involvement, indicating friendly neighbours, protection increased in the CTC group (by 8%, p<0.02) and correspondingly higher protection also increased (4.5%, but not significant). The non-CTC children remained the same.
So for community factors overall, the CTC children generally fared better than the non-CTC children, particularly in relation to improved protection in the community.
Changes were evident in two school risk factors. For risk factor 6, aggressive behaviour in 30 RF6 20 10 0 –10 –20
Change in % population
Southside CTC children Any risk High risk
RF7 RF8 30 RF6 20 10 0 –10 –20
Change in % population
Southside non-CTC children Any risk High risk
RF7 RF8 5 10 PF1 0 –5 –10 –15 –20
Change in % population
Southside CTC children Community factors PF2 –25 –30 High protection Any protection 5 10 PF1 0 –5 –10 –15 –20
Change in % population
Southside non-CTC children Community factors PF2 –25 –30 High protection Any protection
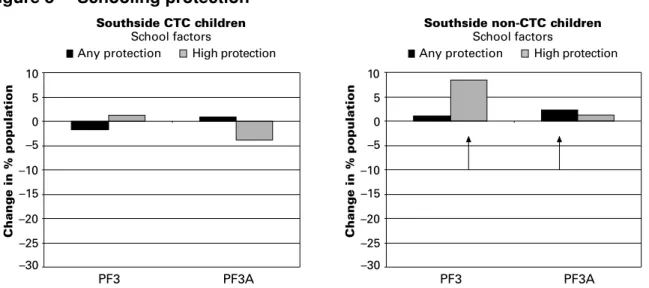
Figure 8 Schooling protection
CTC children: There were no changes in opportunities for pro-social involvement in school (PF3) and for rewards for pro-social involvement (PF3A, which reflects teachers’
involvement and praise). High protection declined for this factor (4%, but not significantly), mainly due to a sharp decline for Year 8 children (14%, p<0.02). Non-CTC children: Where the CTC children showed no change, for opportunities for pro-social involvement in school (PF3), high protection for the non-CTC children increased significantly (8.5%, p<0.001), particularly for Year 9s. In the non-CTC group there was a small but significant overall improvement in any protection for rewards for pro-social involvement (+2%, p<0.02). So for risk and protection factors relating to schooling, the changes were mixed, with the non-CTC children faring better generally than the CTC children.
Figure 9 Family risk
In terms of RF5 (low achievement in schools), no self-report data is available although achievement data is collected nationally. From this data both of the secondary schools in the area improved their scores on numbers of young people getting five or more GCSEs A–C. For example school A went from 28 per cent to 32 per cent. A more dramatic change took place in the primary schools. In total five out of the six local primary schools improved their scores in Key Stage results.20 In two cases the increase took them over the national average
for Wales. One of the schools saw their results move over 20 points between 2000 and 2002.21 Such success cannot be attributed to CTC especially as this is one area in the
project Action Plan that they failed to implement. Such a development is very positive and may well have positive outcomes for children in the Southside area in years to come.
30 RF9 20 10 0 –10 –20
Change in % population
Southside CTC children Any risk High risk
30 20 10 0 –10 –20
Change in % population
Southside non-CTC children Any risk High risk
RF10 RF11 RF12 RF9 RF10 RF11 RF12
5 10 PF3 0 –5 –10 –15 –20
Change in % population
Southside non-CTC children
School factors PF3A –25 –30 High protection Any protection PF3 PF3A 5 10 0 –5 –10 –15 –20
Change in % population
–25 –30
Southside CTC children
School factors
High protection Any protection