Valuing the health benefits of physical activities in the marine environment and their importance for marine spatial planning
Eleni Papathanasopoulou1,*, Mathew P. White2, Caroline Hattam1, Aisling Lannin3, Andrea Harvey1, Anne Spencer4
1
Plymouth Marine Laboratory, Prospect Place, The Hoe, Plymouth PL1 3DH, UK 2
European Centre for Environment & Human Health (ECEHH), University of Exeter Medical School, Knowledge Spa, Royal Cornwall Hospital, Truro TR1 3HD, UK
3
Marine Management Organisation, Evidence, Data and Knowledge Management team, Lancaster House, Hampshire Court, Newcastle upon Tyne, NE4 7YH, UK
4
University of Exeter Medical School, Veysey Building, Salmon Pool Lane, Exeter, United Kingdom, EX2 4SN, UK
*
Corresponding author: email [email protected], Telephone: +44 (0)1752 633425
Abstract
The marine environment provides a number of services which contribute to human well-being including the provision of food, regulation of climate and the provision of settings for cultural gains. To ensure these services continue to be provided, effective management is required and is being strategically implemented through the development of marine spatial plans. These plans require an understanding of the costs and benefits associated with alternative marine uses and how they contribute to human well-being. One benefit which is often difficult to quantify is the health benefit of engaging with the marine environment. To address this, the research develops an approach which can estimate the contribution aquatic physical activities makes to quality adjusted life years (QALYs) in monetary and non-monetary terms. Using data from the Health Survey for England, the research estimates that physical activities undertaken in aquatic environments at a national level provides a total gain of 24,853 QALYs. A conservative estimate of the monetary value of a QALY gain of this magnitude is £176 million. This approach provides estimates of health benefits which can be used in more comprehensive impact assessments, such as cost-benefit analysis to compare alternative marine spatial plans. The paper concludes by discussing future steps.
Keywords: Aquatic activities; ecosystem approach; health benefits; marine spatial planning; metabolic equivalent of task (MET); quality adjusted life year (QALY); valuation; well-being
1 Introduction
1.1 Ecosystem based management
The marine environment provides a number of services which contribute to human well-being (MEA 2005, UKNEA 2011). The provision of fish for food, for example, contributes to well-being by providing basic materials for a good life, while the use of marine settings for recreational activities contributes to well-being through health benefits (MEA 2005).
Managing the marine environment to optimise these well-being benefits requires balancing often competing maritime activities. This is becoming ever more challenging due to
increasing demand for marine resources by different sectors (e.g. shipping, renewable energy, recreation). Historically, the marine environment has been managed on a sector-by-sector, case-by-case basis ignoring the interactions and feedbacks of impacts between industries and uses. The result has been conflict between users and the environment (Ehler et al 2009:19).
The requirement for integrated and joined-up management of the marine environment has been recognised by the international community through, for example, the adoption of the Integrated Maritime Policy for the EU (EC 2007) and the National Policy for the Stewardship of the Ocean, Our Coasts, and the Great Lakes for the USA (The White House 2010). Such policies aim to ensure holistic and integrated management of the seas through ecosystem based management (EBM) which considers sector impacts on the marine ecosystem, the ecosystem services they provide and ultimately on human wellbeing (Douvere 2008).
Marine spatial planning (MSP) is being used as a tool to improve decision making in line with EBM by including within its analysis the impacts of alternative marine uses in time and space along the ecosystem, ecosystem service, human well-being continuum to manage conflicts and compatibilities while meeting ecological, economic and social objectives (UNESCO 2014, Ehler et al 2009, European Parliament 2008, MEA 2005, (Qiu and Jones 2013), Ehler et al 2007, EC 2014).
1.2 Marine Spatial Planning and Cost-Benefit Analysis
Developing marine spatial plans requires a number of steps including: defining and analysing existing conditions as well as future options (Ehler et al 2009). Assessing the economic, social and environmental impacts of current and future options is a key step in informing the management of marine space (European Parliament 2001, 2008; DEFRA 2012) and appropriate decision tools can be used to structure and compare these different information to inform marine spatial plans. In order to inform their Coastal and Marine Spatial Planning (CMSP) objective, NOAA reviewed 171 MSP from around the world
1
The 17 marine and coastal plans reviewed included: Barents Sea (Norway), German EEZ in the North and Baltic Seas, Baltic Sea Action Plan, Wadden Sea Plan, Netherlands, Belgium Part of the North Sea, Shetland Isles, Canada ESSIM, Canada Beaufort Sea IOMP, Massachusetts OMP, Rhode Island SAMP, Maryland Oyster MP, St. Kitts and Nevis, California MLPA, Hawaii ORMP, China MFZ, Australia NMB, Great Barrier Reef MPZP.
focussing on a number of issues including decision support. They noted that a range of tools were used in facilitating decision making including GIS-based tools (such as MarineMap, MARXAN); quantitative time series; quantitative snapshots; qualitative information and expert opinion on issues such as physical, geological, chemical, biological, economic and social impacts (NOAAb 2011). Furthermore, targets and principles were also used to direct decision making.
The recently published East Coast Inshore and Offshore plans for England assessed the current state and future marine plan options’ impacts on issues such as: air and climate; communities and health; cultural heritage; marine ecology; economy; geology and coastal processes; landscape and seascape; and water environment (MMO 2014). The assessments were completed qualitatively recording current and anticipated impacts according to whether they would be positive, negative, neutral, permanent or temporary (MMO 2014:26). However, combining qualitative assessments with quantitative measures can further assist in clarifying the direction and the magnitude of impact and allow comparisons within and across various topic areas to be more explicit (Bertram et al. 2014).
Quantitative comparative analyses of planning options are yet to be formalised in MSP. Currently, the information gathered and analysed are predominately used in consensus building processes which provide qualitative outputs. Cost-benefit analysis (CBA) is one of the approaches that can be used to quantify, in monetary terms, the costs and benefits of alternative marine management decisions and plans enabling comparative analysis of available options to be undertaken. To date, CBAs of marine plan options have not been carried out partially due to: (i) lack of data, (ii) lack of spatial resolution, and (iii) inability to value some market benefits (European Commission 2010). On this latter point, non-market benefits are the benefits gained by humans from ecosystem services but which are not valued directly by the market. An example of a non-market benefit is the health benefit gained by an individual undertaking physical activities in a nature. Quantifying health benefits of engaging with the marine environment is one of the more difficult benefits to quantify (Lloret 2010). Valuing them in a monetary unit would allow these benefits to be more readily used in quantitative comparative impact assessments such as cost-benefit analysis.
1.3 Valuing health benefits
Identifying and quantifying the health benefits of engaging with the environment is a growing research area with the majority of evidence being available for green space. In a review of the impacts of green space to mental health, Bird (2007) concluded it has benefits for behaviour and cognitive development in children, coping with anxiety and stress, crime reduction strategies, treatment of dementia, concentration among office workers, and a general sense of health and well-being. The most recent report from the Monitor of
Engagement with the Natural Environment (Natural England 2015), a survey of participation in the natural environment in England, indicates that individuals, who regularly engage with
the natural environment, report higher overall life satisfaction, feel that their life is more worthwhile, state that they are more happy and show lower levels of anxiety. The presence and ease of access to green space is also reported to encourage beneficial behaviours such as physical exercise, recreation and social interaction (Mytton et al. 2012) and improve happiness (MacKerron and Mourato 2013). Some research has subsequently tried to identify the optimal dose of exercise in the natural environment for improving health and well-being (e.g. Barton and Pretty 2010).
While most research has focused on the well-being and health benefits of engaging with green space, it is also hypothesised that experiencing the marine environment contributes to similar mental and physical health benefits (Corvalan et al. 2005). Evidence is beginning to emerge in support of this. In a systematic review of 36 studies2 exploring the health and well-being benefits of blue space, Völker and Kistemann (2011) identified a number of emotional, restorative and general health benefits associated with blue space. Brereton et al. (2008) found that individuals living closer to the Irish coast reported higher levels of well-being and that this declines beyond 2km. Using cross-section data for England, Wheeler et al. (2012) reported similar findings for self-reported good health and that the effect may be greater for individuals living in more deprived communities. Building on this White et al. (2013) used longitudinal panel data to demonstrate that individuals’ mental health and well-being was significantly better in years when they lived within 5km of the coast compared to years when they lived inland. Engagement with the marine environment is also reported to promote well-being among families (Ashbullby et al. 2013). Consequently initiatives such as the Blue Gym are being promoted to stimulate engagement of the public with the marine environment with a view to improving their health and well-being (Depledge and Bird 2009). 1.4 Quality Adjusted Life Years (QALYs)
The benefits of physical activities to health can be quantified using quality adjusted life year (QALY) which measures the quantity and quality of a person’s life; one QALY “being
equivalent to one life year spent in full health” (NICE 2007:5). The National Institute for Health and Clinical Excellence (NICE) estimates that an extra 30 minutes of moderate exercise per week for a year would provide a 0.0106768 QALY gain for that individual (NICE 2007). These benefits in health could subsequently translate into savings for health-care services if a person is in generally better health. The expanded Walking the Way to Health Initiative (WHI) in the UK, aimed to promote walking as an activity for people who did very little exercise or lived in areas of poor health (Stone 2009). It estimated that the benefits of such a programme, if the programme was able to attract an additional 132,000 walkers over a three year period, would equate to a total gain of 2,871 QALYs (Natural England 2009). The QALYs were estimated to translate into savings that would be realised by the National Health Service (NHS) not having to treat illnesses such as cardio-vascular disease (CHD), stroke and type 2 diabetes which are noted as decreasing in prevalence in more physical
2
active individuals (Warburton et al 2006). Using the annualised life-cost averted by participants costing approach, the report estimated that a total of £81 million would be saved over a period of three years for the 132,000 walkers (Stone 2009)3. The study highlights the potential for significant savings to the health services from individuals undertaking physical activity (PA) on a regular basis and its ability to inform terrestrial planning to support the health aspects of well-being. However, it is not clear to what extent these savings could also be achieved from PA in the marine environment or how it can be used to inform marine spatial planning.
This research therefore develops an approach for assessing how outdoor aquatic physical activities can be measured in terms of health gains in QALYs and its value in monetary terms. It is assumed that an increase in QALY increases a person’s health and well-being based on the literature already noted above. Additionally, some countries, such as Canada, Australia, France and the UK, have well-being programmes which measure a number of contributing factors including levels of health and length of life (OECD 2011). In this research paper, England is used as a case study area and the aquatic activities include both marine and freshwater due to limitations in available data. The methodology developed is
described in the next section including a description of the secondary data sources; this is followed by a section of the results. The paper concludes with a discussion of the approach and its use in marine spatial planning evaluation.
2 Data and methods
2.1Data source for aquatic physical activities
The Health Survey for England (HSE) began in 1991 and has continued to run on an annual basis collecting cross-sectional data for England and its government office regions. It collects information on the public’s health through its core set of questions on general health, psycho-social indicators, smoking, alcohol, use of health services and prescribed medicines, demographic and socio-economic indicators, and measurements of height, weight and blood pressure. Additionally, each year supplementary questions on specific issues are included. The 2012 HSE survey, which was used in this research, had physical activity as its theme with relevant questions including: (i) whether an individual participated in physical activities in the four weeks prior to the date of the interview, (ii) the type of activities undertaken, (iii) the average amount of time spent on each activity each day, and (iv) the frequency of each activity in the last four weeks prior to the date of the interview.
Participants in the 2012 survey totalled 10,333 individuals selected from private households and split into the groups: Infants below the age of 2 (311 participants), Children between the ages of 2 until 15 (1,732 participants) and Adults from the age of 16 and up (8,290
3 In the Woods In and Around Towns (WIAT) project, Ambrose-Oji et al (2014) estimated that with appropriate investment and promotion an additional 487,000 to 507,000 visitors would visit and use the woods benefiting from health improvements valued between £0.75 million and £8.9million per year.
participants). Only the responses from the adults were considered in this research as the QALY measure and associated values are based on preferences of adults. Also, only
identifiable outdoor aquatic activities were considered (e.g. swimming was not included as it was difficult to know whether this physical activity took place in a swimming pool, or
outdoor in a river or sea).
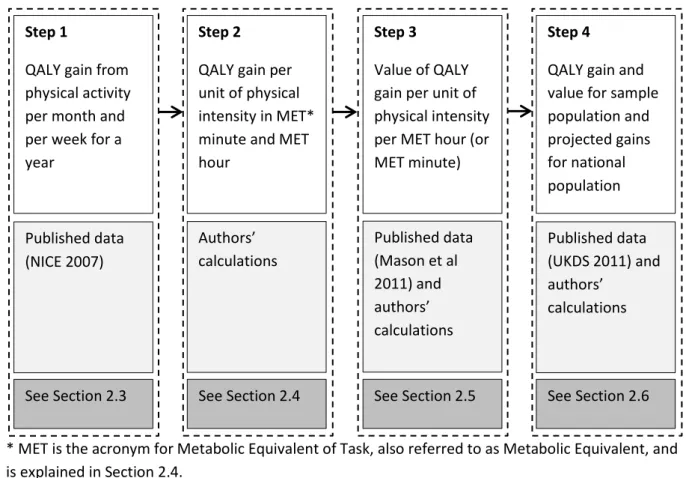
2.2Steps to valuing the health benefits of physical activities in the marine environment The method to value the health benefits of physical activities in the marine environment and which is described in the subsections below, follows a number of interconnected steps. For ease of reference and to provide clarity to the approach, Figure 1 summarises the order of the steps followed, the source of the data, and the Section which provides further detail. Figure 1: Summary of the steps required for calculations
* MET is the acronym for Metabolic Equivalent of Task, also referred to as Metabolic Equivalent, and is explained in Section 2.4.
2.3Measuring QALY gains by engaging in moderate exercise
The contribution of physical activity (PA) to health is estimated by using interval regression where PA is the independent variable and the dependent variable is scaled self-assessed health (SAH) intervals (NICE 2007,Gravelle et al 2003). The contribution coefficient of PA to QALY used in this research was sourced from the NICE 2007 report which used HSE data for its interval regression which wanted to provide “a method for deriving the QALYs associated with increases in physical activity for the general adult population in England” (NICE
Step 1
QALY gain from physical activity per month and per week for a year
Published data (NICE 2007)
See Section 2.3
Step 2
QALY gain per unit of physical intensity in MET* minute and MET hour
Authors’ calculations
See Section 2.4
Step 3
Value of QALY gain per unit of physical intensity per MET hour (or MET minute)
Published data (Mason et al 2011) and authors’ calculations
See Section 2.5
Step 4
QALY gain and value for sample population and projected gains for national population
Published data (UKDS 2011) and authors’
calculations
2007:23). It converted the SAH categorical results of respondents to the question “how is your health in general” given the options of: very good, good, fair, bad and very bad to cardinal values by assigning health index scores and calculating the critical values (or thresholds) that define the intervals (NICE 2007, Gravelle et al 2003, Dolan et al 1995). The PA used in the regression referred to the number of sessions per week, where a session was 30 minutes in duration and the PA was of moderate intensity (see Section 2.4).
The regression estimated that an extra 30 minutes of moderate intensity PA per month for a year contributed to an average increase of 0.0026692 in the mean health index score4. This result was then used to estimate the subsequent long-term Quality Adjusted Life Year (QALY) gain which is the change in the quality and quantity of a person’s life due to some form of intervention, such as physical activity. The NICE report estimated QALY gains by multiplying the average increase in the health index by the additional sessions of PA over a period of time (NICE 2007:26). For example, it estimated that for someone increasing their PA by 30 minutes per week over a period of one year would benefit from a 0.0106768 (or 0.0026692 x 4) QALY gain for that year.
2.4Measuring QALY gains by intensity of physical activity
One of the assumptions made by NICE (2007) in undertaking the interval regression is that the physical activity was of moderate intensity. Physical activities can be presented as ranges of energy intensities using a Metabolic Equivalent of Task (MET) rate which
represents the relative intensity of the PA to the amount of energy expended when resting (i.e. 1 kcal/kg/hour) (Ainsworth et al. 2011). For example, surfing is given a MET rate of 3, which means that the energy expended in undertaking this activity is 3 times as much as someone resting over the same period of time. Moderate intensive PA is considered to cover activities which have an average MET rate of 4. The MET rates of the aquatic activities considered in this research are shown in Table 1.
Table 1: MET rates of aquatic activities (source: Ainsworth et al. 2011) Physical Activity METs
Scuba diving 7.0
Water skiing 6.0
Rowing* 5.8
Kayaking/canoeing 5.4
Wind surfing 5.0
Fishing/angling 3.5
Sailing 3.3
Surfing 3.0
Snorkelling 2.5
4 Mourato et al (2010) estimated a coefficient for PA using an alternative self-assessment questionnaire, the SF-6D measure, and data gathered from their own web survey. The study considered both additional exercise as well as passive forms of engagement with the nature and its health benefits.
*A distinction between the use of a rowing machine and rowing (which was then assumed by the authors to take place in nature) was present in the HSE 2012 database.
The duration of the activity then also becomes important as METs are given on an hourly basis. The total MET minutes or MET hours of an activity for an individual is calculated by multiplying the activity’s MET rate by the duration. If, for example, an individual surfs (MET rate 3) for 120 minutes (min) or 2 hours (hr), they have then completed 3 x 120mins = 360 METmin or 6 METhr of physical activity. The usefulness of considering exercise in the METmin or METhr unit is that it can be used to derive the QALY gain per additional minute or hour of a physical exercise of 1 MET.
To aid clarity in the subsequent analysis, the QALY gain of 0.0106768 (NICE 2007) is converted to a per MET minute (METmin) and MET hour (METhr) QALY gain. Explicitly, as the value of 0.0106768 QALY gain was based on the context that a person does an
additional 30 minute exercise of moderate intensity per week for one year, then:
0.0106768 QALY = weekly activity (30mins x 4 MET) x number of weeks in a year (52) (1) 0.0106768 QALY = 120METmin x 52 = 6,240METmin = 104 METhr (2)
1 METmin = 0.0106768/ 6,240 = 0.00000171102 QALY (3)
1METhr = 0.00000171102 x 60 = 0.00010265386 QALY (4)
These equalities can now be used to estimate the QALY gain of different physical activities for varying durations for each person undertaking an activity in addition to their normal routine. For example, the QALY gain of a person doing an additional 6,240 METmin of exercise per year would be 0.0106768 (0.00000171102*6,240).
2.5Valuing the QALY gain in monetary terms
Quality adjusted life year (QALY) is a measure that can be used to compare the health benefits across alternative interventions such as medical treatment or undertaking physical activity. Valuing them in monetary terms enables them to be used in cost-benefit analysis which includes a wider and more varied range of activities also valued in the common metric of money. The monetary value assigned to a QALY is considered to be the value that society or decision makers are willing to pay to achieve a QALY. The implicit explanation of the value of a QALY is that an “individual’s preferences for health gains from health-care interventions are the same as their preferences for reductions in risk of death…” or in the case of Mason et al (2009) non-fatal injuries (Mason et al 2009:944). The value of the QALY can therefore be considered as the cost an individual would be willing to pay to treat an illness or non-fatal injury and therefore implicitly the cost that would be expected to be spent by the national health-care service to obtain the same benefit.
These monetary values vary depending on the approach used for estimation (Mason et al 2009). Mason et al (2009) valued quality of life enhancement gains through reducing non-fatal conditions with values ranging from £6,414 o £21,519 in 2009 prices. When converted into 2012 prices these equate to £7,120 and £23,886 respectively5. These figures are close to those found by Robinson et al (2013) who sought to elicit values from members of the general population across Europe ($18,247 - $34,097 in 2010, which is equivalent to £11,689 - £21,843)6 . Here we have applied the estimates of Mason et al (2009) converted into 2012 prices due to its quality of life perspective which would be more applicable to health
benefits gained from physical activity. The National Institute for Health and Clinical
Excellence (NICE) has also set an upper limit of willingness to pay for medical interventions of £30,000 per QALY gain. Using the Mason et al values in 2012 prices for (a) low estimate (£7,120); (b) central estimate (£23,886) and the NICE value for (c) high estimate (£30,000), values for one METhr7 can be calculated.
a. Low Estimate (Mason et al. (2009)):
1QALY = £7,120 (5a)
0.0106768 QALY = 104METhr = £7,120 x 0.0106768 = £76.02 (5b)
1METhr = £76.02/104 = £0.73 (5c)
b. Central Estimate (Mason et al (2009)):
1QALY = £23,886 (6a)
0.0106768 QALY = 104METhr = £23,886 x 0.0106768 = £255.03 (6b)
1METhr = £255.03/104 = £2.45 (6c)
c. High Estimate (NICE Upper Threshold)
1QALY = £30,000 (7a)
0.0106768 QALY = 104METhr = £30,000 x 0.0106768 = £320.30 (7b)
1METhr = £255.03/104 = £3.08 (7c)
Based on the QALY values and the calculations above, a two hour session of surfing (120 METmin or 2METhr) would be valued between £1.46 and £6.16. The total annual value can also be estimated by multiplying this figure by the number of METhr for a year.
2.6Sample population valuation and English national projections
5
The conversion from 2009 to 2012 prices used the consumer price index published by the Office for National Statistics and was used to make the figures comparable with the year of HSE data collection (i.e. 2012). 6 The exchange rate was considered to be 1 GBP = 1.561 USD on the 31/12/2010.
7
2.6.1 Sample Population
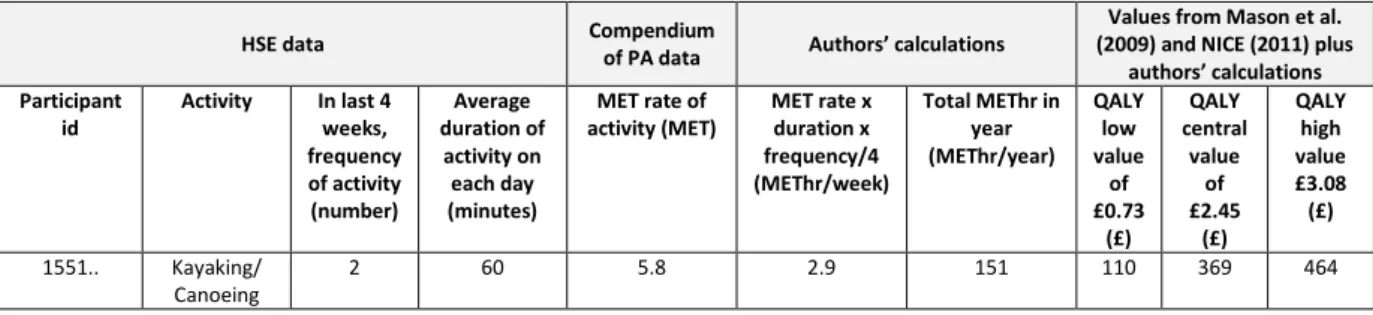
The unit values calculated above are used to estimate each individual person’s QALY gain from participating in an aquatic PA for a year as recorded in the HSE sample population. The data included in the survey includes the aquatic activity, frequency and duration per person over a four week period and which is then assumed to be representative of a person’s PA throughout the year. For example, one of the adult’s in the sample population noted that they had gone kayaking/canoeing twice in 4 weeks prior to the interview and each session lasted an average of 60 minutes. The authors’ scaled-up this activity for a year assuming that the participant continues to kayak/canoe twice a month over a 12 month period. The frequency and duration were then used to convert the PA to MET hours for the year. Once this was calculated the total monetary value is estimated by using the low, central or high values of a QALY.
To illustrate the workings carried out for each individual within the sample population, the following excerpt from the calculations database (Figure 2) is provided for the individual participating in kayaking/canoeing described above. The table also includes information of the source of the data and shown as the top row.
Figure 2: Calculation of the total value of PA for one surveyed individual
HSE data Compendium
of PA data Authors’ calculations
Values from Mason et al. (2009) and NICE (2011) plus
authors’ calculations Participant
id
Activity In last 4 weeks, frequency of activity (number) Average duration of activity on each day (minutes)
MET rate of activity (MET)
MET rate x duration x frequency/4 (METhr/week)
Total METhr in year (METhr/year) QALY low value of £0.73 (£) QALY central value of £2.45 (£) QALY high value £3.08 (£)
1551.. Kayaking/ Canoeing
2 60 5.8 2.9 151 110 369 464
These calculations are carried out for each individual engaging in aquatic sports recorded in the HSE data survey. Individual totals are then summed together for each activity type over the whole sample size to produce total QALY gains and value per physical activity and a grand total for the total sample adult population.
2.6.2 National projections
Using the summary information of the results per activity, i.e. total METhr for all adults participating in a specific activity, e.g. kayaking/canoeing, and assuming these adults are representative of total adults in the English population who kayak/canoe, these QALY gains and values can be used to estimate gains at a national scale. For example, out of the total adult sample population of 8,290 surveyed a total of 15 adults kayak/canoe equating to 0.18% of the total. If it is assumed that this 0.18% is the same percentage of the total English adult population who would kayak/canoe, then out of 43,640,200 adults (ONS 2011) in England, 78,945 would be assumed to go kayaking/canoeing. Multiplying this number of
adults by the average METhr per year for kayaking/canoeing derived from the sample population produces the total projected METhr for the English adult population who kayak/canoe for the year. This total is then also used to estimate the values of the PA using the low, central and high QALY values.
3 Results
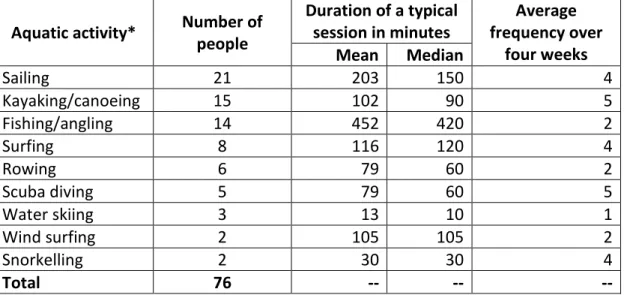
The HSE records the different types of activities the sample population engages in, (e.g. walking, cycling, aerobics, surfing and swimming), their duration and frequency over a four week period prior to the respondent’s survey participation. Of the 8,290 adults (aged 16 and over) surveyed, 4,567 (55%) answered that they had participated in a physical activity in the previous four weeks and of this total, 76 (2%) participated in an outdoor aquatic physical activity (see Table 2). The most popular of the aquatic activities were sailing followed by kayaking/canoeing, fishing/angling and surfing with median duration ranging from 1.5 hours (kayaking) to 7 hours (fishing).
Table 2: Types of outdoor aquatic activities, duration per session and average frequency
Aquatic activity* Number of people
Duration of a typical session in minutes
Average frequency over
four weeks Mean Median
Sailing 21 203 150 4
Kayaking/canoeing 15 102 90 5
Fishing/angling 14 452 420 2
Surfing 8 116 120 4
Rowing 6 79 60 2
Scuba diving 5 79 60 5
Water skiing 3 13 10 1
Wind surfing 2 105 105 2
Snorkelling 2 30 30 4
Total 76 -- -- --
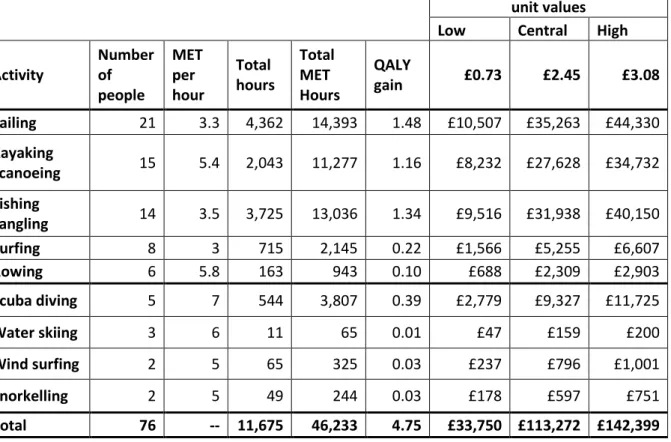
* It was not possible to identify whether these aquatic activities were taking place in freshwater or in the sea though for some activities (e.g. surfing and snorkelling) most, if not all, will be marine based. The activities data is translated into MET hours per year for each of the aquatic PAs based on the sample of people partaking in the activity. For example the total MET hours for a year based on the behaviour of the 21 people sailing is 14,393 METhr (Table 3). These are valued in monetary terms using the METhr values calculated in Section 2.5 (equations 5,6,7). The lower valuation estimates are discussed in the text to provide a conservative evaluation of total benefits and gains due to the large range and uncertainty of QALY values. Therefore, using the lower £/METhr value the total value of PA to the sample of 76 adults is £33,750 for the year. This value represents the benefit the economy would gain in monetary terms due to people staying healthy, active and improving their quality of life; i.e. it is the amount of money that would otherwise need to have been spent in an economy to gain the same
health benefits through the health care system. These can also be measured in terms of the QALY gains using the METhr per QALY results from equation 4. A total of 4.75 QALYs
(46,233x0.00010265386) would be gained amongst the 76 participants based on the mix of activities, duration and frequency of participation for one year. The gains would occur if these 76 adults were assumed to start from a state of inactivity and therefore these activities would be in addition to their normal routine.
Table 3: Health benefits values for aquatic PA based on MET-hour values
Total values based on MET hour unit values
Low Central High Activity
Number of people
MET per hour
Total hours
Total MET Hours
QALY
gain £0.73 £2.45 £3.08 Sailing 21 3.3 4,362 14,393 1.48 £10,507 £35,263 £44,330 Kayaking
/canoeing 15 5.4 2,043 11,277 1.16 £8,232 £27,628 £34,732 Fishing
/angling 14 3.5 3,725 13,036 1.34 £9,516 £31,938 £40,150 Surfing 8 3 715 2,145 0.22 £1,566 £5,255 £6,607 Rowing 6 5.8 163 943 0.10 £688 £2,309 £2,903 Scuba diving 5 7 544 3,807 0.39 £2,779 £9,327 £11,725
Water skiing 3 6 11 65 0.01 £47 £159 £200
Wind surfing 2 5 65 325 0.03 £237 £796 £1,001
Snorkelling 2 5 49 244 0.03 £178 £597 £751
Total 76 -- 11,675 46,233 4.75 £33,750 £113,272 £142,399
If this sample of 76 adults can be considered representative of a portion of the larger English population, the health benefits can be estimated for the national population. The
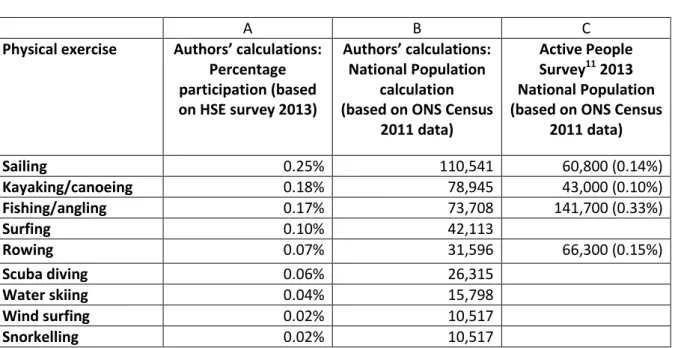
proportion of the 76 adults to the whole adult sample population (i.e. a total of 8,290 who both participate and don’t participate in physical activity) were calculated by activity and are shown in column A of Table 4. As explained above, these percentages are then used to estimate national figures using the total number of adults (from the age of 16 and upwards) in England from the ONS census data for 2011 which is 43,640,200. The totals shown in Table 48 are therefore assumed to be the total number of adults partaking in each of the specific aquatic activities for England (column B). The Active People Survey9 (SportEngland 2012) followed a similar approach and their estimations of the total number of people participating in sport on a national basis is shown in column C. The percentages used in their
8 The results shown have are rounded up. 9
calculations were derived from their own survey and are shown in the parenthesis in column C10.
Table 4: Estimated numbers of adults participating in coastal/marine activities
A B C
Physical exercise Authors’ calculations: Percentage participation (based on HSE survey 2013)
Authors’ calculations: National Population
calculation (based on ONS Census
2011 data)
Active People Survey11 2013 National Population (based on ONS Census
2011 data)
Sailing 0.25% 110,541 60,800 (0.14%)
Kayaking/canoeing 0.18% 78,945 43,000 (0.10%)
Fishing/angling 0.17% 73,708 141,700 (0.33%)
Surfing 0.10% 42,113
Rowing 0.07% 31,596 66,300 (0.15%)
Scuba diving 0.06% 26,315
Water skiing 0.04% 15,798
Wind surfing 0.02% 10,517
Snorkelling 0.02% 10,517
There are clear differences in the estimates derived from the HSE and the Active People Survey such that estimates for sailing and kayaking are higher in the HSE while estimates for fishing and rowing are higher in the Active People Survey. While acknowledging these differences, the HSE estimates are used as they include more aquatic activities. The issue of the reliability of the HSE and the ability to use it to generalise to the whole population is returned to in the discussion section. Consequently, use of the lower monetary QALY value is retained within the calculations to reduce the probability of inadvertently overestimating the total monetary contribution.
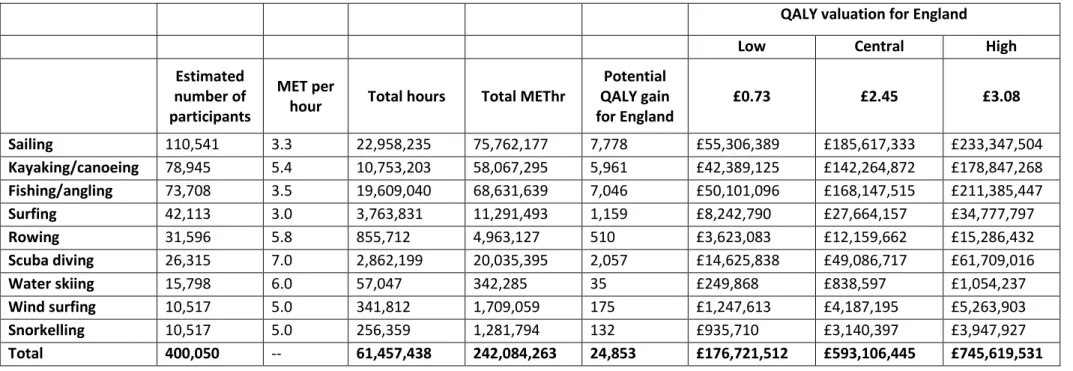
The total number of people at the national level expected to participate in aquatic activities similar to the mix of activity, duration and frequency over a year of the sample population is 400,050 (Table 5). The most popular activity continues to be sailing, followed by
kayaking/canoeing, fishing and surfing with the highest QALY gains amassing to sailing, fishing/angling, kayaking/canoeing and scuba diving. The total QALY gain for the population is estimated to be 24,853 QALYs with an average QALY gain per person of 0.062 for the year. This per person QALY gain will be higher or lower for particular individuals depending on the
10
Other databases such as the British Marine Federation (BMF) yearly Watersports Participation Survey, MMO Angling report (2012) and DEFRA’s Charting Progress report (UKMASS 2007) are also available. However a review of these databases highlighted that differences in data collection methods made direct comparisons difficult.
11 The percentage of adults participating in at least 30 minutes of sport per week were used to extrapolate the results to the whole of England.
type of activity and their overall engagement. In monetary terms, a total of £176,721,512 would be gained by society in terms of money saved through non-occurring health care expenditure.
Table 5: Potential QALY gains and health benefits valuation for water based PA for England (lower estimate)
QALY valuation for England
Low Central High
Estimated number of participants
MET per
hour Total hours Total METhr
Potential QALY gain for England
£0.73 £2.45 £3.08
Sailing 110,541 3.3 22,958,235 75,762,177 7,778 £55,306,389 £185,617,333 £233,347,504 Kayaking/canoeing 78,945 5.4 10,753,203 58,067,295 5,961 £42,389,125 £142,264,872 £178,847,268 Fishing/angling 73,708 3.5 19,609,040 68,631,639 7,046 £50,101,096 £168,147,515 £211,385,447 Surfing 42,113 3.0 3,763,831 11,291,493 1,159 £8,242,790 £27,664,157 £34,777,797 Rowing 31,596 5.8 855,712 4,963,127 510 £3,623,083 £12,159,662 £15,286,432 Scuba diving 26,315 7.0 2,862,199 20,035,395 2,057 £14,625,838 £49,086,717 £61,709,016 Water skiing 15,798 6.0 57,047 342,285 35 £249,868 £838,597 £1,054,237 Wind surfing 10,517 5.0 341,812 1,709,059 175 £1,247,613 £4,187,195 £5,263,903 Snorkelling 10,517 5.0 256,359 1,281,794 132 £935,710 £3,140,397 £3,947,927 Total 400,050 -- 61,457,438 242,084,263 24,853 £176,721,512 £593,106,445 £745,619,531
4 Discussion
4.1 Health gains arising from blue PA and their values
The approach applied here indicates that the UK economy could benefit from approximately £176m in health care savings in one year assuming 400,050 adults participate in a variety of aquatic activities varying in duration and frequency in a year beginning from a state of inactivity. It is also estimated that the quality of life of these adults would increase by a total of 24,853 QALYs. However, these results need to be interpreted with caution due to a number of assumptions and uncertainties.
No substitution effects: the estimated totals assume that any reduction in the level of engagement in aquatic physical activities is not compensated for by other health giving physical activities (e.g. playing football). Substitution between activities would therefore need to be further investigated.
Value of QALY varies: the value of a QALY varies depending on the approach used in its valuation and also what is being valued (Mason et al. 2009). The valuation techniques used to derive the willingness to pay for a QALY includes contingent valuation, standard gamble, time trade-off and the ‘chained’ approach, each incorporating a different element of error (Robinson et al 2013, Buckingham et al 2009). There is also a need to clarify what is being valued, i.e. the prevention of a statistical fatality or quality of life gains (Mason et al. 2009). These technical and definitional differences contribute to the variation and range in the value of QALYs which in turn contribute to the uncertainty attached to the monetary results.
Scaling up the sample population: the sample on which the national estimates have been calculated is based on a subset of marine physical activities carried out by 76 individuals. Scaling up from this small sample could generate an overestimate or
underestimate of true national trends. This could be remedied through the analysis of a larger database of adults who participate in a greater array of aquatic sports and
particularly marine activities. Some larger databases already exist including: the British Marine Federation (BMF) yearly Watersports Participation Survey, the MMO Angling report (2012) and DEFRA’s Charting Progress report (2007). As noted in the Results section however, combining these data sets is difficult due to the different approaches used in their data collection.
Benefits versus costs: gains in QALYs and the savings to economies have been
considered as net benefits from engaging in PA in the marine environment. However, further consideration also needs to be given to possible associated costs of increased physical activities which could include: increases in physical injuries, environmental damage, increase in lifeguard services and safety programmes.
The results of this research can be used to ensure more comprehensive impact assessments, including the CBAs of marine plan options to enable more informed decisions. Health benefits are not typically captured in marine plans quantitatively highlighting a gap which this research helps to fill in relation to recreation by using existing physical activity data and translating them into quantifiable health benefits. It also elucidates how non-market
benefits from engaging with the marine environment can be monetised.
The importance of health benefits in terms of savings to an economy as well as societal benefits could be quite significant if sustainable in the long term. The cost of inactivity both directly (morbidity associated with inactivity) and indirectly (i.e. working days lost from sickness) cost the UK economy and estimated £8.3 billion (Department of Health 2012). If this benefit was to be considered important alongside the need for local economic growth, then ensuring that marine plans include adequate access to the coast as well as improving water quality would be necessary objectives to gain maximum benefit of people engaging with the marine environment through physical exercise.
5 Conclusion
Valuing the non-market health benefits of physical activities in the marine environment is necessary if they are to be included in MSP and management decisions. The approach developed here provides a method for estimating the monetary value of health benefits from aquatic physical activity using the QALY as an organising feature linking the intensity of a physical activity in terms of METS and the value of a QALY. The outputs can be used in the impact assessments and cost-benefit analysis of MSP options. To further refine this method a need exists for larger databases of marine physical activities. This will help reduce the uncertainty around scaling up from sample to national scales. Larger datasets including measures of PA and other relevant demographic and socio-economic questions would also allow exploration into the characteristics, geographical distribution, access and motivation of PA participants. This could further inform local marine plans and management decisions to ensure relevance to local communities. By understanding how the natural environment contributes to the health domain of well-being and its ability to be quantified can also assist in highlighting the importance of well-being as a measure of social progress independent of gross domestic product (CMEPSP 2009). The approach ensures that the health costs to nations due to inactivity, the benefits of reconnecting people with nature, the consideration of redirecting funds towards recreational facilities and ensuring society can easily access and enjoy the natural environment are adequately considered in national, regional and local decisions.
Acknowledgements
This research was funded by the Plymouth Marine Laboratory and University of Exeter Research Collaboration Fund.
References
Ainsworth BE, Haskell WL, Herrmann SD, Meckes N, Bassett Jr DR, Tudor-Locke C, Greer JL, Vezina J, Whitt-Glover MC, Leon AS. The Compendium of Physical Activities Tracking Guide. Healthy
Lifestyles Research Center, College of Nursing & Health Innovation, Arizona State University. Retrieved 11 June 2014 from the World Wide Web.
https://sites.google.com/site/compendiumofphysicalactivities/
Ambrose-Oji, B., Saraev, V., Peace, A., Conolly, T., Stewart, A., Chetcuti, J and Edwards, D., 2014, An Evaluation of the WIAT Challenge Fund: Changing use patterns, the value of recreation and health benefits, and lessons learned. Roslin, Forest Research report to Forestry Commission Scotland. Ashbullby, K. J., S. Pahl, P. Webley, and M. P. White. 2013. The beach as a setting for families’ health promotion: A qualitative study with parents and children living in coastal regions in Southwest England. Health & Place 23:138-147.
Barton, J. and J. Pretty. 2010. What is the best sort of nature and green exercise for improving mental health? A multi-study analysis. Environmental Science and Technology 44:3947-3955. Bird, W. 2007. Natural Thinking. Report prepared for the Royal Society for the Protection of Birds: Investigating the links between the Natural environment, Biodiversity and Mental Health.
Brereton, F., J. P. Clinch, and S. Ferreira. 2008. Happiness, geography and the environment. Ecological Economics 65:386-396.
Buckingham, KJ, Devlin, NJ. 2009. A note on the nature of utility in time and health and implications for cost utility analysis. Social Science & Medicine 68:362-367.
Claxton, K., S. martin, M. Soares, N. Rice, S. E, S. Hinde, and N. Devlin. 2013. Methods for the Estimation of the NICE Cost Effectiveness Threshold.in Y. C. f. H. Economics, editor.
CMEPSP. (2009). Report by the Commission on the Measurement of Economic Performance and Social Progress. Available at www.stiglitz-sen-fitoussi.fr/en/index.htm
Corvalan, C., S. Hales, A. J. McMichael, C. Butler, D. Campell-Lendrum, U. Confaloneieri, K. Leitner, N. Lewis, J. Patz, K. Polson, J. Scheraga, A. Woodward, and M. Younes. 2005. Ecosystems and Human Well-Being: Health Synthesis: A report for the Millennium Ecosystem Assessment. World Health Organisation, Geneva, Switzerland.
Depledge, M. H. and W. J. Bird. 2009. The Blue Gym: health and well-being from our coasts. Marine Pollution Bulletin 58:947-948.
EC 2007. An Integrated Maritime Policy for the European Union. Accessed 11/02/2015. Available from http://eur-lex.europa.eu/legal-content/
Ehler C, Douvere F. Visions for a sea change. Report of the first international workshop on marine spatial planning. Intergovernmental oceanographic commission and man and the biosphere programme. IOC manual and guides no. 48. Paris, UNESCO; 2007.
Ehler, Charles, and Fanny Douvere. Marine Spatial Planning: a step-by-step approach toward ecosystem-based management. Intergovernmental Oceanographic Commission and Man and the Biosphere Programme. IOC Manual and Guides No. 53, ICAM Dossier No. 6. Paris: UNESCO. 2009
(English).
European Commission. 2010. Legal and socio-economic studies in the field of the Integrated Maritime Policy for the European Union: study on the economic effects of Maritime Spatial Planning. Accessed 18/01/15. Available from http://ec.europa.eu/maritimeaffairs/
European Parliament. 2008. Directive 2008/56/EC of the European Parliament and of the Council of 17 June 2008 establishing a framework for community action in the field of marine environmental policy (Marine Strategy Framework Directive).
MacKerron, G. and S. Mourato. 2013. Happiness is greater in natural environments. Global Environmental Change 23:992-1000.
Mason, H., Jones-Lee M., Donaldson C. (2009). Modelling the monetary value of a QALY: a new approach based on UK data. Health Economics; 18(8):933-50.
Millennium Ecosystem Assessment (MEA). 2003. Ecosystems and Human Well-being: A Framework for Assessment. Island Press, Washington DC.
MMO 2012. Sea Angling 2012 - a survey of recreational sea angling activity and economic value in England. Accessed 18/01/15. Available from http://webarchive.nationalarchives.gov.uk/
MMO 2014. Sustainability Appraisal of the East Inshore and East Offshore draft Marine Plans— Sustainability Appraisal Report. Accessed 18/01/15. Available from https://www.gov.uk/
Mourato, S., Atkinson, G., Collins, M., Gibbons, S., MacKerron, G., Resend, G. 2010. Economic assessment of ecosystem related UK cultural services, UK NEA Economic Analysis Report. The Economics Team of the UK National Ecosystem Assessment, London School of Economics, London. MSCC 2014. Economic value and employment in the UK of activities carried out in the marine environment. Accessed 18/01/15. Available from
http://www.scotland.gov.uk/Resource/0046/00466811.pdf
Murphy, M. C. 1999. The simple desire-fulfilment theory. Noûs 33:247-272.
Mytton, O. T., N. Townsend, H. Rutter, and C. Foster. 2012. Green space and physical activity: An observational study using Health Survey for England data. Health & Place 18:1034-1041.
National Institute for Health and Clinical Excellence (NICE) 2007. An economic analysis of environmental interventions that promote physical activity. PDG Report. NICE, London.
Natural England (2009). An estimate of the economic and health value and cost effectiveness of the expanded WHI scheme 2009. Technical Information Note TIN055. Available from
www.naturalengland.org.uk
Natural England. 2013. Wellbeing and the natural environment. Natural England.
Natural England 2015. Wellbeing and the natural environment. Accessed xx. Available from
NICE 2007. An economic analysis of environmental interventions that promote physical activity: PDG Report. NICE, London.
OECD. 2011. OECD Better Life Initiative Compendium of OECD Well-being Indicators. Organisation of Economic Cooperation and Development, Paris.
Prieto, L. and J.A. Sacristán 2003. Problems and solutions in calculating quality-adjusted life years (QALYs). Health and Quality of Life Outcomes, 1:80.
Robinson, A., D. Gyrd-Hansen, P. Bacon, R. Baker, M. Pennington, C. Donaldson, and Q. T. EuroVa. 2013. Estimating a WTP-based value of a QALY: The 'chained' approach. Social Science & Medicine 92:92-104.
Stone. D, J Hanna, S Smith (2009) An estimate of the economic and health value and cost effectiveness of the expanded WHI scheme 2009. Natural England.
The White House. 2010. Executive Order 13547 --Stewardship of the Ocean, Our Coasts, and the Great Lakes. Accessed 11/02/2015. Available from http://www.whitehouse.gov/the-press-office/executive-order-stewardship-ocean-our-coasts-and-great-lakes
UK National Ecosystem Assessment: The UK National Ecosystem Assessment Technical Report.
Cambridge: UNEP-WCMC; 2011.
UKMASS (2010). Charting Progress 2. http://chartingprogress.defra.gov.uk/ (Accessed April 2013). UNESCO 2014. Marine Spatial Planning around the world. Accessed 26/11/14. Available from
http://www.unesco-ioc-marinesp.be/msp_around_the_world
Völker, S. and T. Kistemann. 2011. The impact of blue space on human health and well-being – Salutogenetic health effects of inland surface waters: A review. International Journal of Hygiene and Environmental Health 214:449-460.
Wheeler, B. W., M. White, W. Stahl-Timmins, and M. H. Depledge. 2012. Does living by the coast improve health and wellbeing? Health & Place 18:1198-1201.
White, M. P., I. Alcock, B. W. Wheeler, and M. H. Depledge. 2013. Coastal proximity, health and well-being: Results from a longitudinal panel survey. Health & Place 23:97-103.
Ashbullby, K. J., S. Pahl, P. Webley, and M. P. White. 2013. The beach as a setting for families’ health promotion: A qualitative study with parents and children living in coastal regions in
Southwest England. Health & Place 23:138-147.
Barton, J. and J. Pretty. 2010. What is the best sode of nature and green exercise for improving mental health? A multi-study analysis. Environmental Science and Technology 44:3947-3955. Bertram, C., T. Dworak, S. Görlitz, E. Interwies, and K. Rehdanz. 2014. Cost-benefit analysis in the
context of the EU Marine Strategy Framework Directive: The case of Germany. Marine Policy 43:307-312.
Bird, W. 2007. Natural Thinking. Report prepared for the Royal Society for the Protection of Birds: Investigating the links between the Natural environment, Biodiversity and Mental Health.
Brereton, F., J. P. Clinch, and S. Ferreira. 2008. Happiness, geography and the environment. Ecological Economics 65:386-396.
Corvalan, C., S. Hales, A. J. McMichael, C. Butler, D. Campell-Lendrum, U. Confaloneieri, K. Leitner, N. Lewis, J. Patz, K. Polson, J. Scheraga, A. Woodward, and M. Younes. 2005. Ecosystems and Human Well-Being: Health Synthesis: A report for the Millennium Ecosystem Assessment. World Health Organisation, Geneva, Switzerland.
Depledge, M. H. and W. J. Bird. 2009. The Blue Gym: health and wellbeing from our coasts. Marine Pollution Bulletin 58:947-948.
MacKerron, G. and S. Mourato. 2013. Happiness is greater in natural environments. Global Environmental Change 23:992-1000.
Mytton, O. T., N. Townsend, H. Rutter, and C. Foster. 2012. Green space and physical activity: An observational study using Health Survey for England data. Health & Place 18:1034-1041. Qiu, W. and P. J. S. Jones. 2013. The emerging policy landscape for marine spatial planning in Europe.
Marine Policy 39:182-190.
Völker, S. and T. Kistemann. 2011. The impact of blue space on human health and well-being – Salutogenetic health effects of inland surface waters: A review. International Journal of Hygiene and Environmental Health 214:449-460.
Wheeler, B. W., M. White, W. Stahl-Timmins, and M. H. Depledge. 2012. Does living by the coast improve health and wellbeing? Health & Place 18:1198-1201.
White, M. P., I. Alcock, B. W. Wheeler, and M. H. Depledge. 2013. Coastal proximity, health and well-being: Results from a longitudinal panel survey. Health & Place 23:97-103.