International Journal of Mathematical Archive-9(3), 2018,
47-51Available online throug
ISSN 2229 – 5046International Journal of Mathematical Archive- 9(3), March – 2018 47
CONFERENCE PAPER
National Conference dated 26th Feb. 2018, on “New Trends in Mathematical Modelling” (NTMM - 2018),
Organized by Sri Sarada College for Women, Salem, Tamil Nadu, India.
A STUDY OF AUTISM SPECTRUM DISORDER
USING PRINCIPAL COMPONENT ANALYSIS and FUZZY C-MEANS CLUSTERING
DR. R. UMA RANI
Associate Professor of Computer Science,
Sri Sarada College for Women (Autonomous), Salem-16, India.
R. SUGUNA
Ph. D Research Scholar, Department of Computer Science, Sri Sarada College for Women (Autonomous), Salem-16, India.
MISS. P. AMSINI
Ph. D RESEARCH SCHOLAR, Department of Computer Science, Sri Sarada College for Women (Autonomous), Salem-16, India.
E-mail: [email protected], [email protected] and [email protected].
ABSTRACT
A
dimension means measurement of a certain aspect of an object. Dimensionality reduction is the study of reducing the dimension of a dataset without affecting the original data. Autism is a most sensitive problem for the children and adolescent also. Principal Component Analysis (PCA) is mostly used to do dimensionality reduction in data analysis. After preprocessing, Fuzzy C-means (FCM) algorithm is applied for clustering the data. ASD occurs more often in people who have certain genetic conditions and how genes interact with each other and with environmental factors, such as family medical conditions, parental age and complications during birth or pregnancy. The term “spectrum” refers to the wide range of symptoms, strengths, and levels of abrasion that people with ASD can have. In this paper we have focused on reducing the weak components of the autism spectrum disorder dataset and gene expression in blood of children with autism spectrum disorder (ASD). The study was based on PCA and Fuzzy Clustering.Keywords: PCA (Principal Component Analysis), Autism, dimension reduction, ASD (autism spectrum disorder), fuzzy
clustering, R Studio.
INTRODUCTION
Data Mining is the art of gathering knowledge from large data. Dimensionality reduction is the most effective process to reduce time and space of data. The Data transformation is applied so as to obtain a compressed representation of the original data. If the original data compressed without loss of its structure, then it is called lossless. If we can reconstruct only an approximation of the original data, then the data reduction is called lossy. Compared with the other two techniques of dimensionality reduction such as Discrete Wavelet Transformation, Non-negative Matrix Factorization PCA is most effective and easiest technique. The main aim of PCA in data analysis is to recognize the model to decrease the dimensions of the dataset with minimum loss of data.
1.1 Principal Component Analysis
The data to be reduced consist of tuples or data vectors described by n-attributes. PCA is also called K-L Method. It searches for k n-1 dimensional orthogonal vectors that can best be used to represent the data when k<=n. The original data are projected as much smaller space as the result of dimensionality reduction.
The Basic Procedure of PCA as
• The input data are normalized, here each attribute falls under the same range. This step helps us to ensure attributes with large domains will not dominate the attributes with smaller domains.
• PCA Computes the k-orthogonal vectors, that provides the basis for normalized input data. These are unit vectors;
• The principal components are sorted in the order of decreasing significance or strength. After sorting, the data can be reduced by eliminating the weak components.
Using the strongest principal component, it should be possible to reconstruct the data with good approximation of original data.
PCA is the linear transformation technique and it is computationally inexpensive, can be applied for ordered and unordered attributes, and can handle sparse data and skewed data. Multidimensional data of more than two dimensions can be handled by reducing the problem to two dimensions. Principal Components may be used as to multiple regression and cluster analysis. In comparison with the wavelet transformation, PCA tends to be better at handling sparse data that is summarization of data with many (p) variables with a smaller set of (k) derived variable. It is possible to reduce dimensions of data, when the original values are correlated. If the correlation between variables is weak, then large amount of components in needed to reach the variability. The eigenvalues and eigenvectors are the variance of principal components. Multidimensional PCA is the extension of normal PCA, which is used to handle the three dimensional data. The Mathematical description of PCA is
𝐷′ =𝐷.𝜑
Where,𝐷′ is data matrix of set of transformed data, and it is the result of product of the original data matrix D with 𝜑 which is the eigenvector matrix of covariance matrix of D.
1.2 Autism Spectrum Disorder
Autism was defined by Leo kanner, a psychiatrist at johns Hopkins university, in 1943. Autism spectrum disorder (ASD) is a term for different repetitive behaviors in their daily life. This is occurring from the childhood which is starting from their early childhood, usually in the first 2 years. They need others help every time compulsorily. Their listening capacity and eye contact is inconsistent in daily life. People with ASD may have other difficulties, such as sensitivity with light, noise, textures of clothing, sleeping problems, digestion problems, and bad temper. There are some types of ASD available such as Pica is Eating Disorder and Attention deficit Hyperactive Disorder which is Mental Health Disorder.
More than 10 million children in India suffer from autism, shows the first-ever survey. "We found about 1 to 1.5 per cent autistic children between ages two and nine in India," says Dr N.K. Arora, executive director of the International Clinical Epidemiology Network Trust (INCLEN). And he says that, the leading cause of autism is now being considered genetic: Fragile X Syndrome (FXS). At the root of it is a single gene, Fmr1, which creates a protein crucial for brain cells to 'talk' to each other. While everyone has Fmr1 on sex chromosome X, for some, the gene undergoes abnormal changes, appearing as broken, pinched-in or 'fragile' under a microscope. The Fragile X action means a circuit will not work. Because of this mutation, an autistic brain is different from birth. Fragile X chromosome often passes from one generation to the next with no signs or symptoms. But when it strikes, it affects males more: One in 4,000 boys to one in 6,000 girls. Up to 20 per cent of boys with autism have the condition due to Fragile X.
1.3 Fuzzy Logic
Fuzzy set theory was introduced by Zadeh. it is used to represent the unclear data. Fuzzy sets and fuzzy logic are the most powerful for mathematical modeling. Applications of mathematics of uncertainty and information within the field of computer science have been quite extensive. The motivation for the application of fuzzy set theory to the design of databases and information storage and retrieval systems lies in the need to handle information that is less than ideal in the sense of being incomplete, indeterministic, contradictory, vague, imprecise. The imprecise type of information can handle the expert opnions, judgements and other values are used as a decision in the area such as medical diagnosis, geological and so on.
Cluster is a group of observations that have similar properties and finding the sets of groups, each containing all observations that share a collection of specified properties. Fuzzy Clustering means a data point can have a membership in multiple clusters. Membership is a measure of weirdness of data point of a particular cluster.
2. LITERATURE SURVEY
This section gives the information about the various formations of PCA and autism with the processed work of various authors.
Principal components Analysis was applied to explore the factors which are important in increasing the risk of heart disease. The variables which are used to do the chemical tests of blood as cholesterol, high density lipoprotein, triglyceride, Apoprotein B, Apo Protein A-1,etc., in this system, the data are classified as 4 components in R .Based on the study, the four components have 60.67% of variability ,hence the cholesterol as the main risk factor of heart
disease[4]. PCA along with the SVM were used to do diagnosis of Autism spectrum disorder. In this study 200
The first ever survey of India shows that 10 million children suffer from Autism. India is agriculture country and during the process of agriculture, most of the artificial fertilizers cause many problems to human. Whether the impact on autism may be caused by agriculture or not was surveyed in this study [2]. PCA is effective in dimensionality reduction and also in data balancing. Imbalanced data is very important in all the applications of the real world, and the classification accuracy is based on minority class can get a higher priority than the majority class. This problem occurs in the dataset when the distribution of data between classes. Due to the large amount of data, the imbalances occur in data. Hence, PCA helps to do data balancing with the technique of SMOTE.
Multidimensional PCA, Which is the porch of PCA, is used to evaluate the multi-dimensional data. The Functional Independence Measure (FIM) is a score to maintain data for multidimension. The SVD (Singular Vector Decomposition) is generally working by the reason of its numerical constancy. In case of Multi dimensional PCA, Higher order SVD (HOSVD), which is orthogonal decomposition technique of matrix. It is most effective than normal Principal Components Analysis.
Fuzzy logic can apply in computer science for handling various data from different kind of applications as medical, business and so on. The medical image data such as ECG, EEG, MRI and CT-Scan are taken for processing. PCA used for preprocessing and classification applied on the image, then neural network, fuzzy logic applied for classify and segmenting the images of tumor affected brain[7]. Fuzzy cognitive map was used to support in early identification of autism among children and optimize treatment with the approaches to classify and categorize the children based on their learning skill and facial expressions [8].Fuzzy approaches place an important position in data mining. The fuzzy cluster analysis is unsupervised process. Precision and high performances are important goals of fuzzy sets, the most successful fuzzy applications in industry such as intelligent control and pattern classification .The introduction of fuzzy sets was motivated by the need for more human friendly computerized devices, which help to user to handle the information in an easiest way [10].
3. IMPLEMENTATION
Principal component analysis is a method of extracting important variables from a large set of variables available in a data set. It extracts low dimensional set of features from a high dimensional data set to capture as much information as possible. PCA is more useful when dealing with higher dimensional data. It is always performed on a symmetric correlation and it handles the matrix of numeric data. The aim of PCA is to identify the correlation between variables. If a good correlation is available, it means, it moves to reduce the dimensions on a dataset.
3.1 Data Collection
The data has been taken from the National Database for Autism Research. It is consist of CBC (Complete Blood Count) Values for the 100 samples of children with the features as heart, whole blood, whole brain, kidney, hyphothalomus, retina, pituitary, spinal cord.
3.2 Data Preprocessing
Data Preprocessing is the form of data understanding. It includes data cleaning which involves the correction of data quality, managing missing values and removing outliers’. Data transformation includes normalizing the data and creating new features from the available data. Reduction of data includes the selection of attributes and reduces the features.PCA was applied on the dataset then the reduced format of data used for Clustering. The Preprocessing steps are,
Data Collection
Data Preprocessing
Fuzzy C-Means Clustering
Result
Figure-1: Basic Procedure for Proposed
• Read the autism dataset.
• Applied PCA:
a. The Data transformation such as scaling, centralized and rotation where applied on the dataset.
b. Calculated the covariance matrix
The Covariance Matrix is calculated as the measure for two variables which vary together.
𝐶𝑜𝑣�𝑥𝑖,𝑥𝑗�=�(xki−x�ı)(xkj−x�� 𝑛
𝑘=1
)
Where xki, xkj are the values of ith and jth feature vector for kth object.
c. From the covariance matrix, determine the eigen values and eigen vectors.
Eigen Vector matrix is the reduced data of features. PCA gives principal components that maximize the variance of data.
3.3 Fuzzy C-Means Clustering
Fuzzy C-Means Clustering contains two processes. 1. Calculation of the cluster centers
2. Assignment of points to these centers using a form of Euclidean Distance.
This process is repeated until the cluster centers have stabilized. Fuzzy C-Means imposes a direct constraint on the fuzzy membership function associated with each point as,
�μj
𝑛
𝑗=1
xi=1; i = 1,2,3 … , k
Where p is number of specified cluster
K is number of data points, xi is the i-th data point, µj is the function that returns the membership of xi in the j-th cluster. for calculating new cluster center value is,
∑([𝜇𝑗(𝑥𝑖)]𝑚𝑥𝑖 ∑([𝜇𝑗(𝑥𝑖)]𝑚𝑥𝑖=𝑐𝑗 Where cj is center of jth cluster, m is fuzzification parameter.
3.4 Result
The Experimentation was done in R Studio and Matlab. Preprocessing with PCA gives the result as reduced form of data.
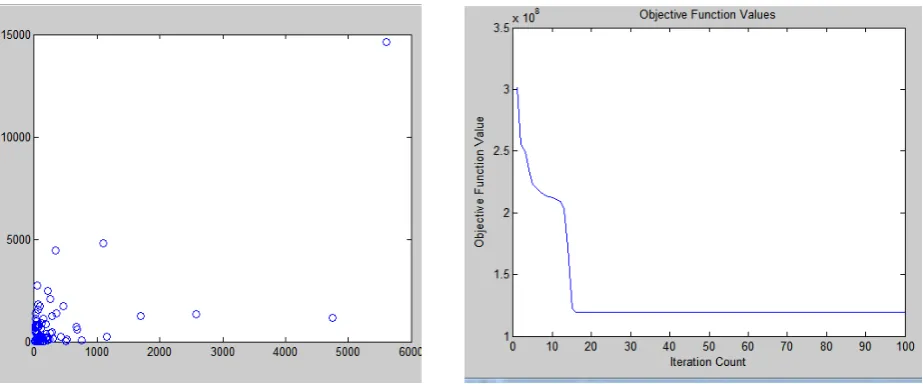
Figure-2: Variance of Features Figure-3: Variance between pc1 and pc2
Importance of components:
Heart Pc1
Whole Brain
Pc2
Whole Blood Pc3
Hyphothalamous Pc4
Kidney Pc5
Pituitary Pc6
Spinalcord Pc7
Uterus Pc8
Retina Pc9
Prostate Pc10
UterusCorpus Pc11
Standard
deviation 2.81 1.08 0.78 0.62 0.55 0.45 0.45 0.31 0.24 0.18 0.15
Proportion
of Variance 0.72 0.82 0.56 0.63 0.27 0.87 0.01 0.09 0.05 0.03 0.02
Cumulative
The figure.3 explained the variance of each feature of the autism dataset, and figure.4 displays the variance between the first two principal components with almost 82% of the variance. The table shows that the statistical analysis of the autism data attributes. Based on the fuzzy clustering, two clusters have partitioned from the autism data. The iterations for the process
Figure 4: output of Fuzzy Clustering
CONCLUSION
In data analysis, PCA is used for studying one table of observations and variables with the idea of transforming the variables into a set of new variables. PCA is used to reduce a complex data set to a lower dimension in order to reveal the structures. Fuzzy Clustering is helpful to cluster the data with the membership values. In future we can use more features of this autism dataset as facial expressions and learning skills of children and can apply other algorithms on it and it will recover ASD and we may apply other mathematical models with data mining in this dataset which will be helpful to the ASD children.
BIBLIOGRAPHY
1. Arun K. Pujari, "Data mining techniques”, 2001.
2. Dr.C.Yamini,M.Premasundari, “A Review on Classification Techniques with Autism Spectrum Disorder and
agriculture”, International journal of Advanced research in computer science, vol 8,no-7, pg:698-700.
3. NadirMustafa, Jian-Ping li, Raheel, Mohammed,” A Classification Model for Imbalance Medical data based
on PCA and farther distamce based synthetic minority oversampling technique”, International Journal of Advanced computer science and application, vol:8, No.1,2017.
4. Sebastian Raschka, Ph.D Candidate if Michigan state University, Blog “Principal Component Analysis in
Python”.
5. Sam Rowels, “EM Algorithms for PCA and SPCA”
6. Naeem Ahmed Qureshi, velo Suthar, “Application of Principal Component Analysis to medical Data”, Indian
Journal of Science and Technology, vol: 10(20), may 2017.
7. Saranya.S,Rajeswari.R “Diagnosis of Autism Spectrum Disorder (ASD) us in principal component Analysis”
International Journal of Advanced research in basic Engineering Sciences and Technology,vol:2, Special Issue:19, oct 2016.
8. Hota H.S,ShuklaS.P,Gulhare Kajal Kiran, “Review of Intelligent Techniques Applied for Classification and
Preprocessing of Medical Image Data”, IJCSI, ISSN:1694-0814.
9. M.S.Mythilli,A.R.Mohammed Shanavas, “An improved Autism Predive Mechanism among children using
fuzzy cognitive map and feature extraction methods”, ARPN journal of engineering and applied science,ISSN:1819-6608.
10. G.Leory,A.Irmscher and M.H.Charlop-christy, “Datamining Techniques to study therapy success with autistic
children”,2006 International conference on datamining,26-29, june 2006,monte carlo resort, as vegas, USA.
11. Rudolf Kruse,Detlef Nauck and Christian Borgelt, ”Data Mining with Fuzzy mrthods: status and prospective”.
12. Autism Speaks 100 days toolkit,http://www.cdc.gov/ncbddd/autism.
13. Centers for Disease Control and Preventionhttp://www.cdc.gov/ncbddd/autism Eunice Kennedy Shriver
National Institute.