European Journal of Physical Education and Sport Science
ISSN: 2501 - 1235 ISSN-L: 2501 - 1235 Available on-line at: www.oapub.org/edu
doi: 10.5281/zenodo.1292510 Volume 4 │ Issue 8 │ 2018
COMPARISON OF PHYSICAL ACTIVITY LEVELS OF
MIDDLE SCHOOL AND HIGH SCHOOL STUDENTS
iAli Coşkun1ii,
M. Kamil Özer2
1Canakkale Eighteen March University, Bayramiç Vocational School, Turkey 2Istanbul Gedik University Faculty of Sport Sciences, Turkey
Abstract:
The aim of this study is to compare the physical activity levels of middle school and high school students in Çanakkale province. The study included 426 female and 417 male students aged 10-17 years who voluntarily participated. The PAQ survey developed by Kowalski et al. was used to determine physical activity levels of students participating in the study. The responses of students to the survey questions had mean and standard deviation calculated and the T test used for analysis with SPSS. For middle school students, the mean age of female students was 12.16±1.23 and the mean age of male students was 12.23±1.24 years. For high school, the mean age of female students was 16.31±1.17 and the mean age of male students was 16.32±1.29 years. In terms of BMI, the value for female middle school students was 18.95±3.13 and for male middle school students was 19.18±3.78, while for female high school students it was 20.92±3.31 and for male high school students it was 22.21±5.36. The physical activity scores for female and male middle school students were 2.71±0.79 and 2.93±0.77, respectively. The physical activity scores for female and male high school students were 1.88±0.61 and 2.36±0.73, respectively. For middle school students the physical activity scores were found to be high for both genders compared to high school students. Physical activity scores for female students were lower compared to males in both school types.
Keywords: physical activity; movement, middle school and high school students
1. Introduction
Obesity is an energy metabolism disorder occurring due to excessive fat deposition on the body that may cause physical and mental problems (Gürel and İnan 2001; Zitsman et al., 2014). Obesity beginning in the childhood and adolescent periods may cause respiratory, cardiovascular, hormonal, orthopedic and psychiatric disorders in the adult period so early diagnosis and treatment approaches are important (Han et al., 2010). The MONICA study by the World Health Organization in 6 different regions of Asia, Africa and Europe lasting 12 years reported a 10-30% increase in the obesity prevalence over 10 years. While the obesity rate globally was 400 million in 2008, the overweight rate was 1.4 billion. These rates were determined as 700 million obese and 2.3 billion overweight in 2015 (WHO 2015).
Childhood obesity has increasing disease rates, especially in developed countries, but also throughout the world. Those who are obese in the childhood period have increased rates of disease and death in adulthood, while 50% of those who are obese entering the adolescent period are obese in adulthood. This forms a significant health problem as the majority of the time both families and clinicians do not see it as a disease requiring treatment (Gürel and İnan, 2001). The American Collage of Sport Medicine (ACSM) recommends a mean of 30 minutes exercise every day. This level of activity represents 840 kJ (200 kCal) energy consumption. According to the ACSM, the aim should be to have daily physical activity with at least 60 minutes moderate exercise (ACSM 2009). Research has shown that individuals with high activity and physical fitness have lower risk of diseases like high blood pressure, type 2 diabetes, cardiovascular problems and colon cancer, compared to their inactive peers (Culos-Reed, 2002).
Physical activity is defined as bodily motions produced by contraction of the skeletal muscles requiring energy consumption above basal levels (Özer, 2016). Protecting individual health, and as a result social health, with fun, low cost and high yield gains like physical activity habits may be used as an effective tool to reduce health spending with increasing costs and forming a high share of national budgets (Sayın, 2014). Scientific research has found physical activity is associated with up to 22% reduction in all causes of death. It is reported that physically active individuals have life expectancy lengthened by 1.5-2 years (İşleğen, 2009). Thus, it is considered that spending for health will be less (Katzmarzyk et al., 2000).
highest participation was cycling, with football in second place and activities like skipping, tag and chasing in third place. Physical activity tools like skates, skateboards and scooters were not commonly used, with the most common daily cycling at 43% and the most common occasional activity identified as swimming (Şahin et al., 2011).
The aim of this study is to compare the physical activity levels of middle school and high school students.
2. Methodology
The study included volunteers of 426 female and 417 male students aged from 10-17 years. The PAQ survey developed by Kowalski et al. was used to determine physical activity levels of students participating in the study. The responses of students to the survey questions were analyzed with mean and standard deviation calculated and the T test used with the SPSS program.
3. Results
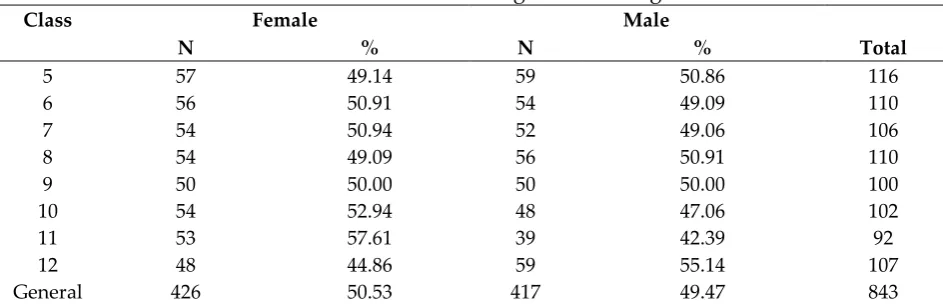
Table 1: Distribution according to class and gender
Class Female Male
Total
N % N %
5 57 49.14 59 50.86 116
6 56 50.91 54 49.09 110
7 54 50.94 52 49.06 106
8 54 49.09 56 50.91 110
9 50 50.00 50 50.00 100
10 54 52.94 48 47.06 102
11 53 57.61 39 42.39 92
12 48 44.86 59 55.14 107
General 426 50.53 417 49.47 843
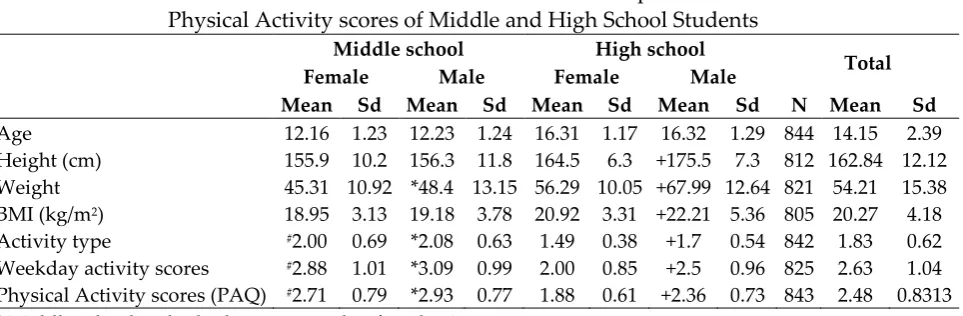
Table 2: Mean and Standard Deviation of Anthropometric and Physical Activity scores of Middle and High School Students
Middle school High school
Total
Female Male Female Male
Mean Sd Mean Sd Mean Sd Mean Sd N Mean Sd
Age 12.16 1.23 12.23 1.24 16.31 1.17 16.32 1.29 844 14.15 2.39 Height (cm) 155.9 10.2 156.3 11.8 164.5 6.3 +175.5 7.3 812 162.84 12.12 Weight 45.31 10.92 *48.4 13.15 56.29 10.05 +67.99 12.64 821 54.21 15.38 BMI (kg/m2) 18.95 3.13 19.18 3.78 20.92 3.31 +22.21 5.36 805 20.27 4.18 Activity type #2.00 0.69 *2.08 0.63 1.49 0.38 +1.7 0.54 842 1.83 0.62 Weekday activity scores #2.88 1.01 *3.09 0.99 2.00 0.85 +2.5 0.96 825 2.63 1.04 Physical Activity scores (PAQ) #2.71 0.79 *2.93 0.77 1.88 0.61 +2.36 0.73 843 2.48 0.8313 * Middle school males higher compared to females (p<0.05).
+ High school males higher compared to females (p<0.05).
# Middle school females and males higher compared to high school females and males (p<0.05).
Table 3: Distribution of Body Mass Index according to Category
BMI Female Male Total
Category F % F % F %
Underweight 7 1.7 10 2.5 17 2.1
Healthy 216 53.6 186 46.4 402 50.0
Overweight 114 28.3 116 28.9 230 28.6
Obese 66 16.4 89 22.2 155 19.3
Total 403 100.0 401 100 804 100.0
When students are assessed in terms of body mass index, for girls, 1.7% were underweight, 53.6% were healthy, 28.3% were overweight and 16.4% were obese. Among boys, 2.5% were underweight, 46.4% were healthy, 28.9% were overweight and 22.2% were obese.
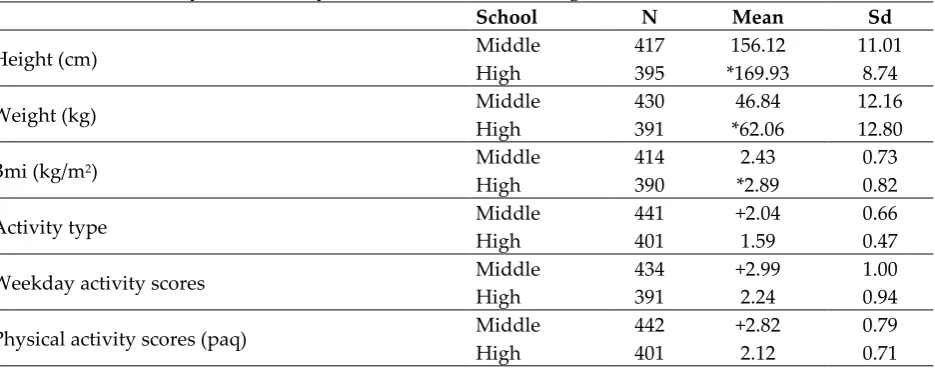
Table 4: Mean and Standard deviation Values for Anthropometric and Physical Activity scores of Middle and High School Students
School N Mean Sd
Height (cm) Middle 417 156.12 11.01
High 395 *169.93 8.74
Weight (kg) Middle 430 46.84 12.16
High 391 *62.06 12.80
Bmi (kg/m2) Middle 414 2.43 0.73
High 390 *2.89 0.82
Activity type Middle 441 +2.04 0.66
High 401 1.59 0.47
Weekday activity scores Middle 434 +2.99 1.00
High 391 2.24 0.94
Physical activity scores (paq) Middle 442 +2.82 0.79
High 401 2.12 0.71
* High school students higher for height, weight and BMI (p<0.05).
+ Middle school students higher in terms of activity variety, weekday activity scores and total physical activity scores
4. Discussion
In our study, significant differences were found between middle school and high school students in terms of height and BMI (p<0.05). Students attending high school had high mean height and BMI compared to middle school students. There were significant differences between middle school and high school students in terms of activity variety, weekday activity scores and total physical activity scores (p<0.05), with students attending middle school having higher scores compared to students attending high school.
Of those attending middle school, there were significant differences between male and female students in terms of weight, activity type, weekday activity scores and physical activity scores (p<0.05). Male middle school students were heavier than female students, participated in more varied activities, were more active on weekdays and had higher physical activity levels.
There were significant differences between male and female students attending high school in terms of height, weight, BMI, activity type, weekday activity scores and physical activity scores (p<0.05). Male high school students were taller and heavier than female students with higher BMI, participated in more varied activities, were more active on weekdays and had higher physical activity levels.
There were significant differences between female and male middle school students and female and male high school students in terms of activity type, weekday activity scores and physical activity scores (p<0.05). Middle school students participated in more varied activities, were more active on weekdays and had higher general physical activity levels compared to high school students.
for males (31.1%) (Burke et al., 2005). Additionally, it was recommended that for children to obtain health-related benefits, they should have moderate or high levels of physical activity for 60 minutes most days each week. The appearance of physically active children is different to their peers (Grissom, 2005:11-25).
Our research findings appear to be in parallel with the literature.
5. Conclusion
The results of this study found that middle school students have higher physical activity levels, weekday activity scores and physical activity scores compared to high school students.
References
1. ACSM. (2009). ACSM’s Guidelines for Exercise Testing and Prescription. Edited by
Franklin BA, Whaley MH, Howley ET. Philadelphia.
2. Beighle, A., Erwin, H., Morgan, C. F., & Alderman, B. (2012). Children's in school
and out-of-school physical activity during two seasons. Research quarterly for
exercise and sport, 81(1), 103-107.
3. Burke S. M., Carron A. V., Eys M. A. Physical activity context and university student’s propensity to meet the guidelines Centers for Disease Control and Prevention/American College of Sports Medicine. Med Sci Monit. 2005;11:CR171-176.
4. Culos-Reed, & Nicole. S. (2002). Physical activity and cancer in youth: a review of
physical activity’s protective and rehabilitative functions. Pediatr Exerc
Science(14), 248-258.
5. Dükkancı, Y. (2008). Çocuklarda fiziksel aktivite ve sağlıkla ilişkili fiziksel
uygunluk özelliklerinin değerlendirilmesi. Muğla Üniversitesi Yuksek Lisans Tezi.
6. Francis, K. T. (1991), Status Of The Year 2000 Health Goals For Physical Activity
Fitness, Phys Ther. 79(4):405-14.
7. Grıssom, J. B. (2005), Physical Fitness and Academic Achievement, Journal of
Exercise Physiology.8(1),11-25.
8. Gürel S, İnan G. (2001) Çocukluk çağı obezitesi tanı yöntemleri, prevalansı ve etyolojisi. ADU Tıp Fakültesi Dergisi; 2(3):39-46.
9. Han, J. C., Lawlor, D. A., & Kimm, S. Y. (2010). Childhood obesity. The
Lancet, 375(9727), 1737-1748.
10.İşleğen, Ç. (2009). Fiziksel Aktiviteyle Yaşam Süresinin Uzatılması. Türkiye
Klinikleri Journal of Medical Sciences, 29(5), 80-83.
11.Katzmarzyk P. T., Gledhill, N., & Shephard, R. J. (2000). The Economic Burden of
Physical Inactivity in Canada. Canadian Medical Association, 163(11), 1435-1440.
12.Kowalski, K. C. (2018, 3 6). The physical activity questionnaire for older children
https://www.academia.edu/27632739/The_Physical_Activity_Questionnaire_for_
Older_Children_PAQ-C_and_Adolescents_PAQ-A_Manual?auto=downloaded.
13.Kudaş, S., Ülkar, B., & Erdoğan, A. (2005). Ankara İli 11-12 Yaş Grubu
Çocuklarin Fiziksel Aktivite Ve Bazi Beslenme Alişkanliklari. Spor Bilimleri
Dergisi, 19-29.
14.Özer, M. K. (2016) Fiziksel Uygunluk. (Gözden geçirilmiş 6. Basım) Nobel
Akademik Yayıncılık, Ankara
15.Pangrazi, R. P., Corbın, C. B. (1990), Age as a Factor Relating to Physical Fitness
Test Performance, RQES. 61(4):410-414.
16.Pangrazi, R. P., Corbın, C. B., Welk, G. J. (1996), Physical Activity For Children
And Youth, JOPERD.67(4): 38-43.
17.Pate R. R., Pratt M., Blair S. N., et al. Physical activity and public health. A recommendation from the Centers for Disease Control and Prevention and the American College of Sports Medicine. JAMA. 1995;273:402-407
18.Sayın, N. (2014). 15-17 yaş grubu gençlerin fiziksel aktivite düzeyleri ile fiziksel
uygunlukları arasındaki ilişki. Ankara: Yüksek Lisans Tezi, Selçuk Üniversitesi
Sağlık Bilimleri Enstitüsü.
19.Shi Z., Lien N., Kumar B. N., et al. Physical activity and associated socio-demographic factors among school adolescents in Jiangsu Province, China. Prev Med. 2006;43:218-221.
20.Şahin, G., Uğurlu, E., Özer, M. K., & Özgider, C. (2011). Okul Çocuklarımız Ne
Kadar Aktif? Uluslararası Spor Araştırmaları Dergisi, 3(2).
21.WHO. (2003). Diet, Nutrition and the Prevention of Chronic Diseases. Technical Report Series, 13-29.
22.WHO. (2015, 4 8). Obesity and Overweight. WHO: Received from;
http://www.who.int/mediacentre/factsheets/fs311/en/
23.Zitsman J. L., Inge T. H., Reichard K. W., et al. (2014). Pediatric and adolescent
Creative Commons licensing terms