ADSORPTION STUDIES OF ZINC(II) IONS ON BIOPOLYMER
COMPOSITE BEADS OF ALGINATE-FLY ASH
Uzma Nadeem
[a]and Monika Datta
[a]*Keywords: biopolymer beads; sodium alginate; adsorption; isotherm models; wastewater
The gelling and metal-chelating properties of alginate were combined to develop an adsorbent for heavy metal removal. Biopolymer beads composed of fly ash and sodium alginate proved to be an effective adsorbent for removal of Zn(II) ions from aqueous solutions. The effect of initial pH (2–10), bead dose (10–80), agitation time (1–24 h), beads composition (0.1g–0.7 g fly ash) and Zn(II) ions initial concentration (5–30 mg L-1) on the adsorption process, as well as to what extent the adsorption data obey Langmuir and Freundlich adsorption isotherms
were investigated. The maximum adsorption was found 84.20 % within 8 h and after that reaches equilibrium. The adsorption of Zn(II) ions is quite sensitive to pH of the suspension and shows an optimum uptake value at pH 6.0. Maximum adsorption occurred for 40 beads and in case of composition, beads composed of 0.5 g fly ash has shown good results. It is clear from the experimental results that the pH plays an important role in adsorption of zinc ions. The average size, bulk density and swelling ratio of beads calculated are; 0.12 cm, 0.34 g mL-1
and 28.65 respectively. The synthesized beads were also characterized by FTIR, XRD, SEM, TGA/DTA and other methods.
*Corresponding Authors
E-Mail: [email protected]
[a] Department of Chemistry, University of Delhi, Delhi, 110007, India.
[a] E-Mail: [email protected]
Department of Chemistry, University of Delhi, Delhi, 110007, India.
Introduction
Environmental pollution by heavy metals which are
released into the environment through various
anthropogenic activities such as mining, energy and fuel
production1, electroplating, wastewater sludge treatment and
agriculture are one of the world’s major environmental
problems. This is probably due to rapid industrialization2, 3,
population growth and complete disregard for the environmental health. Initially, heavy metals are naturally present in soils as natural components but as of now, the presence of heavy metals in the environment has accelerated due to human activities. Even though zinc is an essential
requirement for a healthy body4, excess zinc can be harmful,
and cause zinc toxicity.5-8 The free zinc ions in solution is
highly toxic to plants, invertebrates, and even vertebrate fish. Stomach acid contains hydrochloric acid, in which metallic zinc dissolves readily to give corrosive zinc chloride, which can cause damage to the stomach lining due to the high solubility of the zinc ion in the acidic stomach.
Fly ash is a significant waste that is released of thermal power plants and defined as very fine particles that are drifted upward with up taken by the flue gases due to the
burning of used coal.9 Fly ash, a finely divided and
powdered by-product, from coal fired power plants or biomass combustion facilities requires ultimate disposal. Studies on the country and the world of fly ash usage has increased in the last two decades and as a result of these studies have been identified fly ash as a suitable adsorbent
for the adsorption of heavy metals from waste water.10 The
major constituents of fly ash are silica, alumina, and iron
oxide, which are ideal metal adsorbents. In recent years, fly ash has been employed as a low-cost adsorbent for gas and
water cleaning11 and much effort have been focused on
heavy metal and dye adsorption on fly ash particles.12
Recently numerous approaches have been studied for the development of cheaper and more effective adsorbents containing natural polymers. The use of naturally occurring biopolymer seems to be a preferred alternative to the use of expensive chemical adsorbents for the removal of heavy metal ions. Adsorption onto polysaccharide derivatives can be a low-cost procedure of choice in water decontamination.
Among the industrially attractive polysaccharide
biopolymers, alginate is known to have high complex
formation ability with various heavy metals.13
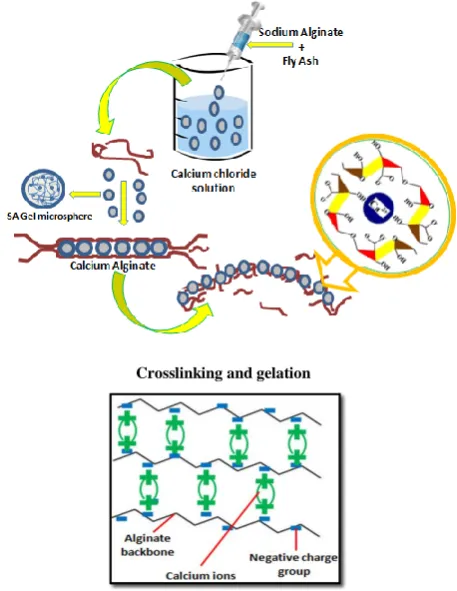
Sodium alginate was chosen as the material for preparation of the carrier matrix because it is a natural, biodegradable, biocompatible, non toxic orally and hydrophilic polymer suitable for the entrapment of water soluble toxicants. They produce thermally irreversible gels by association with most divalent cations. Alginates are polysaccharides found in brown seaweeds and are composed mainly of linear polymers of β-(1→4)-D-mannuronic (M) and α-L-guluronic (G) acids differing in terms of their proportions and linear arrangements. Different species of algae contain different percentages of mannuronic acid (M) and guluronic acid (G). Because of the differences in conformation of the two different residues, gellation with divalent cations can be attributed mainly to the G residue (especially to the pure polyguluronic (GG) chains), while the M residue contributes mainly to the cation exchange capacity of this naturally occurring polymer. Hydroxyl groups have been found to play an important role not only in cation exchange capacity but also in the affinity of the
material towards different metal ions.14
The mechanisms of biosorption are not fully understood, but it is well known that alginates of algal cell walls play an
In the present work the gelling and metal-chelating properties of alginate were combined with fly ash to develop composite adsorbents for heavy metal removal.
Experimental
Reagents
Sodium alginate was obtained from Thomas Baker Pvt. Limited. The fly ash obtained from National Thermal Power Corporation was grounded and sieved to a particle size of 200–400 micron. The sieved fly ash was washed 2-3 times by distilled water to remove the impurities and preserved in
glass bottles. Analytical grade of ZnSO4.7H2O was used for
metal sorption experiments. The stock solution was diluted by serial dilution method as per requirement. The initial pH of the solution was adjusted by using either 0.1 M NaOH or 0.1 M HCl. All the chemicals used for the study were of analytical grade.
Beads preparation
Alginate-fly ash composite beads employed as an adsorbent were prepared in two steps. In the first step, sodium alginate (1 % w/v) in 100 mL distilled water was dissolved followed by addition of known amount of fly ash and agitated for 30 minutes. In the second step the solution of alginate-fly ash was added into a 100 mL solution of 0.1
M CaCl2 solution drop wise with the help of a syringe with
constant stirring. The schematic diagram of bead preparation and the process of turning of sodium alginate into a gel is described in Figure 1.
Figure 1. The process of turning a sodium alginate solution into a gel
The produced beads were allowed to harden by leaving
them in CaCl2 solution for 24 h and thereafter filtered and
washed thrice with double distilled water. These biopolymeric beads were stored at room temperature in double distilled water and the swollen beads (Figure 2) were used for the adsorption of Zn(II) ions. Immediately before use, the calcium alginate beads were washed again three times with distilled water.
Figure 2. The swollen alginate-fly ash composite beads
FT-IR spectroscopy
FTIR spectra of the composite beads was recorded with an FTIR spectrophotometer (Perkin Elmer, Spectrum BXFTIR Spectrometer) using the KBr (Merck, Germany) disc method.
X-Ray Diffraction (XRD) studies
Powder X-ray diffraction (PXRD) measurements of composite beads was performed on a powder X-ray
diffractometer (XPERT PRO Pananlytical, model
PW3040160, Netherland) the measurement conditions were Cu K α radiation generated at 40 kV and 30 mA as X-ray
source 2– 40° (2θ) and step angle 0.01 ° second-1.
Scanning electron microscopy (SEM) studies
The surface morphology and EDAX analysis of the synthesized beads were examined with the Scanning Electron Microscope (Zeiss EVO 40). A few samples of beads were taken on a copper stub and sputtered with gold for 2 minutes. These gold-coated microspheres were mounted on the SEM instrument and photographs were taken at different magnifications.
Thermal analysis
The thermal stability of the alginate-fly ash composite beads was assessed by the thermogravimetric analyzer. Thermogravimetric analysis was carried out within 30 – 800 °C at 10 °C min-1, in nitrogen flow (TGA 2050 Thermal gravimetric Analyzer).
Beads size
The size of 100 beads was measured by a calibrated scale and their average size was calculated.
Bulk Density
For the determination of bulk density of beads accurately weighed amount of the beads and transferred into 50 mL measuring cylinder. It was subjected to tapping for 3 times and the volume occupied by the beads was noted. Bulk
density was estimated by using the following formula.16
Swelling index
100 mg of dry beads were soaked in pH 7.4 phosphate buffer and the beads were reweighed at regular intervals of time, carefully wiping off the excess liquid with a tissue
paper.17 The under given expression was used for swelling
index determination:18
where
Wt and W0 are the weight of the beads at time ‘t’ and
under dry state, respectively.
Batch adsorption experiments
A stock solution of Zn(II) ions was prepared by dissolving accurate weight of zinc in definite volume of distilled water. Proper concentrations of the adsorbate were prepared from the stock solution through proper dilution. The required concentration for the adsorption experiments were prepared by serial dilution. The initial pH of the solution was adjusted by using either 0.1 M NaOH or 0.1 M HCl. The batch adsorption experiments were performed on an orbital shaker (Khera Lab Instruments). At the end of a predetermined time interval, the adsorbent was removed by filtration and the residual Zn(II) ions was estimated in the filtrate by atomic absorption spectrophotometer (Analytic Jena; ZEEnit 700 P). The effect of initial pH (2–10), agitation time (1–24 h), bead dose (10-80), bead composition (0.1– 0.7 g fly ash),
and initial metal concentration (5–30 mg L-1) on the
adsorption process, as well as to what extent the adsorption data obey Langmuir and Freundlich adsorption isotherms were investigated.
Calculations
The percent removal of metal ions was calculated by using the Eqn. 1.
where,
R is the removal,
Ci is the initial metal concentration and
Cf is the final concentration of the metal ion in mg L-1.
The sorption capacity was calculated from Eqn. 2
where,
Qe is the adsorption capacity (mg g-1),
Ci is the initial metal concentration (mg L-1),
Ce is the equilibrium concentration of metal (mg L-1),
W is the adsorbent dose (g) and V is the solution
volume (mL).
Results and discussion
FTIR Analysis
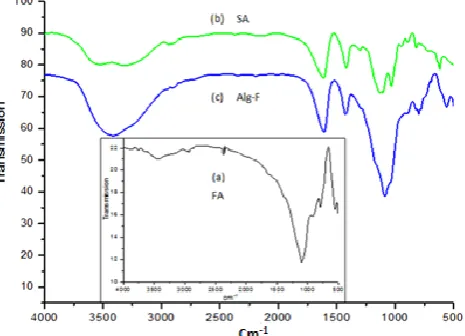
The infrared spectra for the fly ash (FA), sodium alginate (SA) and composite beads of alginate-fly ash (Alg-F) in the
wavelength range of 4000–500 cm-1 is shown in Figure 3.
The IR spectrum of FA, SA and composite beads of Alg-F
exhibiting bands at 3435.15 cm-1, 3316.00 cm-1 and 3430
cm-1 which correspond to OH stretching mode in molecular
water.19 In the FTIR spectrum of fly ash, the band at 3435
cm-1 has been assigned to H-O-H stretching vibrations from
interlayer water and Si-O-H stretching vibrations of the
structural -OH group. The bands at 2924 cm-1 (CH
stretching) in FA were also detected.19 The characteristic
band at 1099 cm-1 has been assigned to Si-O stretching
vibration. The absorption bands at 797.20 assigned as Si-O
vibrations in SiO2. The absorption bands at 553.84 cm-1 are
strong bending vibrations corresponding to Al-O-Si.20-22
In the spectra of SA the characteristic peak of sodium
alginate appeared at 820.68 cm-1.23 The IR spectrum of the
pure sodium alginate displayed characteristic peaks at 3316
cm-1 , 2944.46 cm-1 and 1610 cm-1 due to O-H, N-H and
C=O groups, respectively.24 The adsorption peak of 1610
cm-1 assigned to the asymmetrical stretching vibration of –
COO– groups. Small peaks observed at 1610.79-1420.21
cm-1 were attributed to carboxylate groups.25
Figure 3. IR Patterns of (a)-Fly ash (FA), (b)- Sodium alginate (SA) (c)- Composite beads, (Alg-F)
-i f
(%) = 100 (1)
i C C R
C
i e e
( )
(2) 1000
V C C
Q
W
weight of the beads Bulk density=
bulk volume of the beads
t 0
0
-Swelling Index =W W
In the spectra of Alg-F the characteristic peak of sodium
alginate appeared at 819 cm-1 was observed. The presence of
functional groups of sodium alginate on the surface of beads
is verified by peaks at about 3417 cm-1 and 2940 cm-1 and
1608.06 cm-1 due to O-H, N-H and C=O groups,
respectively. The peak 3417.97 cm-1 has been assigned to
the H-O-H stretching vibrations of the interlayer water. The
bands at 1608.06 cm-1 and 1424.04 cm-1 assigned to be
bending vibrations of NH and NH2 and the characteristics
peaks of Si-O-Si vibration and SiO2 was observed at 462.10
cm-1 and 798.11 cm-1 respectively. However, after the
formation of Alg-F beads the absorption peaks in pure
sodium alginate at 1026.35 cm-1 assigned to the
asymmetrical stretching vibration of -COO- groups coupled
with the peaks at 1032.22 cm-1 and shifted to 1688.08 cm-1.
The absorption bands at 560.53 cm-1 are strong bending
vibrations corresponding to Al-O-Si. The presence of these bands in Alg-F complex indicates the presence of fly ash in the alginate matrix but the intensity of this peak is increased compared to fly ash and sodium alginate. Furthermore, the
bands at about 3441.80 cm-1 and 3316 cm-1, which were the
stretching vibration of groups involved in both inter and intramolecular hydrogen bonds, broadened and coupled with
–OH band of sodium alginate at 3400 cm-1, induced by the
addition of sodium alginate to fly ash implying that the occurrence of hydrogen bonds between -OH groups of sodium alginate and fly ash molecules. Small peaks
observed at 1614.98-1423.42 cm-1 were attributed to
carboxylate groups.25
All the spectra show presence of several ─OH and ─COOH groups. Hydrogen of these groups is capable of ion exchange with metal cation.
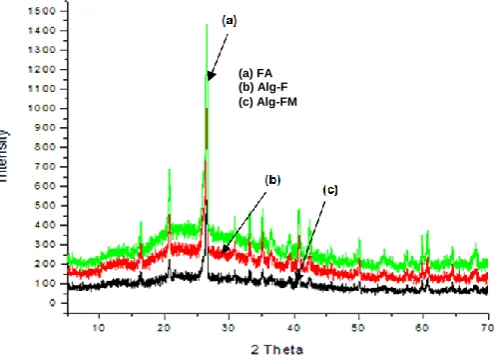
XRD Analysis
The XRD patterns of fly ash (FA), composite beads before adsorption (Alg-F) and after adsorption (Alg-FM) in shown in Figure 4. Sodium alginate is usually crystalline due to strong interaction between the alginate chains through
intermolecular hydrogen bonding.26
Figure 4. XRD Patterns of (a)-Fly ash (FA), (b)- Alginate-fly ash composite beads(Alg-F), (c)-Composite beads after metal adsorption, (Alg-FM)
It was observed that the fly ash consisted of crystalline minerals mullite, quartz, hematite and small amounts of calcium oxide with large characteristic peaks of quartz
(SiO2). This result is similar to that reported for a fly ash
investigated.27 It can be observed that there are no
significant differences for all XRD profiles but the large
characteristic peaks of quartz (SiO2) in the Alg-F than those
for Alg-F and Alg-FM are indicative of large SiO2
concentrations. The intensity of quartz is very strong, with mullite forming a chemically stable and dense layer. The FA is of lower activity and at this state its glassy surface layer particles is dense, chemically stable and also protected the more active inner constituents of the fly ash comprises of porous, spongy and amorphous particles. Three diffraction peaks at 2θ values 16º, 21º and 41º were observed for sodium alginate.
In case of Alg-F, the intensity of diffraction peaks of alginate decreased notably which indicates that the nucleation and growth of semiconduct or metal particles affected the crystalline nature of sodium alginate. The pattern of fly ash has sharp peaks showing the crystalline nature of the fly ash. After the formulation of beads the XRD patters shows very weak, unoriented, hump like shape
indicating Alg-F is an amorphous material.28
The low degree of crystallinity shows that in-situ
nucleation leads to the formation of very small nuclei and interaction with the polymer prevent any further crystallization of fly ash. If sodium alginate and fly ash have low compatibility, each polymer would have its own crystal region, so X–ray diffraction patterns are expressed as simply mixed patterns of sodium alginate and fly ash with the same ratio. However, in comparison to fly ash the patterns of the Alg-F show that the intensity of diffraction peak between 2θ values 12º-36º decreased. This means intermolecular hydrogen bonds between sodium alginate and fly ash and was introduced, which destroyed the original molecular structure of sodium alginate, resulting in the changes of diffraction patterns.
Same pattern was observed after the adsorption of metal on alginate-fly ash beads (Alg-FM), the XRD the patterns of the shows decrease in the intensity of diffraction peaks than Alg-F. This means intermolecular hydrogen bonds between Alg-F and metal were introduced, which destroyed the original molecular structure of Alg-F, resulting in the changes of diffraction patterns.
SEM Studies
SEM images of Alginate-fly ash (Alg-F) beads taken at different magnification are shown in Figure 5. The beads are found to be around 100 μm and the SEM images reveal the presence of pores on the surface and the beads were almost spherical in shape with networked and smooth surfaces. The SEM of the microbeads prepared with sodium alginate are spherical in shape exhibits a sandy appearance. The image portrays layers of crosslinked polymers that are formed
inside the bead. At magnification 1.1 KX bridging and dense
nature of beads is due to coalescence and fusion to the colloidal aqueous polymer dispersions in the alginate-fly ash matrix.
Figure 5. Scanning electron micrographs and EDAX of alginate-fly ash beads
The EDAX analysis of the bead surface disclosed the beads composition. EDAX is the microanalysis technique
that could provide information of the bulk composition.29
Evidently, EDAX peaks of metals and each element used for the synthesis along with notable amount of oxygen from alginate backbone on the surface of the beads.
Thermal Studies
The TGA/DTA thermogram of alginate-fly ash beads (Alg-F) shows (Figure 6) high thermal stability in the temperature region of 30-900 °C. The Alg-F shows three zones of weight loss. TGA shows the onset of decomposition near 30 ºC which is due to the loss of water molecules trapped in the samples.
Figure 6. The TGA/DTA thermogram of alginate-fly ash beads (Alg-F)
DTA curves shows an endothermic peak at 75.85 oC
attributed to the loss of water absorbed in the beads, the
exothermic peak at 442.12, 513.02 and 625.77 oC means
the taking place of thermal degradation of intermolecular side chain. Second weight loss was observed in the temperature range from 29-214 °C, implying that the occurrence of different extent thermal degradation of sodium alginate, rupture of alginate chains. Third weight loss was observed approximately 35 % from 409-902°C indicates the rupture of chains, fragments, and monomers
resulting in 51 % residual. Weight loss in the temperature range from 600-750 °C is due to the loss of hydroxyl groups in the aluminosilicate structure. Significant changes of DTA curves of the beads suggest that a strong interaction established between sodium alginate and fly ash molecules.
TGA curve of beads after metal adsorption (Alg-FM) shows three thermal decomposition stages (Figure 7). The first weight loss of 12 % from 32-200 °C corresponds to the evaporation of free water. DTA curves show an endothermic
peak at 68.63 oC due to the loss of water bound to the
cations present within the interlayer.
Second weight loss of 60 % was observed 200-286 oC
indicates which resulted from the greatest thermal degradation of the thermal degradation of sodium alginate along with decomposition of metal adsorbed on beads.
DTA curves shows a sharp exothermic peak at 247.06 oC
which resulted from the greatest thermal degradation of the zinc. Third major weight loss was observed approximately 60% from 300-700 °C indicates the rupture of chains, fragments, and monomers resulting in 19% residual.
The starting temperature of the greatest thermal degradation increased in the sequence of Alg-F (214.78)>
Alg-FM (188.60 oC), which is the same as that of their
crystallinity, implying thermal stability of the beads were improved by their crystalline domains and hydrogen
bonding interactions.30
Figure 7. The TGA/DTA thermogram of alginate-fly ash beads after metal adsorption (Alg-FM)
Apart from this the average size, bulk density and swelling ratio of beads calculated are; 0.12 cm, 0.34 g mL-1 and 28.65 respectively.
Batch Adsorption Studies
Effect of pH
adsorption therefore occurs before the beginning of
hydrolysis.31 When the pH of the adsorbing medium was
increased from 2-6, there was a corresponding increase in de-protonation of the adsorbent surface, leading to decrease
in H+ ion on the adsorbent surface, which favours adsorption
of positively charge species and the positive sites on the
adsorbent surface.32,33 The results obtained are shown in
Figure 8, which shows the effect of pH on the adsorption of Zn(II) ions from the aqueous solution on fly ash composite beads.
Figure 8. Effect of pH on removal of Zn(II) ions
It is clear that Zn(II) ions was effectively adsorbed in the pH range of 4-6 and the maximum adsorption of ion fly ash beads occurred at pH 6 thus, pH 6 is chosen for all experiments. The decrease in adsorption at pH greater than 6 is probably due to the formation of hydroxide. This is in
agreements with the results obtained by Khalid et al.34 for
adsorption of lead on rice husk. The hydrolysis of cations occurs by the replacement of metal ligands in the inner
coordination sphere with the hydroxyl groups.35 This
replacement occurs after the removal of the outer hydration sphere of metal cations. Adsorption may not be related directly to the hydrolysis of the metal ion, but instead of the outer hydration sphere that precede hydrolysis.
Most probably, the removal of Zn(II) ions from the aqueous solution by alginate-fly ash beads involves a complex mechanism which is partly controlled by adsorption and partly by the chemical precipitation at the solid solution interface and also partly by the pore filling
mechanism.36
Figure 9. Effect of beads dose on removal of Zn(II) ions
Effect of adsorbent dose
The effect of adsorbent dose on the adsorption of these metal ions by varying amount of bead dose is shown in Figure 9. It was observed that the dose of beads (10–80) definitely influences the amount of adsorbed metal ions. It was observed that percentage removal of zinc was increased with the increase of no. of beads up to 40 beads. Further, the increase in beads reduces the percentage removal of Zn(II) ions to some extent.
The adsorption of metal ions on alginate-fly ash beads
may involve metal interaction.37 and co-ordination to
functional. According to Shukla et al., 38 the decrease in
adsorption with increase in adsorbent dose is due to the high number of unsaturated sites.
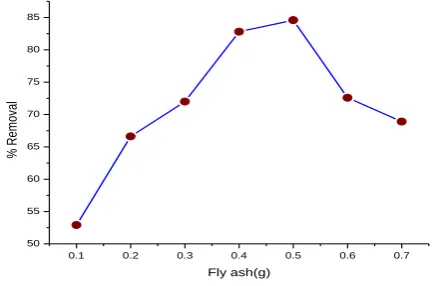
Effect of bead composition
The effect of fly ash composition in the beads on the adsorption of the Zn(II) ions is shown in Figure 10. It was observed that the amount of adsorbent dose in the range (0.1–0.7 g) definitely influences the amount of adsorbed metal ions.
Figure 10. Effect of bead composition on removal of Zn(II) ions
It was observed that percentage removal increased with the increasing the concentration of fly ash up to 0.5 g, where it was maximum. Further, the increase in fly ash amount in the beads composition reduces the percentage removal of
Zn(II) ions due to high number of unsaturated sites.38
Effect of contact time
The effect of contact time on the adsorption of Zn(II) ions is shown in Figure 11. The results indicated that increase in the contact time increased the metal uptake but remained constant after an equilibrium time.
The uptake of Zn(II) ions was rapid and the equilibrium was attained in 8 hours of contact between the adsorbent and
metal solution. According to Bhattacharya and Gupta39 the
initial high rate of metal uptake may be attributed to the existence of the base surface. However, the number of available adsorption sites decreased as the number of metal ions adsorbed increases.
2 4 6 8 10
0 20 40 60 80 100
%
R
em
ov
al
pH
0 10 20 30 40 50 60 70 80 90
60 65 70 75 80 85
%
R
em
ov
al
No. of beads
0.1 0.2 0.3 0.4 0.5 0.6 0.7
50 55 60 65 70 75 80 85
%
R
em
ov
al
Figure 11. Effect of contact time on removal of Zn(II) ions
The enhanced adsorption of metal ions with in agitation time may also in boundary resistance to mass transfer in the bulk solution and an increase in the kinetic energy of
hydrated ion.40 By increasing the agitation time, the
boundary layer resistance will be reduced and there will be an increase in the mobility of ions in the solution.
Adsorption models
Since, the adsorption isotherm is important to describe how adsorbate will interact with adsorbents and so is critical for design purpose, therefore, data using an equation is
essential adsorption operation.41 Modelling of equilibrium
data is fundamental for the industrial application of adsorption since it gives information for comparison among different adsorbent under different operational conditions,
designing and optimizing operation procedure.42
The result of batch equilibrium was used to characterize the equilibrium between the amount of adsorbate that accumulated on the adsorbate and the concentration of dissolve adsorbate. The experimental isotherm data set obtained was fitted using adsorption models including the
Langmuir and Freundlich isotherm.43, 44
The isotherm constants of Langmuir and Freundlich were calculated using normal linearization method.
Freundlich model
The adsorption data have been fitted to the Freundlich isotherm. Its linearised form is represented by Eqn. 3.
where,
Ce is the equilibrium concentration (mg L-1),
Qe is the amount adsorbed (mg g-1)
K is adsorption capacity and
1/nis adsorption intensity.
A plot of log Qe versus log Ce gives a straight line of slope
1/n and intercept K is shown in Figure 12.
Figure 12. The linearized plot for the Freundlich adsorption isotherm of Zn(II) ions using biopolymer composite beads of alginate-fly ash
Langmuir model
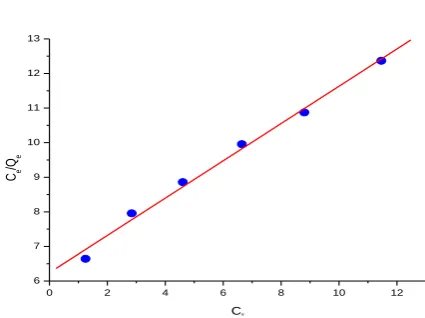
The capacity of metal binding was determined by plotting
Ce/Qe against Ce, using the Langmuir equation. The plot of
the specific sorption Ce/Qe against equilibrium concentration
Ce gave the linear isotherm parameters Qmax, b and the
coefficient of determination (R2). The linear equation of
Langmuir represented as Eqn. - 4.
where,
Ce is the metal concentration in the solution at
equilibrium (mg L-1),
Qmax (adsorption capacity) and
b (energy of adsorption) are the Langmuir constants.
Figure 13. The linearized plot for the Langmuir adsorption isotherm of Zn(II) ions using biopolymer composite beads of alginate-fly ash
The Langmuir isotherm model effectively describes the
sorption with R2 values. The sorption capacity, Q
max which
is a measure of maximum adsorption capacity corresponding to complete monolayer coverage showed that composite beads of alginate-fly ash beads had a mass capacity for
Zn(II) ions is 1.8554 mg g-1.
0 100 200 300 400 500 600 700
0 20 40 60 80 100
%
R
e
m
o
va
l
Time (min)
1
(4)
max max
Ce Ce
Qe Q bQ
1
lgQe lgK lgCe (3)
n
0.0 0.2 0.4 0.6 0.8 1.0 1.2
-0.8 -0.7 -0.6 -0.5 -0.4 -0.3 -0.2 -0.1 0.0
L
o
g
Q
e
Log Ce
0 2 4 6 8 10 12
6 7 8 9 10 11 12 13
Ce /Qe
The adsorption coefficient b which is related to the apparent energy of adsorption Zn(II) ions is 0.0860. The
plots of Ce/Qe against Ce for adsorption of Zn(II) ions gave a
straight line are shown in Figure 13. It has seen that the linear fit is fairly good and enables the applicability of the Langmuir model to the Zn(II) ions adsorption on the alginate-fly ash composite beads.
The essential characteristics of Langmuir equation can be
described by dimensionless equilibrium parameter,45 R
L
which is defined as;
where,
b is the Langmuir constant
C0 is the initial metal concentration of Zn(II) ions.
In the present study the RL for Zn(II) ions were found
between 0 and 1 as shown in Figure 14, for the initial
concentration of Zn(II) ions of 5-30 mg L-1 indicating that
the adsorption of Zn(II) ions is favorable. The RL values
indicate the shape of isotherm as shown in Table 1. The RL
values between 0 and 1 indicate favorable adsorption.46
Figure 14. RL vs initial concentration of metal ions
Table 1. Relationship between RL and type of isotherm
RL Type of isotherm
RL > 1
RL = 1
RL < 1
RL = 0
Unfavourable Linear Favourable Irreversible
Examination of correlation coefficient suggests that both the isotherms models fitted well for the sorption of Zn(II) ions. This isotherm does not predict any saturation of the sorbent by the sorbate; thus infinite surface coverage is predicted mathematically, indicating multilayer adsorption
on the surface.47 The correlation coefficient of data for
Langmuir and Freundlich plot give a value which is > 0.9 although this value for Freundlich isotherm is slightly higher
than that of Langmuir isotherm since, the correlation coefficient for both are high, it reveals that besides monolayer adsorption there is multilayered adsorption and also suggests that adsorption reaction is physico-chemical type.
The values of both Langmuir and Freundlich isotherm parameters were given in Table 2. Examination of data suggests that Freundlich isotherm is a good model for the
sorption of Zn(II) ions. The values of 1/n that vary between
0.1 and 1.0 indicate the favorable adsorption of heavy
metals.48
Table 2. Langmuir and Freundlich adsorption parameters for the adsorption of Zn(II) ions at 30 oC.
Langmuir Parameters Freundlich Parameters
Qmax, (mg g-1) 1.8554 K 1.2610
b (L, mg-1) 0.0860 1/n 0.1449
R2 0.9700 R2 0.9860
The Langmuir model deals with monolayer coverage and constant adsorption energy while Freundlich equation deals
with physicochemical adsorption on heterogeneous
surfaces.49 The applicability of both these isotherms to the
alginate-fly ash composite beads, in the present study, implies that monolayer adsorption and heterogeneous surfaces conditions exist under the experimental conditions used. The adsorption properties of the adsorbent are thus likely to be complex, involve more than one mechanism.
Figure 15. Desorption profile for Zn(II) ions
Desorption studies
In order to desorb the metal ions, the beads loaded with Zn(II) ions were exposed to 20 mL of distilled water, 0.1 M HCl and 0.1 M NaOH separately for 15 minutes and washed with double distilled water. It was found that 0.1 M HCl is the better eluent for desorption of metal from the beads (Figure 15). The beads were then again exposed to distilled water, followed by 0.1 M HCl, to strip any remaining Zn(II) ions. The desorbed beads were reused in next adsorption experiments. In order to show the multiple reuse of adsorbent beads, an adsorption-desorption cycle of metal ions was repeated three times using the same preparations.
L
0
1
(5) 1
R
nC
b
5 10 15 20 25 30
0.2 0.3 0.4 0.5 0.6 0.7
RL
Concentration (mg L-1
)
-10 0 10 20 30 40 50 60 70 80 90
0 2 4 6 8 10 12 14 16 18 20
M
et
al
C
on
ce
nt
ra
tio
n
(m
g
L
-1 )
Contact Time (min.)
Conclusions
This work indicates that alginate-flyash composite beads can be used for removal of Zn(II) ions from wastewater. Both Langmuir and Freundlich isotherm models can be used to estimate maximum metals uptake and the affinity parameter. It was found that the adsorption equilibrium data was better fitted by both the Freundlich and the Langmuir isotherm in the concentration range studied. The removal of Zn(II) ions was found to depend on adsorbent dosage, composition of beads, solution pH and contact time. Solution pH is an important parameter affecting adsorption
of ions and maximum removal for Zn(II) ionsat pH value
6.0. The adsorption mechanism of Zn(II) ions on alginate-fly ash composite beads involves either cation exchange or complexation between the metal cation and the hydroxide ion in the solution. This study shows a new trend for using alginate-fly ash composite beads for the benefit of environmental pollution control.
Acknowledgements
Authors are thankful to the Head, Department of Chemistry, Director, USIC, University of Delhi, and Director of AIRF-Jawaharlal Nehru University for providing instrumentation facilities and UGC [F.15-76/12 (SA-II)] for providing financial assistance.
References
1Ayoub, G. M., Semerjian, L., Acra, A., El Fadel, M. and
Koopman, B., J. Env. Eng., 2001, 27, 196- 207.
2Ho, Y. S. M., Water Res., 2003, 37, 2323-2330.
3Inbaraj, B. S., Selvarani, K. and Sulochana, N., J. Sci. & Ind. Res.,
2002, 61, 971–978.
4Lo, W. H., Chua, H., Lam, K. H. and Bi, S. P., Chemosphere,
1999, 39, 2723-2736.
5Mellah, A. and Chegrouche, S., Water Res., 1997, 31, 621- 629.
6Undaybeytia, T., Morillo, E. and Maqueda, C., Clays Clay Min.,
1996, 31, 485-490.
7Mangale Sapana, M., Chonde Sonal G. and Raut, P. D., Res. J.
Recent Sci., 2012, 1(3), 31-40.
8Vaishnav, V., Kailash, D., Suresh C. and Madan, L., Res. J.
Recent Sci, 2012, 1, 160-165.
9Bilodeau, A. and Malhotra, V. M., ACI Mater. J., 2000, 97, 4-49. 10Ahmaruzzaman, M., Adv. Colloid Interface Sci., 2008, 143,
48-67.
11Wang, S. and Wu, H., J. Hazard. Mater. 2006, 136, 482-501.
12Wang, S. B., Soudi, M., Li, L. And Zhu, Z. H., J. Hazard. Mater.,
2006, 133, 243–251.
13Aravindhan, R., Fathima, N. N., Rao, J. R. and Nair, B. U.,
Colloids and Surfaces A: Physicochemical and Engineering Aspects, 2007, 299, 232-238.
14Davis, T. A., Volesky B. and Mucci, A., Water Research, 2003,
37, 4311-4330.
15Kuyucak, N., and Volesky, B., Biotechnol. Bioeng., 1989, 33,
823-831.
16Ashok Kumar, A., Rajesh Kumar, P., Anil Kumar, A., Lokeswara
Reddy, K., Murthy, T. E. G. K. and Venkateswara Rao, T., Journal of Applied Pharmaceutical Science, 2011, 01 (06), 127-132.
17Kanaka Durga Devi, N., Chandana, M., Sindhura, A., Ratnavali,
G. and Kavitha, R., Parmacophore, 2010, 1(3), 196-213.
18Sonone, S. B., Kokane, S. P., Shirote, P. J. And Naikawade, N. S.,
Inter. Jour. of Pharm. Tech. Res., 2011, 3(1), 225-230.
19Freddi, G., Tsukada, M. and Beretta, S., J. Appl. Polym. Sci.,
1999, 71, 1563-1571.
20Meng, M., Zhou, N. L., Zhang, S, Q. and Shen, J., Int. .J. Pharm.,
2009, 382, 45-49.
21Joshi, G. V., Patel, H. A., Bajaj, H. C. and Jasra, R. V., Colloid.
Polym. Sci., 2009, 287, 1071-1076.
22Chen, B. Y., Lee, Y. H., Lin, W. C., Lin, F. H. and Lin, K. F.,
Biomed. Eng. Appl. Basis Commun., 2006, 18(1), 30-36.
23Zhang, L., Zhou, D., Wang, H., and Sheng, S., J. Membrane Sci.,
1997, 124, 195-201.
24Nikolic, C. V., Nikolic, L. J., Stankovic, M., Kapor, A., Popsavin,
M. and Cvetkovic, D., J. Serb. Chem. Soc., 2007, 72, 737-746.
25Stuart, B., Modern Infrared Spectroscopy, Wiley, Chister, U.K.,
1996.
26Fang, D., Liu, Y., Jiang, S., Nie, J. and Ma, G., Carbohydr.
Polym., 2011, 85, 276-279.
27Sarkar, A., Bassu, A. K., Udaybhanu, G. and Rano, R., Fuel,
2006, 87, 259-277.
28Yan, F., Zheng, C. R., Zhai, X. D. and Zhao, D. J., J. Appl. Polym.
Sci., 1998, 67, 747-754.
29Velásquez, P., Leinen, D., Pascual, J., Ramos-Barradoa, J. R.,
Cordova, R. and Gómez, H., J Electroanal Chem., 2001, 510, 20-28.
30Liang, C. X. and Hirabayashi, K., J. Appl. Polym. Sci., 1992, 45,
1937-1943.
31Baes, G. B. and Mesmer, R. E., “Hydrolysis of Cations”, John
Wiley and Sons, New York, 1976.
32Kadirvelu, K. and Namasivayam, C., Adv. Environ. Res., 2003, 7,
471- 478.
33Abdus-Salam, N. and Adekola, F. A., Afr. J. Sci. Technol., 2005,
6, 55-66.
34Khalid, N., Ahmad, S., Naseer Kiani, S. and Ahmed, J., Sep. Sci.
Technol., 1998, 33, 2349-2362.
35Badmus, M. A. O., Audu, T. O. K. and Anyata, B. U., Turkish J.
Eng. Env. Sci., 2007, 31, 251 – 263.
36Knocke, W. R. and Hemphill, L. M., Water Res., 1981, 15,
275-282.
37Sengupta, A. K. and Clofford, D., Environ. Sci. Technol., 1986,
20, 149-155.
38Shukla, A., Zhang, Y. H., Dubey, P., Margrave, J. L. and Shukla,
S. S., J. Hazar. Mater, 2002, B95, 137-152.
39Bhattacharya, K. G. and Gupta, S. S., Colloid Surf. A:
Physiochem. Eng. Asp., 2006, 277, 191-200.
40Horsfall, M. and Abia, A. A., Water Res., 2003, 37, 4913-4923.
41Hashem, M. A., Abdelmonem, R. M. and Farrag, T. E.,
Alexandria Eng. J., 2007, 1, 1-9.
42Benguella, B. and Benaissa, H., Water Res., 2002, 36, 2463-2474. 43Langmuir, I., J. Am. Chem. Soc., 1918, 40, 1361-1402.
45Hall, K. R., Eagleton, I. C., Acrivos, A. and Vermeulen, T., Ind.
Eng. Chem. Fund., 1966, 5, 212-223.
46Ahalya, N., Kanamadi, R. D. and Ramachandra, T. V., Indian J.
Chem. Technol., 2006, 13, 122-127.
47Hasany, S.M., Saeed, M. M. and Ahmed, M., J. Radioanal. Nucl.
Chem., 2002, 252, 477-484.
48Unninathan, M. R. and Anirudhan, T. S., Indian Eng. Chem. Res.,
2001, 40, 2693-2701.
49Singh, K. K., Singh, A. K. and Hasan, S. H., Bioresour. Technol.,
2006, 97, 994-1001.