ISSN-L: 2501 - 1235 Available on-line at: www.oapub.org/edu
Copyright © The Author(s). All Rights Reserved.
doi: 10.5281/zenodo.3235813 Volume 5 │ Issue 9 │ 2019
COMPARATIVE STUDY OF ANTHROPOMETRICS, BLOOD
PRESSURE PHENOTYPES, AND BIOMOTOR VARIABLES AMONG
SPORTS AND NON-SPORTS UNIVERSITY STUDENTS
Micky Oloo Olutende1i,
Maximilla N. Wanzala2,
Anthony Muchiri Wangui1,
Edwin Kadima Wamukoya3
1Department of Health Promotion and Sports Science,
Masinde Muliro University of Science and Technology, Kakamega, Kenya
2Dr., Department of Public Health,
Masinde Muliro University of Science and Technology, Kakamega, Kenya
3Prof., Department of Health Promotion and Sports Science,
Masinde Muliro University of Science and Technology, Kakamega, Kenya
Abstract:
The aim of this investigation was to compare anthropometric, blood pressure phenotypes and bio-motor variables between sports and non-sports university students aged 21.4 ± 2.1 years (mean ± s) and also to study the discriminating power of selected anthropometric and bio-motor variables among university students in the two groups (sports n=119 and non-sports n=166) in Kenya. Cross-Sectional analytical study design was used in the study. University students randomly selected in both groups (n = 285) volunteered as subjects. Anthropometric parameters assessed included body mass, height, and body fat percentage. The bio-motor variables assessed included upper body endurance and abdominal endurance. Blood pressure phenotypes assessed included pulse rate and mean arterial blood pressure which was computed from systolic and diastolic blood pressures. Multivariate analysis of covariance (MANCOVA) and Linear discriminant analysis (LDA) were used for analysis in Statistical packages for social science version 25. The results showed that the non-sports group had a numerically high BMI and body fat percentage (23.4; 22.2) compared to the sports group (19.8; 17.5). With regards to blood pressure, the mean arterial blood pressure and pulse rate of the non-sports group was high (87.9; 83.3) compared to the sports group (85.9; 75.2). The multivariate test of differences in groups as a result of the linear combination of all predictor variables showed that the mean vectors for the two groups were significant
for groups (Pillai’s T, P<0.01) but not for the covariate Age (Pillai’s T, P=.149). Results for the individual test of differences in adjusted means (marginal means) showed that there were statistically significant differences adjusted for age between the sports and non-sports groups in all dependent variables(p<0.05) except Mean arterial blood pressure (f (2,282) =.988, p=.321). Results from the LDA yielded only one significant function and all six variables significantly contributed to the discriminant analysis (Wilks A = 0.639, x2 = 125.34, df=6, p < 0.01, R2 = .36). The structure coefficients of all variables were greater than 0.25. The original classification summary showed that 81.8% of the cases were correctly classified in their respective group. In conclusion, the anthropometric, bio-motor and blood pressure phenotypes of sports students were significantly different from non-sports students. The study recommended that well-planned programs of physical and mental health should be initiated in all educational institutes.
Keywords: athletes, non-athletes, anthropometric indices, body fat percentage, body
composition, linear discriminant analysis (LDA), anthropometric, bio-motor, kinanthropometry, multivariate analysis of covariance (MANCOVA), Kenya
1. Introduction
“Anthropometry” is the study of human body measurements to assist in understanding human physical variations and aid in anthropometrical classification (Nath, 1995). Kinanthropometry is a scientific discipline that is concerned with the measurement of individuals in a variety of morphological perspectives, its application to movement and those factors which influence movements including: component of body build, body measurements, proportions, compositions, shape and nutrition, motor abilities and cardiorespiratory system; physical activity including recreational activity as well as highly specialized sports performance. A person’s body fat consists of essential and storage body fat. Anthropometrics and bio-motor variables are important indices of evaluating levels of the bodies’ morphological development, nutritional status, and bodies’ symmetry degree, which is closely related to fat contents, long-term health effects, and disease risks. Body composition is, therefore, an important indicator for evaluating health and nutritional status. It is a consequence of biological and non-biological factors such as genetic, processes of aging, lifestyle and socio-economic level (Sobal & Stunkard, 1989; McLaren, 2007). An anthropometric like BMI is superior because of simple calculation, easy measurement, low costs, and good reproducibility. At the same time, it shows good resolution among different ages, genders, races, nationalities, development and maturity levels (Jingya, Ye, Jing, Xi & Tao, 2013).
ectopic sites of lipid storage (e.g., skeletal muscle, liver, and pancreatic b cells) where they can cause substantial metabolic disruption (Unger, 2003). Certain studies have shown that height is a factor in overall health while some suggest tallness is associated with better cardiovascular health and shortness with longevity (Samaras & Elrick, 2002). University students are at the early stage of adulthood and their physical functions are optimal in the lifecycle. Therefore, periodic physical examination should be taken for university students, so as to understand their physical conditions. Targeted health guidance should be performed to help them to form favorable eating and behavioral habits and to improve their life quality in the future (Jingya, Ye, Jing, Xi & Tao, 2013). The World Health Organization [WHO] proposed that 60% of human health level is determined by behavior and living habits, 15% by genetic factors, 8% by medical and service conditions, and 7% by climate (Wang, 2006).
The significant role of anthropometric characteristics in sports performance besides other factors is well known. Body composition and somatotype of a sportsman has a significant role in sports performance besides other factors like physiological and physical fitness, psychological aspects, skills, etc. The requirement of a specific physique for good performance in particular sports had been supported by different studies (Carter & Heath, 1990). Studies on the anthropometric characteristic of the human body indicate that athletes who play in a specific sport differ in somatic characteristics from the general population (Gaurav, Singh, & Singh, 2010). Due to more muscle mass in athletes than non-athletes, weight-based anthropometric indices’ performance in the detection of adipose tissue is reduced. Santos et al.’s study (2015), which was recently conducted, is a study of the few studies that examined the relationship between anthropometric indices with fat mass in athletes. The few studies that have been conducted to check differences in anthropometrics between athletes and non-athletes showed statistical differences favoring the athletes. A study by Liliana, Ileana & Alexandru, (2015) showed that there were statistically significant differences found on arm span (p<0.05) between subjects who play handball and volleyball and subjects who are not involved in any sports activity.
bio-motor variables and therefore creating a methodological gap that needed to be filled by this study. In addition, previous studies had recommended a similar study with a larger sample size and assessment of other anthropometric indices in various countries to be done. This recommendation had not been investigated in Kenya creating a research gap for this study (Damoon et al., 2018; Qureshi & Khan, 2019).
In the view of the remaining uncertainty, in the present study an attempt has been made to compare anthropometric, blood pressure phenotypes and bio-motor variables between sports and non-sports university students. Respecting existing literature from Qureshi & Khan, (2019), we hypothesized that the anthropometry, bio-motor variables and blood pressure phenotypes of sports students would be significantly different compared to non-sports students. Another aim of this study, therefore, was to develop a multivariate model that would allow the identification and quantification of the individual contributions of a series of anthropometric, bio-motor variables and blood pressure phenotypes to the classification and prediction of university athletes based on if they participate in sports or not.
2. Methods
The investigation took place among university students. The participants in the sports group were selected from athletes who were to participate in East Africa Inter-University games. Participants who were not sportspersons were randomly selected from a career week assessment at the university. Information on non-sports participation was based on self-report of the participant, where participants were non-smokers, currently taking no medication and performing no more than one hour of exercise per week. First, some explanations about the study were given to the participants. Written consent was obtained from all subjects.
2.1 Subjects/groups
Two hundred and eighty-five university students aged between 17 and 28 years (mean age 21.4 ± 2.1, CI 21.0-21.8 years) participated in this study. The sample included subjects who participated in sports and subjects who didn't participate in sports; sports (n=119), non-sports (n=166).
2.2 Measures
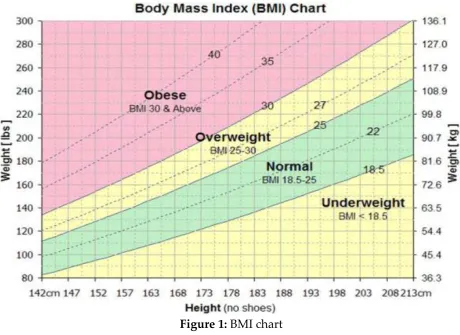
calculated by using the following formula given by Adolphe Quetelet (Verma and Mokha (1994), Kansal (1996 & 2008); BMI = Mass (Kg) / [Height in meters] ²
Figure 1: BMI chart
Body fat percentage was determined by body fat meter. The ideal weight and fat-lean ratio vary considerably for men and women and by age, but the minimum percent of body fat considered safe for good health is 5 percent for males and 12% for females. The average adult body fat is closer to 15 to 18% for men and 22 to 25% for women.
Two bio-motor variables assessed included upper body and lower body muscular endurance. Muscular endurance was assessed by mean of two imposed rhythm tests by metronome; push-ups (50 push-ups per minute till exhaustion) and sit-ups (sit-sit-ups per minute till exhaustion) (Leone & Léger, 1985).
The blood pressure phenotypes assessed included; Mean arterial blood pressure (MBP) which is the average blood pressure level during the cardiac cycle. MBP was simply estimated as DBP + (SBP-DBP)/3 (Perusse et al., 1989) and the pulse rate count over 1 minute. Blood pressure of all subjects was measured with an electronic manometer in a sitting position on with the right forearm placed horizontally on the table by following the recommendations of the American Heart Association (1981).
could not be obtained. To counter this potential problem, all testers were thoroughly trained and familiarized with proper test administration prior to actual data collection. Additionally, all tests in an individual were administered by the same tester to avoid intertester errors. The discriminant analysis is considered to be robust with these variables (Norusis, 1993).
2.3 Statistical analysis
Data analysis was done using the statistical program for social sciences (SPSS) version 25 SPSS (Inc., Chicago, IL, USA). In this study, the study variables were assessed by a two-tailed probability value of p<0.05 for significance. The data was analyzed using Multivariate analysis of covariance (MANCOVA) to determine if the groups were significantly different on a linear combination of all six predictor variables while controlling for age. The researchers deemed it necessary to conduct the MANCOVA despite the groups being only two, instead of three or more. This was important so that the combined effect of multiple dependent variables could be analyzed and at the same time controlling for age differences, which would not have been brought out by conducting multiple independent T-tests. Then, linear discriminant analysis (LDA) was also done to determine how well the six predictor variables could classify subjects into group memberships (sports and non-sports). The assumptions for MANCOVA and Linear discriminant analysis (LDA) were assessed before conducting the analysis.
The groups were mutually exclusive and no subject would belong to two groups at the same time, the predictor variables were independent of each other. The data were tested for assumptions of normality using the Shapiro Wilk test; Skewness and Kurtosis were also checked. Homogeneity of variance was checked using the Levene test. To avoid unacceptable shared variances and multicollinearity, common zero-order correlation coefficients (r) were determined for each separate variable group. Homogeneity of between groups variance-covariance matrix was checked using the Box M test. And finally, the linear discriminant assumption of sample sizes being more than five times the number of predictor variables was also met (n=285)
In the handling of missing data, Schlomer et al. (2010) outlined guidelines for best practices regarding the handling and reporting of missing data within the research. The researcher evaluated whether the data were missing completely at random (MCAR). The researcher utilized Little’s MCAR test which employs a chi-square statistical analysis and assumes the null hypothesis, that missing data is missing completely due to randomness. In this case, failing to reject the null hypothesis indicated that the data was most likely not missing in a random way. For this study, Little’s MCAR test results showed that all predictor variables were not significant indicating that the variables were missing completely at random with P greater than 0.05 (p> 0.05). The missing data items were addressed using the Expectation- Maximization (EM) algorithm within SPSS 25 SPSS (Inc., Chicago, IL, USA).
model to predict membership of each athlete in the two groups (sports and non-sports). A discriminant analysis using the Wilks A was performed to determine the ability to discriminate between the two groups using the 6 selected variables (p < 0.05). The interpretation of the obtained discriminant functions was based on examination of the structure coefficients greater than 0.30, meaning that variables with higher absolute values have a powerful contribution to discriminate between groups (Tabachnick & Fidell, 2000). Validation of discriminant models was conducted using the leave-one-out method of cross-validation (Norusis, 1993). Cross-validation analysis is needed in order to understand the usefulness of discriminant functions when classifying new data. This method involves generating the discriminant function on all but one of the participants (n-1) and then testing for the group membership of that participant. The process is repeated for each participant (n times) and the percentage of correct classifications generated through averaging for the n trials.
3. Results
The results from normality and homogeneity of variance across variables are shown in Table 1 below. From the findings, the data was not normally distributed on BMI
(p=.003) and percentage body fat (p=0.03). All variables had an equal variance between
groups with p> 0.05.
Table 1: Summary statistics for Normality and Homogeneity
Distribution
Skewness Kurtosis Shapiro Wilk P Levene’s test
BMI .807 .139 .003 .133
Pulse .127 1.284 .299 .127
Mean arterial Blood pressure .118 .182 .078 .364
Abdominal endurance .095 .070 .073 .543
Upper body endurance .188 .145 0.90 .251
Percentage body fat .668 -.110 0.03 .531
The results show that the non-sports groups had a median BMI of around 21 and the sports group had a median BMI of around 19 as shown in the stem and leaf plots in Figure 2 and Figure 3
Figure 2:BMI Stem-and-Leaf Plot for Group= NON-SPORTS
Frequency Stem & Leaf
2.00 17 . 59 1.00 18 . 6 2.00 19 . 49
11.00 20 . 13345667899
24.00 23 . 000111111222334446788899 13.00 24 . 0223333445568
16.00 25 . 0011122456778899 5.00 26 . 12339
6.00 27 . 458999 1.00 28 . 3
6.00 Extremes (>=28.7)
Stem width: 1.00 Each leaf: 1 case(s)
Figure 3: BMI Stem-and-Leaf Plot for Group= SPORTS
Frequency Stem & Leaf
3.00 Extremes (=<16.6) 1.00 16 . 9
4.00 17 . 1234
11.00 17 . 55556777889 6.00 18 . 023344 10.00 18 . 6777899999
19.00 19 . 1111222223333444444 23.00 19 . 55666677788888889999999 16.00 20 . 0000011223333334
13.00 20 . 5555666888899 .00 21 .
1.00 21 . 7 1.00 22 . 2 1.00 22 . 5
10.00 Extremes (>=22.6)
Stem width: 1.00 Each leaf: 1 case(s)
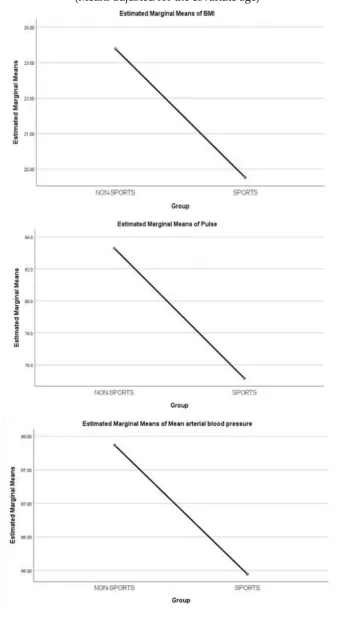
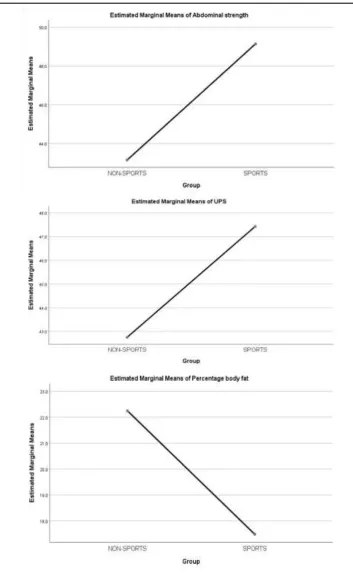
Means and standard deviations for the two groups (non-sports and sports) are presented in Table 2. The results show that the non-sports group had a numerically high BMI (23.4; 22.2) and body fat percentage compared to the sports group (19.8; 17.5). With regards to blood pressure, the mean arterial blood pressure and pulse rate of the non-sports group was high (87.9; 83.3) compared to the sports group (85.9; 75.2).
Table 2: Descriptive results from the anthropometric, blood pressure phenotypes and bio-motor variables for the two groups (values are mean, ±S. D)
Variable Non-sports Sports
BMI 23.39±3.24 19.76±1.80
Pulse 83.29±13.54 75.16±8.87
Mean arterial blood pressure 87.86±10.85 85.94±12.12
Abdominal Endurance 43.15±10.50 49.14±7.59
Upper body endurance 42.75±11.75 47.42±13.29
The Box’s M test of equality of covariance matrices yielded a significant result (f (21, 237288.152) =5.440, p< 0.01), hence leading to the rejecting of the null hypothesis that the observed covariance matrices of the dependent variables across groups were equal. Due to violation of this assumption, the Wilks’ Lambda in the multivariate test of differences in groups as a result of the linear combination of all predictor variables could not be interpreted. The researchers went ahead and interpreted the Pillai’s Trace. The global test for equality of the mean vectors for the two groups was significant for groups (Pillai’s T, P<0.01) but not for the covariate Age (Pillai’s T, P=.149). This showed that the groups were statistically significantly different in a linear combination of all dependent variables.
Table 3: Multivariate Results of the differences in groups from a linear combination of all variables
Effect Value F Hypothesis df Error df Sig. Partial Eta Squared
Intercept Pillai's Trace .569 60.981b 6.000 277.000 .000 .569
Wilks' Lambda .431 60.981b 6.000 277.000 .000 .569
Age Pillai's Trace .033 1.595b 6.000 277.000 .149 .033
Wilks' Lambda .967 1.595b 6.000 277.000 .149 .033
Group Pillai's Trace .354 25.313b 6.000 277.000 .000 .354
Wilks' Lambda .646 25.313b 6.000 277.000 .000 .354
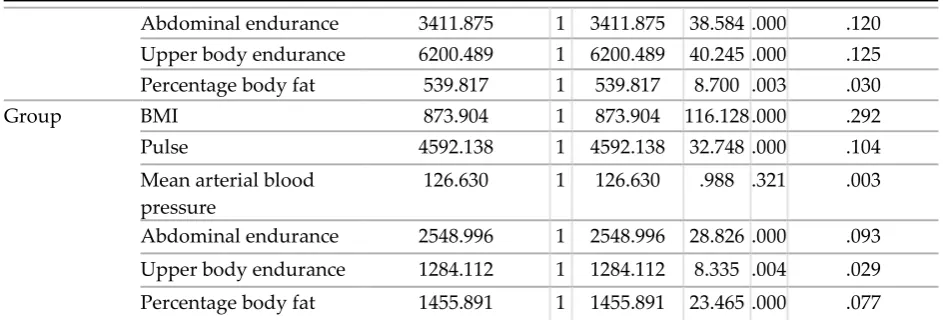
Results for the individual test of differences in adjusted means (marginal means) showed that there was statistically significant differences adjusted for age between the sports and non-sports groups in all dependent variables except Mean arterial blood pressure; BMI (f(2,282)=116.1, p<0.01),Pulse (f(1,282)=32.8, p<0.01),,Mean arterial blood pressure (f(2,282)=.988, p=.321), Abdominal strength (f(2,282)=28.8, p<0.01),,Upper body strength (F(2,282)=8.343, p=0.04), and Percentage body fat (f(2,282)=23.5, p<0.01). Effect sizes (Partial Eta squared) show that BMI explained the greatest variance in the model at 29.2% adjusted for age. Table 4 below shows the results in detail.
Table 4: Tests of Between-Subjects Effects controlling for Age
Source Dependent Variable
Type III
Sum of Squares df
Mean
Square F Sig.
Partial Eta Squared
Corrected Model
BMI 911.971a 2 455.985 60.593 .000 .301
Pulse 4626.041b 2 2313.021 16.495 .000 .105
Mean arterial blood pressure
904.792c 2 452.396 3.531 .031 .024
Abdominal endurance 2550.156d 2 1275.078 14.420 .000 .093
Upper body endurance 1713.921e 2 856.960 5.562 .004 .038
Percentage body fat 1604.742f 2 802.371 12.932 .000 .084
Intercept BMI 905.879 1 905.879 120.376 .000 .299 Pulse 14367.107 1 14367.107 102.456 .000 .266 Mean arterial blood
pressure
Abdominal endurance 3411.875 1 3411.875 38.584 .000 .120 Upper body endurance 6200.489 1 6200.489 40.245 .000 .125 Percentage body fat 539.817 1 539.817 8.700 .003 .030
Group BMI 873.904 1 873.904 116.128 .000 .292
Pulse 4592.138 1 4592.138 32.748 .000 .104 Mean arterial blood
pressure
126.630 1 126.630 .988 .321 .003
Abdominal endurance 2548.996 1 2548.996 28.826 .000 .093 Upper body endurance 1284.112 1 1284.112 8.335 .004 .029 Percentage body fat 1455.891 1 1455.891 23.465 .000 .077
3.1 Discriminant Analysis
The 6 variables selected for inclusion in the discriminant analysis exhibited low shared variances, as exhibited by their common zero-order correlation coefficients (see Table 5). The only exception to this was the shared variance for abdominal endurance and abdominal endurance (r2 = 0.112), abdominal endurance and percentage body fat (r2 = 0.1). However, the correlations were low and not significant.
Table 5: Common zero-order correlation coefficients (r) of variables selected for inclusion in the discriminant analysis
BMI Pulse
Mean arterial blood pressure
Abdominal endurance
Upper body endurance
Percentage of body fat
BMI 1.000
Pulse .031 1.000 Mean arterial
blood pressure
.087 .178 1.000
Abdominal endurance
-.182 -.129 .027 1.000
Upper body endurance
-.072 -.094 .021 .335 1.000
Percentage body fat .207 .202 .015 -.309 -.278 1.000
Table 6: Functions at group centroids
Function 1
Non-Sports .634
Sports -.884
Table 7: Discriminant function coefficients and tests of statistical significance
Structure matric coefficient Unstandardized discriminant functions
Function 1 Function 1
BMI .872* .808
Pulse .453* .386
Mean arterial blood pressure -.420* -.023
Abdominal endurance .399* -.173
Upper body endurance -.248 -.072
Percentage body fat .111 .081
Wilks’ Lambda .639
Chi-square 125.34
P <0.01
Eigenvalue .565
% of variance 100
Canonical correlation .601
The original classification summary shows 81.8% of the cases correctly classified in their respective group (Table 8). This is significant when compared to the proportional chance (p < 0.05). The leave-one-out test summarizes the ability of the discriminant functions to correctly classify the players in their respective sports. This analysis provided an overall percentage of successful classification of 81.3% for the non-sports and 82.4% for the sport's participants. From the analysis, it's clear that sports and non-sports athletes varied significantly in anthropometrics, blood pressure phenotypes, and bio-motor variables.
Table 8: Classification matrix for the groups according to anthropometric, blood pressure phenotypes and bio-motor variables of the discriminant functions
Group Non-Sports Sports Total
Original Count Non-Sports 135 31 166
Sports 21 98 119
% Non-Sports 81.3 18.7 100.0
Sports 17.6 82.4 100.0
Cross-validated Count Non-Sports 132 34 166
Sports 22 97 119
% Non-Sports 79.5 20.5 100.0
Sports 18.5 81.5 100.0
a. 81.8% of original grouped cases correctly classified.
b. 80.4% of cross-validated grouped cases correctly classified.
4. Discussion
The aim of this investigation was to compare anthropometric, blood pressure phenotypes and bio-motor variables between sports and non-sports university students and also to study the discriminating power of selected anthropometric and bio-motor variables among university students in the two groups (sports n=119 and non-sports
(23.4; 22.2) and body fat percentage compared to the sports group (19.8; 17.5). With regards to blood pressure, the mean arterial blood pressure and pulse rate of the non-sports group was high (87.9; 83.3) compared to the non-sports group (85.9; 75.2). This is probably due to the physiological benefits of training in the sports group. Legaz and Eston (2005) also reported that the change in front thigh skin-fold thickness (r =-0.74, P < 0.001) and medial calf skin-fold thickness was related to performance (r = -0.70, P = 0.008). Other studies found that athletes were having less waist circumference, the thickness of four skin-fold, waist- to- hip ratio, body fat percentage; fat mass but higher in lean body mass than the non-athletes (Pallob & Sanjib, 2015).
Kruschitzthe et al. (2013) studied the relationship between BMI and the subcutaneous adipose tissue within young athletes and non-athletic controls. When using BMI to discriminate between athletes and non-athletes only 52.4% of them were correctly classified. They suggested that compared to BMI levels, subcutaneous fat patterns are a more accurate way of discriminating between athletes and non-athletes. According to Qureshi & Khan, (2019) involvement of Sportspersons in rigorous physical activities during conditioning/ Training classes and sports tournaments, build up the muscular body and burn out their excessive adipose tissue. In contrary non-sports persons have a sedentary lifestyle, hence had more percentage of fat in their body. Increase in fat percentage may lead to Obesity, which is the independent risk factor for Cardio Vascular Diseases (CVD), particularly for coronary heart disease (CHD) (Qureshi & Khan, 2019).
The current study also found significant differences between sports and non-sports students in Percentage body fat (f (2,282) =23.5, p<0.01) and BMI (f (2,282) =116.1,
p<0.01). In corroboration is a study by Neeta and Chakraborty (2014) that found there
was a definite effect of physical training on Body Mass Index, Body Fat Percent and Lean Body Mass. They reported that lifestyle and structured activity groups had significant and comparable improvements in physical activity and cardiorespiratory fitness. In addition, a study by Mathur & Salokun (1985) found that anthropometric measurements and body composition measurements were significantly different between athletes and non-athletes.
5. Conclusions
The study concludes that the anthropometric, bio-motor and blood pressure phenotypes of sports students were significantly different from no-sports students. This means that students participating in sports are physiologically advantaged due to possible long-term adaptations to training. This is evidenced by the generally low BMI, Mean arterial blood pressure, higher upper body, and low body endurance. This study is not without limitations. Our interpretation of the findings is bound by the fact that it was only focused on university students. The current sample was drawn from only one region of the country and therefore generalizability is questionable. Another limitation was the difficulty for the researchers to control for different physiologically status and factors that may influence the results of the field tests. This study recommends, for wider generalization of results, the replica of the study may be extended to other regions. Coaching as an intervention for Non-sports persons should be conducted to see its effects on different variables of physical fitness and adjustment. It is also recommended that well-planned programs of physical and mental health should be initiated in all educational institutes.
Acknowledgments
We would like to express our gratitude to athletes and students for their co-operation. And not to forget the extraordinary efforts of the field staff.
Ethical disclosures
Protection of human and animal subjects
The authors declare that the procedures followed were in accordance with the regulations of the relevant research ethics committee and with those of the Code of Ethics of the Declaration of Helsinki.
Confidentiality of data
The authors declare that they have followed the protocols of the university on the publication of the data.
Right to privacy and informed consent
The authors have obtained the written informed consent of the patients or subjects mentioned in the article. The corresponding author is in possession of this document.
Competing interest
The authors declare that they have no competing interests.
Authors & contributions
analysis. Prof Edwin Wamukoya conceived the paper and was the paper’s peer reviewer. All authors read and approved the final manuscript.
Funding
No financial support was provided.
Disclaimer
The findings and conclusions presented in this manuscript are those of the authors and do not necessarily reflect the official position of Masinde Muliro University.
References
Ackland, T., Schreiner, A., & Kerr, D. (1997). Absolute size and proportionality characteristics of World Championship female basketball players. Journal of Sports Sciences, 15, 485-490.
American Heart Association. (1981). Report of sub-committee of postgraduate education committee recommendations for human blood pressure determination of sphygmomanometer. Circulation, 64, 510A-509B.
Carter, J. E. L, Heath, B.H. (1990). Somatotyping – development, and application. Cambridge, Cambridge University Press.
Carter, J. E. L. (1984). Physical Structure of Olympic athletes, Part II, Kinanthropometry of Olympic Athletes, Ed Karger, Basel.
Damoon, A. L., Ali, N. V., Seyed, A. H., Roya, R. A., & Meysam, A. (2018). Relationship Between the Body Fat Percentage and Anthropometric Measurements in Athletes Compared with Non-Athletes. Zahedan J Res Med Sci, 20(2), e10422. Doi: 10.5812/zjrms.10422.
Gaurav, V., Singh, M., & Singh, S. (2010). Anthropometric characteristics, somatotyping and body composition of volleyball and basketball players. Journal of Physical
Education and Sports Management, 1(3), 28-32.
J. Wang and J. Ma. (2006). Health Education, Higher Education Press.
Jingya, B., Ye, He., Jing, W., Xi, H., & Tao, H. (2013). Quantitative analysis and comparison of BMI among Han, Tibetan, and Uyghur university students in
northwest China. The Scientific World Journal.
http://dx.doi.org/10.1155/2013/180863
Kansal, D. K. (2008). Test and Measurement in Sports and Physical Education. D.V.S. Publications New Delhi, 243-244.
Knechtle, B., Knechtle, P., Barandun, U., Rosemann, T. & Lepers, R. (2011). Predictor variables for half marathon race time in recreational male runners. Open Access J. Sports Med. 2, 113-119
fat patterns in athletes and non-athletes. PLoS One, 8(8), e72002. DOI: 10.1371/journal.pone.0072002. [PubMed:23991025]
Legaz, A. & Eston, R. (2005). Changes in performance, skinfold thicknesses, and fat patterning after three years of intense athletic conditioning in high-level runners.
Brit. J. Sports Med. 39, 851-856
Liliana, E. R., Ileana, M. P. & Alexandru, R. P. (2015). Comparison of anthropometric characteristics between athletes and non-athletes. Social and Behavioral Sciences,
191 (2015), 495 – 499
Mathur, D. N. & Salokun, S. O. (1985). Body Composition of Successful Nigerian Female Athletes. The Journal of Sports Medicine of Physical Fitness, 25(2), 27-31
McLaren, L. (2007). Socioeconomic status and obesity. Epidemiologic reviews, 29(1), 29–48 Nath (1995). Anthropometry, the Measurement of Body Size, Shape and Form. New Delhi:
Friends Publication
Norusis, M. (1993). SPSS for Windows releases 6.0. Chicago: SPSS Inc.
Ogden, C. L., Flegal, K. M., Carroll, M. D. & Johnson, C. L. (2002). Prevalence and trends in overweight among US children and adolescents, 1999-2000. JAMA, 288, 1728-32
Pallob, K.M., & Sanjib, M. (2015). A Study on selected anthropometric characteristics of height-weight matched female athletes and non-athletes. IOSR Journal of Sports
and Physical Education, 2(5),41-45
Perusse, L., Rice, T., Bouchard, C., Vogler, G.P. & Rao, D.C. (1989). Cardiovascular risk factors in a French-Canadian Population: Resolution of genetic and familial environmental effects on blood pressure by using extensive information on environmental correlates. Am J Hum Genet, 45, 240-251
Qureshi, A. A. & Khan, M. A. (2019). comparative study of body mass index and fat percentage- among sports and non-sports persons of Srinagar. International journal of multidisciplinary educational research,8(12), 216-225
Samaras, T. T. & Elrick, H. (2002). Height, body size, and longevity: is smaller better for the human body? The Western Journal of Medicine, 176 (3), 206–8
Santos, D. A., Silva, A. M., Matias, C. N., Magalhaes, J. P., Minderico, C. S. & Thomas, D. M., et al. (2015). The utility of novel body indices in predicting fat mass in elite athletes. Nutrition,31(7-8),948–54. DOI: 10.1016/j.nut.2015.02.003. [PubMed: 26059366]
Schlomer, G. L., Bauman, S., & Card, N. A. (2010). Best practices for missing data management in counseling psychology. Journal of Counseling Psychology, 57(1), 1-10. doi:1-10.1037/a0018082
Tabachnick, B., & Fidell, L. (2000). Using multivariate statistics. Boston: Pearson Allyn & Bacon
Unger, R. H. (2003). Weapons of lean body mass destruction: the role of ectopic lipids in the metabolic syndrome. Endocrinology, 144, 5159-65
Creative Commons licensing terms