VOLUME 16 ISSUE 1 (2018), Page 118 – 129
THE POWER OF ACCESSIBILITY TO LAND PRICE IN SEMARANG URBAN CORRIDORS, INDONESIA
Anita Ratnasari Rakhmatulloh1, Imam Buchori2, Wisnu Pradoto3, &
Bambang Riyanto4
1Department of Urban and Architecture Engineering
2,3
Department of Urban and Regional Planning 4Department of Civil Engineering
DIPONEGORO UNIVERSITY
Abstract
Urban land demand tends to keep increasing as a result of economic and population growths. The high intensity of activity will bring changes to land value. The corridors of Semarang - Ungaran and Semarang – Mranggen have significant differences in land values despite being at relatively the same distance to city centre. Similarly, the rate of land price change in these two corridors are also different. The study aims to examine and prove the effect of distance to city centre toward land price in downtown areas by employing statistical correlation analysis and accessibility calculation. The result reveals that distance to city centre has no longer effect land prices. It was found that the farther from the city centre the land prices decreases gradually but increases at road nodes that connect to the trip generation points such as toll road gate, residential area and commercial area or shopping centre.
INTRODUCTION
Urban land demand tends to increase as a result of economic development and population growths. However, the competition for urban land in a perfectly competitive market is determined by the land rent (economic land value) offered. Land use which offers high land rent is likely to win the competition. In the case of housing, the land price is affected by the existence of other surrounding land uses (Xiao, Orford, & Webster, 2015) such as transport infrastructure, urban configuration and location advantage over other urban land uses.
The existence of transport infrastructure will cause urban growth to be characterized by land value change and land use in along those lines associated with mobility and high degree of accessibility (Ball, Cigdem, Taylor, & Wood, 2014). Research about interrelation of accessibility change to land value has been undertaken in all main locations in developing countries such as Indonesia, which has demographic and cultural diversity. This research aims to determine and prove whether the proximity to city centre is correlated to land price. Land use changes will lead to the development of urban dynamics beginning with physical, functional, spatial, socioeconomic, as well as demographic changes.
Furthermore, urban accessibility change and housing prices used to estimate the change of location premium on the city structure over time (Gibbon & Machin (2005).
Changes in land value has also occurred in Semarang City, particularly in the Semarang-Ungaran and Semarang-Mranggen corridors. These two corridors have significant differences in the value land located at equal distance to the city centre. There are also differences in land price changes in both corridors, particularly at main centre of urban activities which has been observed intensively from 2012 to 2016.
Iacono and Levinson (2015) argue that the structure of transport network and accessibility are important determinants of land value and spatial structure of the city. Accessibility is in turned influenced by urban configuration of the city. In the case of Semarang-Ungaran and Semarang-Mranggen corridors, the provision of road infrastructure and urban facilities in both corridors are relatively balanced. This suggests that the differences in land value and land price changes in both corridors were due to spatial structure of the corridors. Thus, how is the urban configuration in these two corridors, what are the differences? This is the main focus of this research.
ACCESSIBILITY
causes of land attractiveness, and it gives an economic opportunity and causes land value change.
The strong interrelation between urban form and travel pattern is the phenomenon of human activity dynamic (Lingzhu, Alain, & Yu, 2015). Thus it will create high intensity of human activities, which is a potential to develop other activities with economic benefits. The high intensity of human activities will bring land value changes in those location (Ha, van den Bosch, Quang, & Zuidgeest, 2011; Salonen & Toivonen, 2013). In this case, accessibility can encourage the development of socio-economic activities in a region or city. Accessibility can be seen from the dimension of convenience that includes distance and travel time, then it is represented in travel costs which have an implication to production and selling.
Definitions of accessibility involve the destinations, human activities and even travel resistance. Accessibility can be measured by the number of provision of public transportation infrastructure and road network to support the community movement in reaching their destination (Benenson, Martens, Rofe, & Kwartler, 2011). Wee (2016) explains that the more options available to reach travel destinations to meet activities, as well as the less durable of travel (time, cost, effort) will increase accessibility levels. Accessibility changes will determine land value change, which consequently affects the land use (Khisty & Lall, 2005), If the change occurred, then the rate of trip generation will change and result in changes throughout the cycle.
People or individuals are more satisfied with the level of accessibility in a region with various land uses and public facilities (Ho, 2011). This shows that network accessibility can describe the bi-centric urban configuration that related to property prices. Network interaction and conventional accessibility can bring positive and negative impact on housing prices at specific locations (Xiao et al., 2015). The high access on land encourages potential improvements to be developed. More development will result in additional movement. In addition, some researchers mentioned issues of land values, rents, and costs within the city, which are considered to be closely related to land use patterns or land configuration (Iacono & Levinson, 2011).
DISTANCE TO CITY CENTRE
The city centre is the dominant sites of the various metropolitan areas. Iacono and Levinson (2015) state that the city centre or CBD located in the centre of the environment in most cities tend to produce large activities, as well as the level of accessibility generated which cause the high land value. But, areas with stocks of buildings, the scarcity of vacant land, and the existence of surrounding land developments would have no significant change in the level of accessibility, even in the long term. As accessibility has been recognized as crucial term in determining urban land values, the value of non-urban land (exurban) decreases by distance from the city centre due to lower level of accessibility of the non-urban area. Efthymiou and Antoniou (2013) add that price and rent value are also influenced by the proximity to city centre.
Besides accessibility, land value changes are also affected by distance from downtown / CBD and the environmental quality of the area. Thus, in assessing various land values, land location functions, external factors and accessibility are the most important factors. Therefore, urban land reformation will affect different land value between city centre and sub urban due to land market (Lin, Allan, & Cui, 2015).
MATERIALS AND METHODS
This research uses positivistic approach with quantitative techniques including accessibility calculation and descriptive statistical analysis. The accessibility indicator was measured by the estimated travel time to the city centre, assessed from the road network as well as the main road. To compute accessibility, access was defined as the distance calculated from the distance to the destination. Travel time is referred to an appropriate accessibility measurement. Corridors of Semarang- Mranggen and Corridor Semarang - Ungaran were chosen to be the study areas since their time series data with periods of 1993, 2004, 2011 and 2015 were available.
DISCUSSION
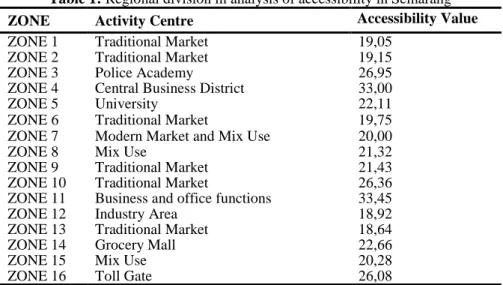
Table 1: Regional division in analysis of accessibility in Semarang
ZONE Activity Centre Accessibility Value
ZONE 1 Traditional Market 19,05
ZONE 2 Traditional Market 19,15
ZONE 3 Police Academy 26,95
ZONE 4 Central Business District 33,00
ZONE 5 University 22,11
ZONE 6 Traditional Market 19,75
ZONE 7 Modern Market and Mix Use 20,00
ZONE 8 Mix Use 21,32
ZONE 9 Traditional Market 21,43
ZONE 10 Traditional Market 26,36
ZONE 11 Business and office functions 33,45
ZONE 12 Industry Area 18,92
ZONE 13 Traditional Market 18,64
ZONE 14 Grocery Mall 22,66
ZONE 15 Mix Use 20,28
ZONE 16 Toll Gate 26,08
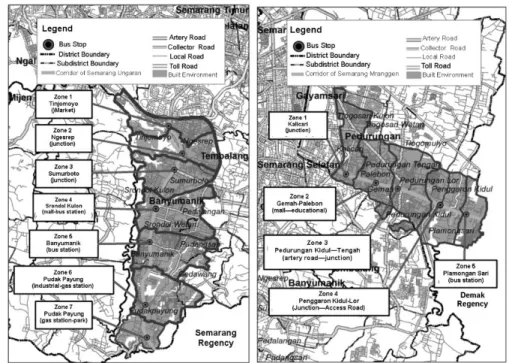
Figure 1 reveals that high accessibility level was found in West Semarang due to the residential areas and CBD. Urbanization and urban-rural interrelation have given big impact on national economic development, rural transformation and land use transition (Long, Li, Liu, Woods, & Zou, 2012). The accessibility level in corridor of Ungaran is higher than corridor of Semarang-Mranggen. The existence of Jatingaleh toll gate and Banyumanik Toll Gate was one of the factors that make the accessibility value quite high. They provide easy access to major roads. The location factors have strong influence on urban property markets and accessibility (reachable) since transport infrastructure is a very important factor (Cervero, 2004; Gibbons & Machin, 2005; Iacono & Levinson, 2015).
The second highest accessibility value was found at junction of corridor of Semarang-Ungaran with educational centre such as Diponegoro University. The accessibility values in two corridors were also not much different which both have accessibility between grades 8 to 23. The public facilities in both corridors can be seen below.
Figure 2: Delineation of service centre in corridors of Semarang-Ungaran and Semarang-Mranggen
Urban facilities such as bus station can attract human movement and generate some activities around the area. The high accessibility due to no road median enables easy access from and to the southern part of Semarang. The three urban regions whose high accessibility belongs to sub service centre located in Regional IV in Corridor of Semarang-Mranggen. Thus, the sub-municipal service centres tend to have high amount of activities with high density of settlements. The large numbers of population in those areas encourages demand for supporting facilities such as trading and commercial facilities (Simmonds, Waddell, & Wegener, 2013).
in Semarang-Ungaran was from 1.531 USD to 2.041 USD, while property land prices in Semarang-Mranggen was from 714 USD up to 1.531 USD.
Table 2: Accessibility and land price in corridors of Semarang-Mranggen and Semarang-Ungaran
Zona Total Time
(Minute)
Accessibility Value
Land Price (USD)
CSM 1 Mix Use and access Road to
Residential 261,85 18,85 1.592
CSM 2 Grocery Mall and Mix Use 283,1 16,31 1.429
CSM 3 Mix Use and Ring Road 295,6 15,38 1.027
CSM 4 Mix Use and access Road to
Residential 308,85 13,26 846
CSM 5 Bus Station and Mix Use 379,65 8,12 432
CSU 1 Mix Use and access Free Way 249,4 21,12 1.680
CSU 2 Mix Use and access Road to
Residential 273,33 20,36 1.635
CSU 3 Mix Use and access Road to
University 253,53 22,14 2.391
CSU 4 Grocery Mall and Modern
Market 324,15 22,04 1.787
CSU 5 Bus Station and Mix Used 474,25 11,63 1.132
CSU 6 Mix Use and access Road to
Residential 532,6 9,17 978
CSU 7 Mix Use and access Road to
Residential 658,6 8,50 749
*CSU : Corridor of Semarang-Ungaran; CSM : Corridor of Semarang-Mranggen
L
a
nd
P
rice
(
USD
)
Acessibility
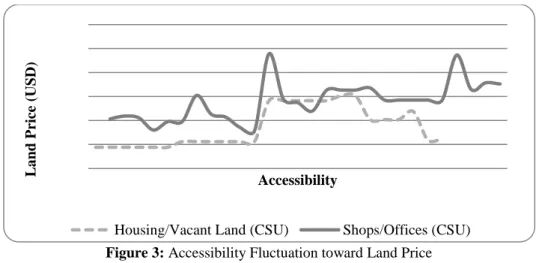
Figure 3: Accessibility Fluctuation toward Land Price
As is presented in Figure 3, the land prices in Semarang-Mranggen tend to steady with slight fluctuation. Furthermore, the corridor of Semarang-Mranggen also connects to CBD and Semarang hinterlands such as Demak/Grobogan Regency. There is artery road connects eastern and central parts of Semarang to the western parts of Semarang. Increased trip generation will lead to high levels of accessibility and land value. The increasing land value will eventually lead to the activities growth in accordance with the conditions of the region (Yang & Gakenheimer, 2007).
Figure 4 and Figure 5 show that both corridors have ahd land prices fluctuations on two types of property (shops/offices and vacant land/housing). This fluctuation is in accordance with the established theory that the more distance from downtown, land prices decline significantly but increase again at certain points. These increasing points are located on the radial roads and ring roads as well as crossroads or road intersections between radial roads and ring roads that will create local peaks of land values.
The rate of decrease of land price in Semarang-Mranggen did not differ much between land uses. The function of vacant land declined from Zone 2 to Zone 7 with the increase of land price at certain point in Zone 3 and 5, while for shop/office function has had fluctuation even though land decrease generally from Zone 2 to Zone 8 with improvements in Zones 3, 6 and 5.
L
a
nd
P
rice
(
USD
)
Accessibility
Figure 5: Land price fluctuation in relation to distance to CBD in 8 Zones in corridor of Semarang-Ungaran; (a) Vacant Land/Housing; (b) Shops/Offices
CONCLUSION
The bid-rent theory suggests that the closer to the city centre the higher the land rent is. Nevertheless, the results of this study indicate that accessibility also plays a big role in influencing land prices in the study area. The high land price in this study were located at access road to universities and residential area as well as commercial centres. This shows that accessibility strength is greater than distance from the city centre which is a representation of transportation cost. Based on the results, it can be concluded that the peak of increased land price occurred in: the intersection with radial ring, access road to urban settlement, access road to university and shopping centre. The highest point of accessibility located at ring road and toll gate because the construction of highways and toll road network creates accessibility.
REFERENCES
Ball, M., Cigdem, M., Taylor, E., & Wood, G. (2014). Urban growth boundaries and their impact on land prices. Environment and Planning A, 46(12), 3010-3026. Benenson, I., Martens, K., Rofe, Y., & Kwartler, A. (2011). Public transport versus
private car gis-based estimation of accessibility applied to the Tel Aviv metropolitan area. The Annals Regional Science, 47(3), 499-515.
Cervero, R. (2004). Effects of light and commuter rail transit on land prices: Experiences in San Diego County. Journal of the Transportation Research Forum, 43(1), 121-138.
Du, H., & Mulley, C. 2012. Understanding spatial variation in the impact of accessibility on land value using geographically weighted regression. Journal of Transport and Land Use, 5(2), 46-59.
Efthymiou, D., & Antoniou, C. (2013). How do transport infrastructure and policies affect house prices and rents? Evidence from Athens, Greece. Transportation Research Part A, 52, 1-22.
Gibbons, S., & Machin, S. (2005). Valuing rail access using transport innovations.
Journal of Urban Economics, 57(1), 148-169.
Ha, P. T. H., van den Bosch, F., Quang, N. N., & Zuidgeest, M. (2011). Urban form & accessibility to jobs a comparison of Hanoi & Randstad metropolitan areas.
Journal of Environment & Urbanization, 2(2), 265-285.
Ho, W. (2011). Land use and transport: How accessibility shape land use (Thesis).
University of Hong Kong, Pokfulam, Hong Kong SAR.
Iacono, M. & Levinson, D. (2015). Accessibility dynamics and location premia: Do land values follow accessibility change? Journal of Urban Studies, 54(2), 364-381. Iacono, M., & Levinson, D. (2011). Location, regional accessibility, and price effects:
Evidence from home sales in Hennepin County, Minnesota. Transportation Research Record,22(45), 87-94.
Jain, S., Aggarwal, P., Kumar, P., Singhal, S., & Sharma, P. 2014. Identifying public preferences using multi-criteria decision making for assessing the shift of urban commuters from private to public transport: A case study of Delhi.
Khisty, C. J., & Lall, B. K. (2005). Dasar-dasar Rekayasa Transportasi. Jakarta: Penerbit Erlangga.
Levinson, D. & Istrate, E. (2012). Access for value: Financing transportation through land value capture.Metropolitan Policy Program at Brookings, 1-15.
Lin, D., Allan, A., & Cui, J. (2015). The impact of polycentric urban development on commuting behaviour in urban China: Evidence from four sub-centres of Beijing. Habitat International, 50, 195-205.
Lingzhu, Z., Alain, C., & Yu, Z. (2015). Configuration accessibility study of road and metro network in Shanghai. Natural Science Foundation of China.
Long, H., Li, Y., Liu, Y., Woods, M., & Zou, J. (2012). Accelerated restructuring in rural China fueled by 'increasing vs. decreasing balance' land-use policy for dealing with hollowed villages. Land Use Policy, 29(1), 11-12.
Salonen, M., & Toivonen, T. (2013). Modelling travel time in urban networks: comparable measures for private car and public transport. Journal of Transport Geography,31, 143-153.
Simmonds, D., Waddell, P., & Wegener, M. (2013). Equilibrium versus dynamics in urban modelling.Environment and Planning B: Planning and Design, 40, 1051-1070.
Wee, B. v. (2016). Accessible accessibility research challenges. Journal of Transport Geography, 51, 9-16.
Xiao, W. Y., Orford, S., & Webster, C. J. (2015). Urban configuration, accessibility, and property price: A case study of Cardiff, Wales. Environment and Planning B: Planning and Design, 42, 1-22.