Original Research Article
Relation of grades of obesity with left ventricular functions
Irfan A. Bhat
1, Imran Hafeez
2*, Hardeep Singh
3, Ajaz Lone
2,
Jahangir R. Beig
1, Muezza Samer
3INTRODUCTION
Obesity is a state of excess adipose tissue mass. It is a complex multifactorial condition which pose a major risk for serious diet related chronic diseases including type 2 diabetes mellitus, cardiovascular disease, hypertension and stroke and certain forms of cancer.1 The most widely
used method to guage obesity is body mass index (BMI) which is equal to weight/(height) in kg/m2.2 Generally speaking BMI>30kg/m2 defines state of obesity. A proposal has been made to redefine the classification of obesity using BMI for Asian population as there are now evidence that increased risks of co-morbidities with obesity.2 Obesity occurs at lower BMI in Asian. This
ABSTRACT
Background: Obesity is a state of excess adipose tissue mass. It is a complex multifactorial condition which poses major risk for serious diet related chronic diseases including type 2 diabetes mellitus, cardiovascular disease, hypertension and stroke. Obesity is associated with atrial and ventricular re-modelling; obese individuals have both eccentric and concentric patterns of left ventricular hypertrophy. Obesity adversely impacts cardiac diastolic function. In a large community based investigation, BMI emerged as a key correlate of impaired diastolic filling indexes. The objective of this study was to evaluate left ventricular dimensions and functions in patients with obesity and to find correlation between left ventricular dimensions and functions with grades of obesity.
Methods: The present study was a hospital based study conducted in the Postgraduate Department of Internal Medicine, SMHS Hospital of Government Medical College Srinagar and SKIMS Kashmir. A total of 100 subjects of either gender across a spectrum of body mass were taken up for this study.
Results: The mean age was 44.7±11 years. Females (56%) were more than males (44%). The subjects were categorized into four groups which include normal BMI (18%) overweight (32%), obese I (31%) and obese II (19%). The mean BMI of our subjects was 26.8±0.3kg/m2. There was no significant change in left ventricular systolic functions. Diastolic abnormality was found in 24% of the subjects. Diastolic abnormalities were more prevalent in subjects with higher grades of obesity 47.4% in obese II and 12.5% in overweight.
Conclusions: With increasing grades of obesity, both LV dimensions and volumes were increased and subclinical LV diastolic dysfunction was present in all grades of obesity. Diastolic abnormalities were more prevalent in subjects with higher grades of obesity. Our study provides justification for the idea of obesity as a therapeutic target in prevention of increased prevalence of cardiovascular diseases.
Keywords: Body mass index, Diastolic functions, Obesity, Systolic functions
1Department of Cardiology, JK Health Services, Kashmir, Jammu and Kashmir, India
2Department of Cardiology, SKIMS, Kashmir, Jammu and Kashmir, India
3Department of Medicine, SMHS, Kashmir, Jammu and Kashmir, India
Received: 02 August 2017 Accepted: 27 August 2017
*Correspondence: Dr. Imran Hafeez,
E-mail: [email protected]
Copyright: © the author(s), publisher and licensee Medip Academy. This is an open-access article distributed under the terms of the Creative Commons Attribution Non-Commercial License, which permits unrestricted non-commercial use, distribution, and reproduction in any medium, provided the original work is properly cited.
recommendation is however based on two studies in Hong-Kong and in Singapore.3,4 It is also known that relationship between BMI and body fat percent and fat distribution are less favourable in many Asian population compared with
Caucasians/European population.5
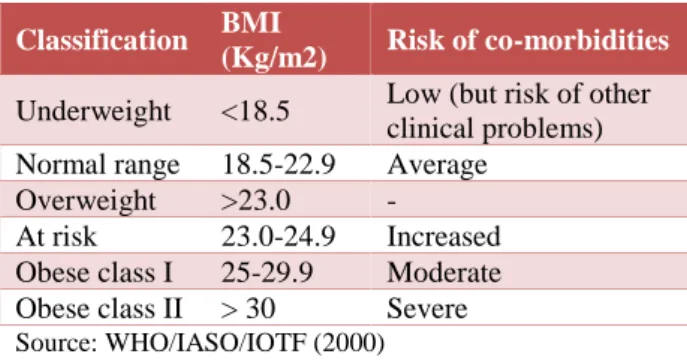
Table 1: Classification of weight status according to BMI in Asian adults.
Classification BMI
(Kg/m2) Risk of co-morbidities
Underweight <18.5 Low (but risk of other clinical problems) Normal range 18.5-22.9 Average
Overweight >23.0 -
At risk 23.0-24.9 Increased Obese class I 25-29.9 Moderate Obese class II > 30 Severe Source: WHO/IASO/IOTF (2000)
Other approaches to stratify obesity includes waist circumference which is <40 inches (102cm in men and 88 cm in women), anthropometry (skin-fold thickness), densitometry under water weighing, computer tomography (CT) or magnetic resonance imaging (MRI); and bioelectrical impedance.6
Globally there are more than one billion overweight adults and at least 300 million of them are obese. Currently obese level ranges from below 5% in China, Japan and Certain African nations to 75% in urban Samoa.7 There is a paucity of nation wise data on the prevalence of obesity in India. Studies from different states provide some clues regarding the health threat due to its problem. Available data from different published studies suggest prevalence from 10 to 50%.8,9 In Kashmir valley overall prevalence of obesity is
15.01% with 7.01% in males and 23.69% in females.10
Obesity is associated with haemodynamic overload. The increased metabolic demand imposed by expanded adipose tissue and augmented fat-free mass in obesity results in a hyperdynamic circulation with increased blood volume. Cardiac output is often higher in obesity, due to an augmented stroke volume and increase in heart rate.11 Obesity is associated with atrial and ventricular remodeling, obese individuals have larger left atrial size related to both, an expanded intravascular volume and altered LV filling properties, both eccentric and concentric patterns of LV hypertrophy have been described in overweight people with former being more common.12 Ventricular systolic function is assessed by ejection fraction or with load independent measures such as mid-wall fractional shortening is usually normal in obesity.13 The increased resting LV end-diastolic volume in obesity has been interpreted as evidence of enhanced recruitment of preload reserve (Frank-Starling mechanism). Obese people, however, may fail to increase their ejection fraction with exercise. Obesity adversely impacts cardiac diastolic function. In a recent large community based investigation, BMI emerged as a key correlate of impaired
diastolic filling indexes.14 The marked increase in prevalence of obesity has played an important role in 25% increase in diabetes that has occurred in the United States. The risk increases linearly with BMI; the prevalence of diabetes increases from 2% whose BMI ranges 25 to 29.9kg/m2, to 8% in those with BMI 30 to 34.9kg/m2 and finally to 13% in those with BMI >35 kg/m2.15 Obesity is associated with serum lipid abnormalities, including hypertriglyceredemia, reduced HDL - cholesterol levels and increased proportion of small, dense LDL particles.16 There is a linear relationship between hypertension and BMI.17 In National health and nutritional examination survey (NHANES 3), the age adjusted prevalence of hypertension in obese men and women was 42% and 38% respectively. These prevalence rates are twice as high as prevalence rates in hypertension in lean men and women. The risk of coronary heart disease (CHD) is increased in obese persons, particularly in those with increased abdominal fat distribution and in those who gained weight during young adulthood. Moreover, CHD starts to increase at the normal BMI levels of 23 kg/m2 in men and 22 kg/m2 in women.18 The objective of study was to evaluate left ventricular dimensions and functions in patients with obesity and to find correlation between left Ventricular dimensions and functions with grades of obesity.
METHODS
The present study was a hospital based study conducted in the Postgraduate Department of Internal Medicine, SMHS Hospital of Government Medical College Srinagar and SKIMS Kashmir. A total of 100 subjects of either gender across a spectrum of body mass were taken up for this study. Among these 18 subjects were taken as Age matched normal weight controls. Patients were excluded if they had hypertension, diabetes mellitus, structural heart disease including heart failure, congenital heart diseases and/or had undergone any cardiovascular procedures or coronary artery diseases (CAD), Pregnancy, smoking / ex-smoker > 5 years, major systemic disease (e.g. cancer, lupus) and any vaso-active medication intake. This study is a cross-sectional study wherein all information was recorded in a single contact and there was no follow-up in the study. On inclusion in the study following details were obtained and recorded viz demographic details of name, age and sex, anthropometric measurements like weight (kg), height (m), BMI [weight (kg) / height (m2)], waist circumference (cm), hip circumference (cm) and waist hip ratio (WHR), Lipid profile (fasting), electrocardiogram (ECG), chest X-ray, blood chemistry and electrolytes. Fat mass percentage by Bioelectrical impedance analysis (BIA) by body fat monitor model HBF -306, fasting plasma glucose and insulin levels and calculation of Homeostatic model assessment of insulin resistance (HOMA-IR.) Plasma insulin level was measured by AxSYM Insulin assay which is a Microparticle enzyme immunoassay (MEIA) for quantatively measurement of human insulin in human serum and plasma,
All selective subjects underwent a complete transthoracic
two-dimensional and Doppler echocardiographic
examination with echo-cardiographic equipment Power-Vision 8000 (Toshiba Japan). Subjects were examined in left lateral decubitus position and images were obtained in the standard tomographic views of left ventricle (parasternal long - and short axis and apical 4-chamber, 2-chamber, and long axis view). Left ventricular (LV) diameter and wall thickness were measured from the two-dimensional targeted M-mode echocardiographic tracings in the parasternal long axis. Left ventricular end diastolic volume (LVEDV), left ventricular end systolic volume (LVESV) and left ventricular ejection fraction (LVEF) at rest were computed from 2- and 4-chamber views, using a modified Simpson’s biplane method. Standard two and four chamber apical views were used to interrogate the mitral inflow velocities, peak early diastolic velocity in m/s (E), peak late diastolic velocity m/s (A), E/A ratio, isovolumic relaxation time (IVRT) and deceleration time (DT) in seconds were measured by using pulsed-wave Doppler for determination of various indices of diastolic function. All the recordings and measurements were obtained by the same observer and each representative value was obtained from the average of three measurements according to the recommendations of American Society of Echocardiography. The recording measurements were always performed at midway to avoid the influence of circadian rhythm on the left ventricular diastolic function. Echocardiographic variables were left ventricular end systolic dimensions (LVESD), left ventricular end diastolic dimensions (LVEDD), left ventricular end systolic volume (LVESV), left ventricular end diastolic volume (LVEDV), left ventricular posterior
wall diastolic thickness (LVPwd), interventricular septal wall diastolic thickness (IVSwd), ejection fraction (EF), fractional shortening (FS), E velocity, A velocity, E/A ratio, isovolumic relaxation time (IVRT) and deceleration time (DT).
Patients were categorized into 4 groups as per WHO criteria of BMI for Asian Indians.
Table 2: Categorization was also done as per fat mass percentage.19
Males Females
Under Fat < 10% < 20%
Normal fat 10-20% 20-30%
Slight high fat 20-25% 30-35%
High fat > 25% > 35%
RESULTS
This study was conducted in the Postgraduate Department of Internal Medicine, SMHS Hospital Srinagar Kashmir. A total of 100 subjects were included in our study and among these 18 subjects were taken as age matched normal weight controls. The age of our study population ranged from 21 years to 67 years with the mean age being 44.7±11 years. The maximum number of subjects were seen in the age group of 40-59 years (57%). Females (56%) were more than males (44%). The subjects were categorized into four groups which include normal BMI (18%) overweight (32%), obese I (31%) and obese II (19%). The mean BMI of our subjects was 26.8±0.3kg/m2 (Table 3).
Table 3: Demographic and anthropometric details of study population.
Normal (BMI=18-22.9) (n=18)
Overweight (BMI = 23-24.9) (n = 32)
Obese I (BMI=25– 29.9) (n = 31)
Obese II (BMI = > 30) (n = 19)
P value and statistical significance
Age (Years) 46+8 44+10 49+11 41+10 P > 0.05
Gender (M/F) 8 / 10 12/20 15/16 9/10 P >0.05
Weight (kg) 52 + 10 60+10 67+12 76+9 P < 0.05
Height (m) 1.57 + 0.08 1.56+0.08 1.54+0.09 1.56+0.07 P > 0.05
BMI 21 + 1.8 24+0.8 27+2 32+1.9 P < 0.05
WHR (Waist-Hip Ratio)
males 0.79+0.07 0.91+0.04 0.93+0.06 0.95+0.10 P<0.05
WHR Females 0.78+0.06 0.90+0.06 0.94+0.08 0.96+0.14 p< 0.05
Weight and waist-hip ratio (WHR) shows an increasing trend with increase in grades of obesity (Table 3) and it was statistically significant (p < 0.05). There was increasing trend in triglycerides levels with increase in BMI, which is statistically significant (p < 0.05). While as
HDL-cholesterol had a decreasing trend with increasing grades of obesity. Fasting plasma insulin and HOMA-IR show a significant (p < 0.05) differences in values between overweight and obese II group. Insulin level not available in normal subjects. As BMI increased fasting plasma insulin and HOMA-IR also increased.
LV Morphological parameters
Normal n =18
Overweight n =32
Obese I n =31
Obese II n =19
Statistical significancep value and pearson’s correlation. coefficient
LVESD (cm) 2.81+0.41 2.88+0.44 3.02+0.53 3.31+0.62 p >0.05, r =0.251
LVEDD (cm) 4.70+0.49 4.76+0.45 4.83+0.53 4.92+0.44 p > 0.05, r =0.264
LVESV (ml) 32+7 39+9 41+8 58+10 p < 0.05, r =0.603
LVEDV (ml) 92+9 104+12 108+10 129+12 p < 0.05, r =0.709
LV pw [d] (cm) 0.80+0.07 0.94+0.15 0.99+0.12 1.04+0.12 p < 0.05, r =0.624
IVS [d] (cm) 0.82+0.10 0.97+0.11 0.98+0.14 1.09+0.12 p < 0.05, r =0.623
Table 5. Left ventricular (LV) systolic function parameters.
LV Systolic function parameters
Normal n =18
Overweight n =32
Obese I n =31
Obese II n =19
Statistical significancep value and pearson’s correlation coefficient
EF (%) 65+9 67+8 68+7 67+6 p > 0.05, r =0.143
FS (%) 36+7.0 36.2+7.6 37.5+5.9 35.8+6.4 p > 0.05, r =0.204
Table 6: Left ventricular diastolic function parameters.
LV Diastolic function parameters
Normal n =18
Overweight n =32
Obese I n =31
Obese II n =19
Statistical significancep value and pearson’s correlation coefficient
E (m/s) 0.73+0.12 0.74+0.12 0.77+0.14 0.75+0.12 p > 0.05, r =0.203
A (m/s) 0.52+0.08 0.54+0.1 0.59+0.12 0.6I+0.12 p > 0.05, r =0.308
E/A ratio 1.43+0.32 1.42+0.41 1.41+0.41 1.38+0.42 p> 0.05, r = -0.681
IVRT (sec) 80+15 90+17 93+16 98+18 p < 0.05, r =0.643
DTE (m sec) 180+12 190+14 224+30 256+30 p < 0.05, r=0.623
Table 7: LV function vis-à-vis grades of obesity.
Normal BMI Overweight Obese I Obese II Total
Normal LV
functions 18 (100) 28 (87.5) 20 (64.5) 10 (52.6) 76
Systolic abnormality 0 (0.0) 0 (0.0) 0 (0.0) 0 (0.0) 0
Diastolic
abnormality 0 (0.0) 4 (12.5) 11 (35.5) 9 (47.4) 24
Both 0 (0.0) 0 (0.0) 0 (0.0) 0 (0.0) 0
Total 18 (100) 32 (100) 31 (100) 19 (100) 100
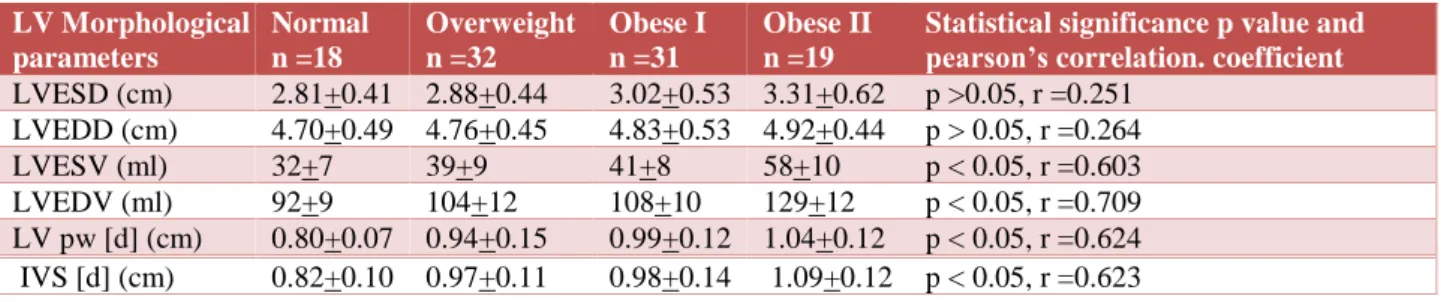
While evaluating left ventricular morphological indices vis-à-vis grades of obesity (Table 4), all the parameters like left ventricular end systolic volume (LVESV), left ventricular end-diastolic volume (LVESD), left ventricular end diastolic posterior wall thickness [LVPw(d)], intraventricular end-diastolic septal wall thickness (IVS) show an upward trend with grades of obesity (positive correlation)which was statistically significant (p < 0.05) except LVEDD (Left ventricular end-diastolic diameter) and LVESD (Left ventricular end systolic diameter).
There was no significant change in left ventricular systolic functions (Table 5). Ejection fraction is slightly increased in initial grades of obesity which is statistically insignificant (p > 0.05) while as Fractional shortening remains almost same.
A significant prolongation of IVRT has been observed in our study subjects (Table 6), with a pronounced difference between obese II and overweight subjects (98±17 versus 84±15 respectively). Changes have also been seen in E and A, but the values did not differ across spectrum of obesity(p>0.05). E/A showed a downward trend but not statistically significant. DTE (deceleration time) was found to be more with increased grades of obesity (256±30 in obese II versus 190±14 in overweight (p<0.05).
DISCUSSION
The age of our study population ranged from 21 years to 67 years with the mean age being 44.7±11 years. Morricone et al20 reported a mean age of 38 years, 37 years and 43.2 years respectively in his study. The maximum number of subjects were seen in the age group of 40-59 years (57%). The average fat mass percentage of our study population was 28.5±4.8 and an increasing trend has been noticed with increasing grades of obesity. A similar trend was observed by Wong et al in his study.21 Elevate triglyceride levels with decreased HDL levels were found in obese II group subjects as compared to overweight and obese I group subjects. The increase in triglyceride levels and decrease in the HDL levels with increase in BMI was also found by other workers like Valverdie MA, Brain CD et al in their study.22,23 No significant change was found in total cholesterol, LDL cholesterol, or VLDL-cholesterol with increase in BMI. An upward trend in fasting insulin levels was found with increase in BMI (19±10 in obese II versus 6±2.5 in overweight) in our subjects. Wong et al had also observed an increasing trend in insulin levels with increase in grades of obesity.21 Fasting plasma glucose levels were within normal range in all the study subjects. HOMA-IR shows positive relation with BMI, with increase in BMI, HOMA-IR also increases. The relation was statistically significant (p<0.05). Zhu L et al, showed almost matching results in his study.24
The echocardiographic evaluation of our subjects revealed a positive correlation between BMI and LV volumes, thickness. The relation was statistically significant (p<0.005). The LVEDD and LVESD showed an increased trend with grades of obesity. Early grades of obesity showed increased in the LV ejection fraction however this was not statistically significant(p>0.05) There was no significant change in fractional shortening with grades of obesity, Wong et al, and Pascual M et al, also showed similar results in their studies.21,25 A significant prolongation of IVRT has been observed in our study subjects, with a pronounced difference between obese II
and overweight subjects (98±17 versus 84±15
respectively). Changes have also been seen in E and A, but the values did not differ across spectrum of obesity (p>0.05). E/A showed a downward trend but not statistically significant. DT (deceleration time) was found to be more with increased grades of obesity (256±30 in obese II versus 190±14 in overweight (p<0.05) These results are consistent with observations of other workers like Pascual M, and Brain d powell.25,26
Echocardiographically it was seen that, in our study population no one fulfilled the criteria of LV systolic function abnormality while as LV diastolic function abnormality has been noted in all grades of obesity and correlated with BMI. Diastolic abnormality was found in 24% of the subjects.
Our observations are very much in confirmation with the results of other workers like Pauscal MA et al, Cheiw Y, Wong, Powell BD.21,25,26 In the prevalence assessment subclinical diastolic dysfunction was significantly more prevalent in obese II than overweight (47% versus 12.5% p<0.05). Similar were the results obtained from the study of Pascual M, and Powell BD.21,26
Our study links obesity, insulin levels and fat mass with myocardial disturbances. A number of mechanisms have been postulated for their disturbances. First, Adipose tissue has the ability to act as an endocrine organ. The bioactivity of rennin - angiotensin system (RAS) both systemically and within adipose tissue is elevated in obesity, and reduced after weight loss.27,28 Angiotensin II is a potent growth factor for cardiac myocytes, is proinflammatory and is associated with cell proliferation, hypertrophy, apoptosis and fibrosis. It also plays an important role in LV remodeling and LV hypertrophy.29
This study demonstrates some correlation of LV systolic and diastolic measures to fasting insulin levels. It has been proposed that insulin may exercise its influence on cardiac geometry due to its growth stimulating, sodium retention and other neuroendocrine effects. It has also been suggested that insulin resistance can affect the biochemical mechanisms during diastolic relaxation by impairing the inactivation of myocardial actin - myosin cross links attributable to a lack of ca2+ re-uptake from sarcoplasmic-reticulum.30 In our study fasting insulin level is related to IVRT and weekly to E / A suggesting a greater action of insulin on LV relaxation than LV filling parameters.
Limitations of this study was a single center study with limited sample size, therefore these results require further validation from larger prospective studies. Furthermore, newer and more accurate echo parameters of left ventricular functions (systolic/diastolic) could have been applied.
CONCLUSION
With increasing grades of obesity and increase in fat mass percentage, both LV dimensions and volumes were increased and subclinical LV diastolic dysfunction was present in all grades of obesity. Diastolic abnormalities were more prevalent in subjects with higher grades of obesity. Our study provides justification for the idea of obesity as a therapeutic target in prevention of increased prevalence of cardiovascular diseases. Several studies have shown that LV structure and diastolic function are improved after weight loss in obese patients.
ACKNOWLEDGEMENTS
Authors would like to acknowledge to patients without whom this research work could not have been possible.
Conflict of interest: None declared
Ethical approval: The study was approved by the institutional ethics committee
REFERENCES
1. WHO- Obesity preventing and managing global
epidemic: report of a WHO consultation on obesity. Geneva 3-5 June 1997, Geneva WHO; 1998.
2. WHO/IOAF/IASO/2000; Asia pacific- perspective
Redefining obesity and its treatment. Hong kong WHO. International obesity task force. International association for obesity; 2000.
3. Ko GTC, Chan JC, Cockran CS and Woo J.
Prediction of hypertension, diabetes, dyslipidemia, or albuminuria using simple anthropometric indexes in Hong Kong Chinese. Int J Obesity. 1999;23:1136-42.
4. Deurenberg P, Deurenberg-Yap M, Wang J, Lin FP,
Schmidt G. The impact of body builds on the relationship between body mass index and body fat percent. Int J Obesity. 1999;23:537-42.
5. Wang J, Thornton JC, Russell M, Burastero S,
Heymsfield SB, Pierson RN. Asians have lower BMI but higher percent body fat than do Whites: comparisons of anthropometric measurements. Am J Clin Nutrit. 1994;60:23-8.
6. Isselbacher KJ, Braunwald E, Wilson JD, Martin JB,
Fauci AS, Kasper DL. Harrison's principles of internal medicine. Shock. 1996;5(1):78.
7. WHO- Global Strategy Diet and Physical Activity, 2009. Available at www.whoint/dietphysicalactivity.
8. Gopinath N, Chadha SL, Jain P, Shekhawat S,
Tandor R. An epidemiological study of obesity in adults in the urban population of Delhi. J Assoc Physicians India. 1994;42:212-5.
9. Mohan, Deepa. Obesity and abdominal obesity in
Asian Indian. Ind J Med Res. 2006;123:593-6.
10. Zargar AH, Masoodi SR, Laway BA. Prevalence of
obesity in adults - an epidemiological study from Kashmir valley of Indian subcontinent. JAPI. 2000;48:1170-4.
11. Alexander JK. Obesity and heart: Heart Disease Stroke. 1993;2:307-21.
12. de Simone G, Deverex RB, Roman MJ. Relation of
obesity and gender to left ventricular hypertrophy in normotensive and hypertensive adults. Hypertension 1994;23:600-6.
13. De Simone G, Devereux RB, Roman MJ. Influence
of obesity on left ventricular mid wall in arterial hypertension. Hypertension. 1996;28:276-83.
14. Fisher M, Baessler A, Hense HW. Prevalence of left
ventricular diastolic dysfunction in community. Results from a Doppler echocardiographic based survey of a population sample. Eur Heart J. 2003;24:320-28.
15. Harris MI, Flegal KM, Cowie CC. Prevalence of diabetes impaired fasting glucose, and impaired glucose tolerance in U.S. adults. The Third National Health and Nutrition Examination Survey, 1998-1994. Diabetes Care. 1998;21:518-24.
16. Tery RB, Wood PD, Haskue WL. Regional
adioposity pattern in relation to lipids lipoproteins, cholesterol and lipoprotein subfraction mass in men. J Clin Endocrinol Metab. 1989;68:191-9.
17. Hubert HB, Feinleib M, McNamara PM, Castelli
WP. Obesity is an independent risk factor for cardiovascular disease - 26th year follow-up of participants in Framingham Heart Study. Circulation. 1983;67:968-77.
18. Stamler J, Wentworth D, Neaton JD. Is relationship
between serum cholesterol and risk of premature death from coronary disease continuous or guided? Findings in 356222 primary screenees of multiple risk factors. Intervention Trial (MRFIT). JAMA. 1986;256:2823-8.
19. Singh RB, Niaz MA, Beegom R. Body fat percent by
bioelectrical impedance analysis and risk of coronary artery disease among urban men with low rates of obesity: The Indian Paradox. J Am Coll Nutrition. 1999;3:268-73.
20. Morricone L, Malavazos AC, Coman C.
Echocardiographic abnoramltieis in normotensive obese patients, relationship with visceral fat. Obes Res. 2002;10:489-98.
21. Wong CY, Moore TO, Leano SR. Alteration of LV
myocardial characteristics associated with obesity. Circulation. 2004;110:3081-7.
22. Brain CD, Higgins M, Donatto KA. Body mass index
and the prevalence of hypertension and dyslipidemia Obes Res. 2000;8;605-19.
23. Zhu L, Liu K. The impact of adiposity and insulin resistance on endothelial function in middle aged subjects. Int J Cardiovascular Res. 2002;1(1). 24. Valverde MA, Vitolo MR, Patin RV. Changes in
lipid profile in obese children and adolescents.
Archivos Latinamericanos de Nutrition.
1999;49(4):338-43.
25. Pascual M, Pascual DA, Soria F. Effect of isolated obesity on systolic and diastolic left ventricular function. Heart. 2003;89:1152-6.
26. Brain, Powel D, Redfield MM. Association of
obesity with LV Remodelling and diastolic dysfunction in patients without coronary artery disease. American J Cardiol VDL. 2006;98(1):116-20.
27. Van Harmelen V, Ariapart P, Hoffstedt J. Increased
adipose angiotensinogen gene expression in human obesity. Obes Res. 2002;8:337-41.
28. Harp JB, Henry SA, DiGirolamo M. Dietary weight
loss decreases serum angiotensin-converting enzyme activity in obese adults. Obes Res. 2002;10:985-90.
29. Ruiz-Ortega M, Lorenzo O, Ruperez M. Systemic
infusion of angiotensin II into normal rats activates nuclear factor-kappaB and AP-1 in the kidney: role of AT(1) and AT(2) receptors. Am J Pathol. 2001;158:1743-56.
30. Jain A, Avendano G, Dharamsey S. Left ventricular