Hungarian Association of Agricultural Informatics European Federation for Information Technology in Agriculture, Food and the Environment
Journal of Agricultural Informatics. Vol. 8, No. 2 journal.magisz.org
Development and testing experiences of a management supporting data
acquisition system
Mihály Tóth1, Róbert Szilágyi2
I N F O
Received 8 Jun 2017 Accepted 20 Jul 2017 Available on-line 14 Aug 2017 Responsible Editor: M. Herdon
Keywords:
data acquisition, sensor network, IoT, modular system
A B S T R A CT
The growing food demand and decreasing size of the rural areas require striving for optimal results of production. To achieve this, we can use decision support systems. The critical point of the application is the availability of proper quantity and quality data set. The data source can be developed using a statistical database, using a database created by conventional management application and the measurement databases, created by data acquisition systems. The use of this systems can be helpful, if constant data is required about measurable factors which can influence the result directly or indirectly. As the result of this paper, a modular data acquisition system is developed, which consists of six modules, including the control module, user interface module, sensor modules, external device controller module, communication module and wireless module. The modular system is considered to maintain cost effectivity and response to the application needs. To support the mentioned system, a desktop application, a web application, and a measurement database is also developed. The desktop application is able to manage the system and provide data query or visualized data. The test of the system is performed in a small greenhouse environment. The experience, gained during this test helped to form further development opportunities.
1.
Introduction
If we analyze a process, we’ll most likely meet with junctions in an algorithmic sense during the implementation. In this case, to achieve the optimal advancement and result, decision-making is required. The availability of the data, influencing the result directly or indirectly are playing an important role in assisting of the decision-making process. The data can be used from multiple data sources, like a statistical database, a database created with conventional management applications and collected by data acquisition systems. In this paper, we will address the opportunities provided by the mentioned systems in conjunction with the third option. The goal is to meet the data requirements of the management and to provide data continuously for automated in-system decisions. The data acquisition is accomplished by a sensor network and IoT (Internet of Things) devices. A sensor network on a conceptual level is an established connection and data transfer between autonomous data acquisition systems, while the IoT gives additional task to the individual devices on the network. The IoT conception includes addition to the sensor network related to the applications. These can be used by the user to analyze the dataset. In this paper, we will present a data acquisition system which is specialized for agricultural processes. Because of the modular design, the device can be specialized to meet most application requirements.
2.
Literature Review
In the literature review the first topic to examine is about sensor networks and IoT devices, which cover the presentation of technical developments and practical applications. After that, we continue the
1Mihály Tóth
University of Debrecen
[email protected] 2 Róbert Szilágyi
University of Debrecen
compilation with complex data acquisition and automation systems for agricultural processes according to the topic of the paper.
IoT and sensor networks
Like in many cases, the sensor networks were first used by military. During the event of Distributes Sensor Nets Workshop in 1978, organized by DARPA, they searched the solution to challenges like networking, signal processing techniques and distributed algorithms. The collaboration between Rockwell Science Center and University of California has introduced early concepts for wireless integrated sensor networks (WINS).One of the most significant results of the project was the LWIM data collection system, which was completed in 1996, containing several sensors, interfaces, digital signal processors, radio controllers and microcontrollers within an integrated circuit (Dargie-Poellabauer, 2010). In addition to it, the basics of the IoT concept were also outlined, which was then referred to as small computers that would have a network connection (Thysen, 2000). It is a great advantage that they will be able to remotely monitor the processes without the physical presence of the examiner (Gurovich - Saggé, 2005).
To coordinate the further development, basic criteria have been determined, which include energy saving, coverage, diversity of connection options, scalability, expandability and security (Oteafy – Hassnein, 2014). To achieve the scalability, a radical method was used. The specialized networking protocols and increased computing power led to the development of multi-hop architecture next to the single-hop architecture, which represents a progress in terms of scalability, operating range and parallel computing (Mittag et al., 2009). In the case of a multi-hop architecture, the elements of two systems may meet and overlap each other's measuring ranges. Because they are active devices, they are able to detect each other's presence, and in a unified protocol, they can provide useful tasks such as cluster routing, node localization, or time synchronization (Youssef et al., 2009). The connection options can be associated with data transfer and data protocol. The former can usually be described by standards, which may be 802.11, 802.15.1 and 802.15.4 depending on the IEEE standard. Their range is able to cover from 10 meters to 100 meters as well as their operating time, ranging from minutes to years. The 802.15.4 standard, called ZigBee, was specialized mainly for sensor networks. The applied frequency varies between 868 MHz, 915 MHz and 2,4 GHz (Soharby et al., 2007).
Sensor network communication mechanisms can be divided into layers, like traditional networks. The difference is that in our case, we can describe the entire structure with a three-dimensional cubicle. One dimension describes the management protocols, while the other describes the communication protocols. The former includes power management, mobility and task management functions, while the latter consists of communication, transport, network, data connection, and physical layers from up to bottom (Soharby et al., 2007). Of course, this is a formal definition, some of which can be altered to achieve the suitable result. The network layer has an important function of routing. Because a sensor network contains more individual systems, it is necessary to optimize the connection to achieve secure operation and share computing load. The routing protocols can be sorted to chain and tree structure (Mohemed et al., 2016).
The ideas about sensor network and IoT devices are questioning the usability of TCP/IP protocol, therefore urging the use of the Information Centric Networking (ICT), which could replace the current host-centric thinking. At present, there is no standard protocol that would be widely used in communication between the devices. They also outline the idea of synergies between networks. At present, there is no standard protocol that would by widely used in communication between devices. In this case, the protocol is a unified language which can be interpreted by all devices on the network. Our opinion is, that the technology will become complete, when all device can transfer data with the another, thus extending the measuring range (Oteafy – Hassnein, 2014).
Data acquisition in agriculture
process-related data (Dener - Bosanciogu, 2015). Various tools and procedures allow us to perform operations such as yield monitoring, yield mapping, locally variable nutrient application and plant protection, topography, salt content mapping, or using self-controlled systems (Dargie-Poellabauer, 2010). Data collection systems for agricultural processes need to meet several specific criteria, such as the measurement of major parameters of weather, plant and soil, the control of diversified field, the differentiation and consideration of the diversity of crops in the examined area, the provision of unequal nutrient and liquid retention based of measured values, to consider the different needs of plants and to use a forward-looking approach instead of reactive thinking (Rehman et al., 2011).
Among the wide range of application areas, we would like to describe some practical applications with a few examples. The main purpose of the systems in the field is to optimize the processes of irrigation, nutrient replenishment, pest control, and gardening applications by data collection (Rehman et al., 2014). In field applications, we distinguish mobile and fixed solutions. The foregoing can be, for example, the use of a sensor network with a farm machinery or with a separate robot. A good example of a farm machinery is an experiment to transform the mechanics, hydraulics and electronics of a compact tractor. This allows the machine to operate autonomously. In addition, a self-control sprayer with multiple reservoirs was also developed to carry out local plant protection (Gonzalez-de-Sotoa et al., 2015). Beside the conversation of conventional equipment, we can find custom-built, self-propelled systems that are usually developed in form of data collector robots. Their range of applications can be measured on a wide scale depending on the sensors they are using and controlled devices. For similar devices, automated control and location change is almost a basic requirement, complemented by data collection and control functions. There are also several possibilities for fixed sensor networks. In animal husbandry, we encountered with them most commonly in cattle farms to investigate the behavior and productivity of the animals and to determine the chances of developing certain diseases such as mastitis (Chen et al., 2014). Using a Japanese development, it is possible to detect cattle estrus. The device is basically a mobile sensor network. The conventional method needs the presence of a trained person, while using the probe to measure conductance, temperature, and motion allow the determine estrus in a simple way. In order to achieve the correct result, patterns were determined using reference data, which can be compared with the current data to perceive estrus. Creating a pattern helps reduce noise caused by data distortion. To measure and digitize the resistance, KS103J2 thermometer and an Analog Devices ADXL362 accelerometer, was integrated into a specialized printed circuit (Andersson et al., 2016). Using a simple device, we are able to detect lameness, which is useful in case of large livestock. During an experiment, four strain gauge sensors were incorporated into the base of the milking machine, which used to measure typical behavior during milking. Unique identification was achieved using RFID enabled ear tags. The measurements were done at a frequency of 200 Hz and included the weight of the legs and the number of kicks. Measurements can be used to identify the injury and the need for action efficiently and quickly (Pastell et al., 2008).
Greenhouses, as explained in more detail below, are a very good test option for similar systems through the closed design. In the case of a greenhouse control experiment, because of the closed system both external and internal data should be measured. This includes temperature, humidity, luminous intensity, wind speed and wind direction. Using inputs, we have the option of controlling external systems, thus maintaining the appropriate environmental parameters for cultivation. To accomplish this experiment, the authors used CY3271 wireless module (Chaudhary et al., 2011). The applied sensors and controllers have a significant influence on functionality, so they could expand the presentation with the possibilities outlined by another experiment. The experiment demonstrates the main factors that need to be supervised and controlled in a greenhouse to achieve the optimal environment and the right result. Factors can be divided into four main categories, including interfering factors, control variables and controlled variables. Disturbing factors include external temperature, external radiation, wind speed, wind direction, humidity, external CO2 concentration, temperature, temperature of the enclosure,
temperature of the plant and the surface temperature of the soil. Control variables, influencing environmental parameters include ventilation, heating, shading, fogging and CO2 injection. By these
factors, they create controlled variables such as air temperature, photosynthetic active radiation, CO2
concentration and humidity (Sagrado et al., 2015). As the number of sensors increases, there is a need for spatial data collection and additional information about its usage. In an experiment related to this, temperature and humidity data were measured at several points in a greenhouse, examining its spatial distribution and change. Using the data, a decision support system was created, which is able to determine the ventilation requirement by taking into account the spatial data. The main purpose of the development was to achieve integrated pest control. The system used the relationship between pest spreading and climatic conditions. The spatial data collection distinguishes the upper and lower vegetation in vertical directions, at which point the temperature and humidity data are shown to be significant. The decision support system attempted to determine the nature of the intervention so that the expected result would provide adequate climatic parameters for the entire area of the greenhouse (Aiello et al., 2017). In connection with automated irrigation, it is worth mentioning an experiment in which the connection between the data, provided by the sensor network and the irrigation control has been supplemented by a neural network. During the experiment, a measuring sensor network was developed, capable of collecting data on growth activity and environmental parameters, a decision support mechanism capable of reconciling the measurement data with commands for control and a machine learning process that precisely determines the current state of the plant. In addition, a set of tools has been developed to facilitate application and visualization of measurements. The hardware is a modular, purpose-built design. The applied sensors include soil moisture and temperature sensors (Goumopoulos et al., 2014).
Big Data
Once we have the data set provided by the measurements, it is clear that we need to obtain information that is available using the system. The Big Data concept has been previously identified by data mining, which is a method to use mathematical algorithms, to extract commercially useful information from the data set. The data sets generated by mobile technology and the social media grew larger until finally the conventional methods could not handle the data volume. At that time, the application of the methods collected under the Big Data concept became essential. The relational databases that have been helping business processes are combined with radical NoSQL open source hybrid database solutions. In addition, they are able to pass user-defined filtering of large data sets by high computing power through cloud computing technologies. The aggregate results of the process and the technological innovation are called Big Data (Manoochehri, 2014).
There may be a question about what Big Data can perform. We have tried again to orientate the direction to agricultural processes, based on this we are examining several areas. Continuous uncertainty, inadequate knowledge of biological systems, and randomization of processes make it difficult to make decision-making in agriculture, which can be enhanced with the provided information obtained from measured data (Thysen, 2000). In case of crop production, sensors and controllers have been discussed, but the data collected using them does not provide specific information to the user. The concept of Big Data will be complete when the data receives from several sources and can be aggregated, then forwarded to multiple users. The data source comes not just from a user, but also from the service providers. Due to the diversity of resources, data integration is important for building relationships between systems. Applications for data analysis include FieldView Pro, Encirca Yield Nitrogen Management, R7 Tool and Simplot Smart Farm, which are specifically designed to assist crop production (Dyer, 2015).
Big Data is available in the form of service because of the data requirements and the required computing power. These include the use of software as a service (SaaS), the use of infrastructure as a service (IaaS), the use of platform as a service (PaaS) and the use of data as a service (DaaS). In case of application of the data, their storage can be performed in private clouds, public clouds, and hybrid clouds (Kevorchian - Gavrilescu, 2015). All services are able to measure and manage risk factors on a different level and in a manner, the used method always depends on the particular situation.
Another question beyond the analysis could be the visualization of the data. The data sets created by the systems are difficult to interpret, and the analysis of the patterns, differences and similarities can not be achieved efficiently without visualization. An effective solution would be to create a coherent framework that allows to display location and time-specific data. The main components of the system is under consideration, which include a heterogeneous sensor network, optimized for agricultural purposes, a standardized communication infrastructure between sensor controllers, an internet application, a web based geoinformation infrastructure, cartographic display rules, associated modeling tools, and agricultural knowledge base and data warehouse (Kubicek et al., 2013).
3.
Material and Methods
mentioned microcontrollers are also used by Arduino developer boards (Mega and Due), which were useful during the first tests, since they can also be programmed using the mentioned developer environment by interfacing a software. The sensors, used during the experiments were purchased earlier, before designing the experiment. The main goal was to design a modular system with interchangeable sensors, which implies that the data types which the connected sensors can provide are irrelevant. During the experiment, several sensors were used, including the DHT22 temperature and humidity sensor, BMP085 barometric and temperature sensor, and for analogue measurements a photocell, soil moisture sensor and rain sensor.
4.
Results
As result, a modular data acquisition system and its software environment was developed. The designing process required the development of both hardware and software. The system can be separated into two main parts. The first part is the data acquisition system which consists of six hardware modules and the six applications, used by the mentioned hardware. The second part is located on the host computer and optionally on the server, which contains the desktop management application, the web application, including the user interface and the data interface. This part also includes the measurement database which used to establish connection between the mentioned systems. During the designing process, we have considered the earlier experience and the construction of similar systems can be found in the literature. Accordingly, the most important goal was to develop modular design which can be specialized based on expectations and can be repaired effectively if necessary, thus allowing us to reduce the cost and time. The design allows in addition parallel operation execution which allows to the system faster operation execution, what leads to make more measurements almost simultaneously.
Hardware developing
The hardware is a permanent structure, based on this, great attention should be paid during the designing process, because an issue can be lead to the redesign and remanufacturing of the whole system. At first, we must specify the functions, because the system must perform to achieve the specified goal. Thereafter groups must be formed based on the functions which can be performed parallel without data dependency. During the process, economic aspects should be considered, because an underused, over engineered module leads to significant additional costs while building a large system.
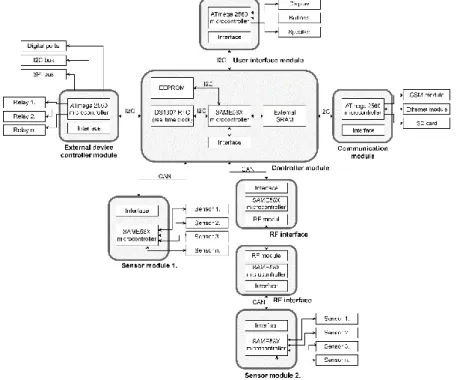
The current system consists of six modules (Figure 1.). The control module is located at the top level of the hierarchy with the task of the managing and scheduling of the subsystems, establishing the communication and translating the data protocol. Additional tasks include the storing of the settings and the system time. The user interface module, as the name indicates, establishes the connection between the user and the system, using the interface, which contains a graphical display, buttons, indicator LED-s and a piezo LED-speaker. The uLED-ser uLED-sually meetLED-s with thiLED-s interface while managing and uLED-sing the LED-syLED-stem. The sensor modules are performing the control and measurement using the connected sensors, launched by the control module with a specified instruction. The communication module performs the forwarding of the measurement data and the errors using Ethernet or GSM (GPRS) connection, also provides an opportunity to save the data to an SD card. The external device controller module has a task of controlling external devices located outside of the system, using relays and digital IO ports. The wireless modules can be used to establish a connection between the controller module and a sensor module using a transceiver with 2,4 GHz frequency, without the need of reprogramming.
Every module consists of a separate hardware construction, therefore the complexity of the individual modules is moderate. The PCB used by the modules was designed using Autodesk Eagle PCB software. The control module and the sensor modules uses an Atmel SAM3X8E, based on ARM architecture, while the further modules use an Atmel ATmega 2560 based on AVR architecture. The control module and the sensor modules are connected using CAN connection, which provides secure connection and the opportunity to use daisy chain connectivity. The further modules are connected to the control module using I2C (Inter-Integrated Circuit) interface. The microcontroller, based on ARM architecture was considered because of the internal CAN controller and greater computing power, while the microcontroller uses the AVR architecture turned out as a cost-effective solution to perform sub-functions with lower calculation needs.
The controller module uses unified connection interface (Figure 2.) to connect the further modules to the system. The RJ-45 socket and the used UTP cable provides an 8-wire connection which is sufficient for the task to be provided, including power and data wires. The used pinout is influenced by the existing PoE (Power over Ethernet) standards. The connection interface includes the CAN and I2C lanes to provide all the accessible connection methods for the system.
Figure 2. The connector used by the modules (Own source)
The controller module contains in addition to the SAM3X8E microcontroller, a DS1307 real time clock, an Atmel AT24C64 EEPROM with a capacity of 64 Kbyte and other components that support the proper operation. The power supply is located on the controller module as well which can supply 5V and 3.3V operating voltage. The main interface located on the controller module contains a level shifter in addition to the mentioned RJ-45 connectors. To establish the connection between the ARM and AVR architecture microcontroller, there is a need for level shifting. The microcontroller using AVR architecture uses 5V, while the microcontroller using ARM architecture uses 3.3V logic voltage, accordingly a bidirectional level shifter was used. For the proper feedback about the module status, three LED was used in green, yellow and red color, which can indicate normal, measuring, and error status.
mentioned earlier. The communication module uses a ATmega 2560 microcontroller in addition to a Ethernet and a SIM 900 GSM controllers. An SD card slot is also provided with the use of a level shifter.
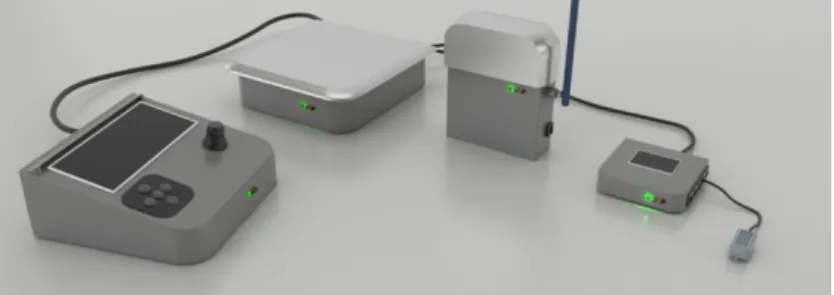
Figure 3. Visualization of the modules (Own source)
The enclosures are designed with an 3D application considering the PCB size, connectivity and limited weather resistance, which varies depending on the module (Figure 3.). The current version uses simple electrical enclosures, but the designed version would be 3D printed in the presence of an appropriate device to realize them.
Software developing
During the development of the software running on the modules, we tried to achieve mobility, which allows to reuse specified parts of the software while running it on a microcontroller with the same architecture. Accordingly, three levels of software layer were defined, which are the base software, located on the lowest layer, the device specific software on the middle layer, while the task specific software is located on the highest level. The base software allows to control the base functions of the microcontroller. The device specific software helps us to utilize the sensors and accessories, connected to the systems via special protocols. The task specific software describes the working algorithm with the use of the lower level software, mentioned before.
The software can be described most efficient with the simplified algorithm used by the controller module. The first step after the start-up is to initialize the system. As the second step, a test measure is carried out sequentially by the sensor modules, started by the control module. After the initialization process, the system enters to a measurement cycle which repeats after the specified sample time. The measured data is forwarded to the communication module, which uploads the data to the database and saves it to the connected SD card. At last, the data is forwarded to the external controller module, which compare the measurement with the specified and demanded interval. If difference is detected, the external device controller module can control devices using digital IO ports and relays to maintain the optimal condition.
Database
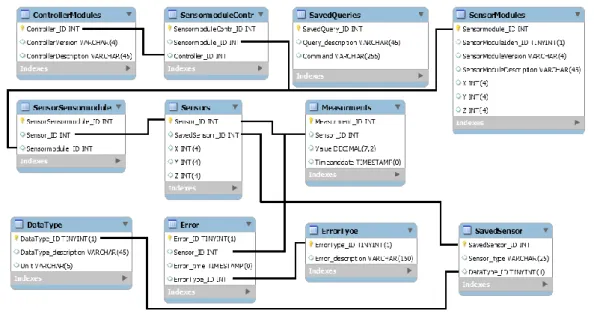
Figure 3. Database structure (Own source)
After the normalization, the database is consisting of 11 tables. The “ControllerModules” table, “SensorModules” table and the “Sensors” table are connected via switchboards. We can see, that the “SensorModules” and “Sensors” table contain X, Y and Z attribute as well, representing a location data, which can be used for 3D data visualization, location based slicing and data queries. Location based data analysis is useful if analyzing a process which is sensitive for environmental parameters and its changes. A simple example can be a greenhouse or storage environment and the effect on objects in it. The tables containing data about the controller module, sensor modules and sensors are also storing the basic description about the corresponding device and information about the hierarchical construction. The “Measurements” table contains the data measured by the system, uploaded by the communication module and converted by the data interface software module. The “Sensor_ID” attribute determines the used sensor, data type and location. To store the measurements, a 7 digits long variable is used with 2 decimal places which are sufficient for the most circumstances. The timestamp is stored as an attribute as well, which is provided by the systems real time clock. The “Errors” table contains the perceived failures during the operation. The table contains the corresponding ID for the sensor or device, a timestamp and the error identification number. To store the description of the interpretable errors, a separate table is needed. The descriptions are device specific, but in cases of sensors without internal controller, a timeout information can be determined as an error. The “StoredQueries” table contains the saved SQL commands, provided by the desktop application. It’s an independent table, which demonstrates the need of the dynamically changing part of the database.
Data interface and web application
To upload a data to the database, the communication module uses its GSM or Ethernet controller. The communication module is connected to the database via a data interface web application, which receives, identifies, separates, converts and inserts the mentioned data to the corresponding table. In case of data uploading, the script receives three variables, from which the first determines a function (measurement data or error data), the second determines the ID of the corresponding sensor, while the third contains the measurement itself. The values are received as ASCII characters. The need of conversion is defined by the ID of the sensor.
Desktop application
To support the remote management of the system, a desktop based application was developed using C# programming language. The goal was to achieve an interface to manage the connected control modules and sensor modules, achieve parameterized data queries with base statistic and data-visualization possibilities, manage the measurement database and give access to the system using direct control protocol and the UART interface. On the main screen, we can see the average, minimum and maximum values calculated from the data from the last measurement session and the quantity of the used data. In addition, we can use a workbook, which can be used to log the main tasks and the corresponding timestamps. The workbook can be saved after the session for further analysis. If the main screen is active (Figure5.), the database control is carried out every minute for reliable operation.
Figure 4. The main screen of the desktop application (Own source)
The function can be accessed using the menu bar, located on the top of the main window, while the main functions can be accessed from the quick access bar as well. We can see a short description about the function while hovering the pointer above the corresponding button or menu bar. The software is developed originally for greenhouse monitoring but this version is modified to achieve multifunctional usage.
Figure 5. The submenu to manage connected sensors (Own source)
In the “Sensor measurements” submenu we can display the data sets created by the system (Figure 7.). To use the function, a query must be made, which can be performed by specify the ID of the control module and the required data type or by specify the ID of the sensor. After the query, we’re able to narrow the data set using time intervals. If the specified interval contains no data, the user will be warned about the error. In a case of successful query a basic statistic is calculated including the average, minimum and maximum values and the data quantity. The data can be accessed using a data table and in case of a sensor level query, using a line chart. The mentioned data set and chart can be exported using the corresponding function in XML and PNG format.
Figure 6. Measurements submenu (Own source)
In the “Device control” submenu the user is able to send serial commands to the device. To achieve the function, a direct cable (or optionally Bluetooth) connection is needed with the host computer. The software send a command of 0b00000001 command with the default 9600 baud connection speed to the device. As the device receives the data, an interrupt is performed and the devices enters in listening mode. With the same method given by the specified protocol, but using a 0b00000010 command we’re able to give commands about the sensor measurements to a specific sensor. In this case, the second command should be the corresponding sensor ID while the third should be the instruction. The user can use the mentioned methods using the GUI without the need of knowing the protocol, of course.
Using the “Settings” submenu, we’re able to modify basic settings. The settings are presented in tab form. The “Basic” tab contains the user name, the need of workbook and the database refresh time. The “Database” tab contains the related settings about the host, database name, username, password and the used port number. Using a submenu, we can test the database connection manually and perform the creating of the database structure which can be used in a case of new database server. The “Defaults” tab contains the default filenames of the XML files, charts and workbooks, which are complemented with the current timestamp during the saving process. It contains the default saving and opening path as well. The “External devices” tab contains the settings about the connection between the host computer and the data acquisition system. It includes the port number and the used baud rate. The port selection is narrowed to the currently accessible ports to assist the user with the correct values. Before exiting, the software checks if any changes are made. In this case, the software request confirmation from the user. After successful modification, the new settings are saved in an XML file and the fact about the modification is showed in the workbook.
Before exiting, the software offers the opportunity to save the workbook to follow the sessions. The role of the workbook will be greater with the growing feature set.
System functions
The main function of the system is the data acquisition and controlling capability. The data acquisition can be performed using time specific and location specific approach. The latter is implemented with the support of the coordinates stored in the measurement database. Every module has its defined task and function. The system summarizing these functions is capable of measuring data types based on the sensor capability, send the measurement data to the network in two ways, or store it on an SD card, visualize the data directly on a screen, drive external components with IO ports or relay based on thresholds, operate wirelessly with one channel, handle errors, provide the opportunity to the user to manage the database, perform queries, use data visualization via the desktop or web application.
Testing methods
The test consists of three part, which were built stepwise. The first step was to make sure that the functions are operating correctly. To perform this step, breadboard components and Arduino development board was used, while testing the individual functions (like timers, bus drivers, sensor connections, etc.) used by the system. The second step was an experiment with the full system assembled and connected, to test the cooperation of the subsystems. The third step is to examine the practical operation in each test environment. There are more plans according to system analysis, but in this paper, we’ll concentrate on data acquisition in green house environment. The experiment was made in a greenhouse with 3 m3 inner space. 15 sensors and 3 additional devices was used which could provide
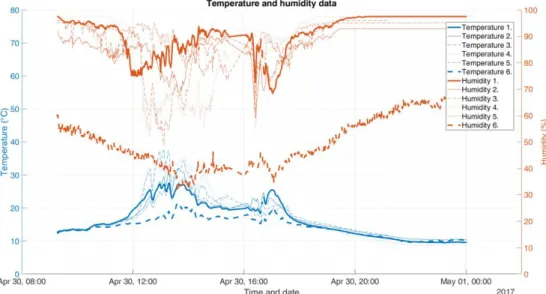
Figure 7. Temperature and humidity measurement data for a day (Own source)
The presented chart (Figure 8.) shows the temperature and humidity measurements for one day. The sampling frequency was 1 minute, which is unchanged throughout the experiment. The sensor data, labelled “Temperature 6.” and “Humidity 6.” located outside of the greenhouse, which can be seen by the interpretation of the values. The data labelled “Temperature” is a control value which measured with a high precision device located near to the sensor which is responsible for collecting the data labelled “Temperature 3.” and “Humidity 3.”. The mentioned device is a Bosch BMP085 type sensor. Because of the temporal usage, typical for the testing period, the system was built without fastening which led to missing data in the time series dataset due to connection issues caused by wind and other motions.
Figure 8. Luminous intensity measurement data for a day (Own source)
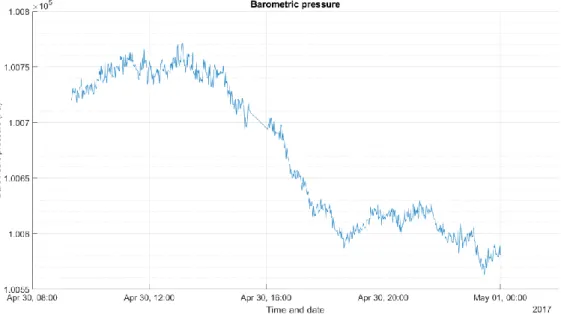
Figure 9. Barometric pressure measurement data for a day (Own source)
The mentioned BMP085 sensor is capable of measure barometric pressure, which can be seen by the chart above (Figure 10.). We can notice a jump in the dataset before the middle, which caused by an offline status while performing maintenance. The next step in the project will be the analysis of the data and the determination of optimal measurement frequency in terms of time and spatial resolution. In addition, the threshold using by the external device controller module will be modified to adopt the long-term statistics, what will be analyzed in case of an appropriate amount of data.
5.
Conclusion
The specific application areas of the systems represent a very wide spectrum, which includes the possibility of everyday use as well as professional use. In the literature review, we presented the basics of similar systems, their technological standard and their application possibilities based on a few examples. In accordance with our own experience and the experience provided by the literature, we have determined the requirements that have been considered while designing the system. Such a requirement is to provide multifunctional data acquisition and control system and achieve modular construction. The system currently has 6 modules, including controller module, user interface module, communication module, external device control module, various kit of sensors modules and wireless modules. To achieve data transfer within the system, a specific data protocol is created which is managed by the controller module while communicating with the additional modules.
which can be solved using unique design, like parallel process execution. The lack of parallel execution results in slower operation (due to wait cycles) and incorrect results in time-specific measurements (deviation of sampling cycles and lack of parallel sensor reading). The solution would be to develop a simple FPGA design, which can carry out the appropriate tasks considering the user needs.
For testing purpose, three-level approach has been applied. The first step was the test of the independent function, as the second step, the fully assembled system is tested to observe the appropriate cooperation between the subsystems. The third step was a practical experiment, which included the use of the system in a small greenhouse environment, to test the data acquisition and controlling capabilities and to serve as a basis of further experiments, which includes the processing, visualizing of the data and considering the results, it controls the further development of the system.
In summary, the development implemented in the main and secondary thread of the experiment have given a great opportunity for gaining experience, which hopefully will be reflected during later experiments. To continue the experiment with the developed device, in addition to the development, the focus will be on the experience gained in practical applications, which includes the potential benefits of using the devices.
References
Aiello, G. – Giovino, I. – Vallone, M. – Catania, P. – Argento, A. (2017): A Decision Support System based on multisensor data fusion for sustainable greenhouse management. Journal of Cleaner
Production (2017), https://doi.org/10.1016/j.jclepro.2017.02.197
Andersson, L. M. – Okada, H. – Miura, R. – Zhang, Y. – Yoshioka, K. – Aso, H. – Itoh, T. (2016): Wearable wireless estrus detection sensor for cows. Computers and Electronics in Agriculture 127 pp. 101–108. https://doi.org/10.1016/j.compag.2016.06.007
Chaudhary, D. D. – Nayse, S.P. – Waghmare, L.M. (2011): Application od Wireless Sensor Networks for Greenhouse Parameter Control in Precision Agriculture. International Journal of Wireless & Mobile Networks (IJWMN) Vol. 3, No. 1, February 2011. https://doi.org/10.5121/ijwmn.2011.3113
Chen, C.-M. – Chen, C.-H. – Siang, C.-H. (2014): Design of Information System for Milking Dairy Cattle and Detection of Mastitis. Mathematical Problems in Engineering, Volume 2014 pp. 9
https://dx.doi.org\10.1155\2014\759019
Dargie, W. – Poellabauer, C. (2010): Fundamentals of Wireless Sensor Networks. Willey. ISBN 978-0-470- 99765-9 (H/B)
Dener, M., - Bostancioglu. C. (2015): Smart Technologies with Wireless Sensor Networks, Procedia - Social and Behavioral Sciences 195 pp. 1915 - 1921. https://dx.doi.org\10.1016\j.sbspro.2015.06.202
Dyer, J. (2016): The Data Farm, An investigation of the implications of collecting data on farm. Nuffield Australia Project No 1506
Gonzalez-de-Sotoa, M. – Emmia, L. – Garciab, I. – Gonzalez-de-Santosa, P. (2015): Reducing fuel consumption in weed and pest control using robotic tractors. Computers and Electronics in
Agriculture. Volume 114, June 2015, pp. 96–113. https://dx.doi.org\10.1016\j.compag.2015.04.003
Goumopoulos, C. – O’Flynn, B. – Kameas, A. (2014): Automated zone-specific irrigation with wireless sensor/actuator network and adaptable decision support. Computers and Electronics in Agriculture 105 pp. 20–33. https://dx.doi.org\10.1016\j.compag.2014.03.012
Gurovich A., Saggé O. (2005): Fine tuning irrigation scheduling with phytomonitoring technology in Chile L. EFITA/WCCA 2005 25-28 July 2005, Vila Real, Portugal, pp. 727-732,
ISBN 972-669-646-1
Kubicek, P. – Kozel, J. – Sampach, R. – Lukas, V. (2013): Prototyping the visualization of geographic and sensor data for agriculture. Computers and Electronics in Agriculture 97 (2013) pp. 83–91
http://dx.doi.org/10.1016/j.compag.2013.07.007
Manoochehri, M. (2014): Data Just Right. Addison-Wesley, ISBN-13: 978-0-321-89865-4
Maurya, S. – Jain, K. V. (2016): Fuzzy based energy efficient sensor network protocol for precision agriculture. Computers and Electronics in Agriculture 130 (2016) pp. 20–37.
http://dx.doi.org/10.1016/j.compag.2016.09.016
Mittag, J. – Thomas, F. – Härri, J. – Hartenstein, H. (2009): A Comparison of Single- and Multi-hop Beaconing in VANETs. Institute of Telematics, University of Karlsruhe, Germany
Mohanraj, I. – Ashokumar, K. – Naren, J. (2016): Field Monitoring and Automation using IOT in Agriculture Domain. Procedia Computer Science 93 pp. 931 – 939
http://dx.doi.org/10.1016/j.procs.2016.07.275
Mohemed, R. E. – Saleh, I. A. – Abdelrazzak, M. – Samara, A. S. (2016): Energy-Efficient Routing Protocols for Solving Energy Hole Problem In Wireless Sensor Networks. Computer Networks Volume 114, pp. 51–66 http://dx.doi.org/10.1016/j.comnet.2016.12.011
Pastell, M. – Kujala, M. – Aisla, A.-M. – Hautala, M. – Poikalainen, V. – Parks, J. – Veermäe, I. – Ahokas, J. (2008): Detecting cow’s lameness using force sensors. Computers and Electronics in Agriculture 64 pp. 34–38. http://dx.doi.org/10.1016/j.compag.2008.05.007
Rehman, u.-A. – Abbasi, Z. A. – Noman, I. – Zubair, A. S. (2014): A review of wireless sensors and networks' applications in agriculture. Computer Standards & Interfaces 36 (2014) pp. 263–270
http://dx.doi.org/10.1016/j.csi.2011.03.004
Sagrado, J. D. – Sánchez, J.A. – Rodrígez, F. – Berenguel, M. (2015): Bayesian networks for greenhouse temperature control. Journal of Applied Logic. vol. 17, September 2016, pp. 25–35.
http://dx.doi.org/10.1016/j.jal.2015.09.006
Shaw, R. – Lark, R.M. – Williams, A.P. – Chadwick, D.R. – Jones, D.L. (2016): Characterising the with field scale spatial variation of nitrogen in a grassland soil to inform the efficient design of in-situ nitrogen sensor networks for precision agriculture. Agriculture, Ecosystems and Environment 230 (2016) pp. 294–306 http://dx.doi.org/10.1016/j.agee.2016.06.004
Soharby, K. – Minoli, D. – Znati, T. (2007): Wireless Sensor Network, Technology, Protocols and Applications. Wiley. ISBN: 978-0-471-74300-2
Sun, G. – Li, Yongbo, L. – Zhang, Y. – Wang, X. – Chen, M. – Li, X. – Yan, T. (2016):
Nondestructive measurement method for greenhouse cucumber parameters based on machine vision. Engineering in Agriculture, Environment and Food 9 pp. 70-78.
http://dx.doi.org/10.1016/j.eaef.2015.06.003
Thysen, I. (2000): Agriculture in the Information Society. AgEng 2000, 2-7 July 2000 pp. 297-303.
http://dx.doi.org/10.1006/jaer.2000.0580
Oteafy, S. M. A. – Hassanein, H. S. (2014): Dynamic Wireless Sensor Networks. FOCUS Networks and Telecommunications Series. Willey. ISBN 978-1-84821-531-3
Youssef, M. – Youssef, A. – Younis, M. (2009): Overlapping Multi-hop Clustering for Wireless Sensor Networks. IEEE Transactions on Parallel and Distributed Systems, Volume 20, Issue 12,