OriginalArticle
H
INTRODUCTIONypertension is a common illness in Thailand and the world, a silent killer, damaging arteries throughout the body and causing complications in major organs. Fifty four percent of these cases involved multiple organs, 21.08%
The Effectiveness of Hypertensive Management
Programs and Social Support in Primary Health
Care Systems
:
Preliminary Study
Pantip Sangprasert, M.N.S, A.P.N.*, Surasak Buranatrevedh, M.D., Ph.D.** (Public Health), Duangnate Pipatsatitpong, Ph.D.*** (Medical Technology)
*Community Health Nursing Department, Faculty of Nursing,**Department of Community and Family Medicine, ***Department of Medical Technology, Faculty of Allied Health Science, Thammasat University, Klongluang, Pathumthani 12121, Thailand.
Correspondence to: Pantip Sangprasert E-mail: [email protected], [email protected] Received 11 April 2016
Revised 23 September 2016 Accepted 23 September 2016
ABSTRACT
This quasi-experimental study used inclusion criteria obtaining samples taken from high-risk and grade I hypertensive patients aged 35 to 59 without hypertensive complications. The two related groups comprised 36 individuals. Both were enrolled in a hypertensive management program comprising health education strategies, respiratory training, advice on limiting salt and fat intake, exercise, group discussion with social support, telephon counseling, and home visits. Three perception and preventive behavior questionnaires and home behavior records collected data according to individual hypertension risk factors. The study was carried out for four months. Descriptive statistics and a paired t-test were used.
Results showed a statistical significance difference with increased total mean scores with the following variances: health status, self-efficacy and decreased barrier perception (p =.000, .008 and.022, respectively). There was noticeable improvement in exercise and stress management, but no significant change in overall preventive behavior for hypertension (p >.05). Systolic and diastolic blood pressure and heart rate were lower (p <.001). Waist and hip circumference also decreased (p = .002 and .001). Blood chemistry showed a statistically significant decrease of finger blood sugar, and increase in blood urea nitrogen and creatinine (p =.000, .00, and .004) and no statistical significance for increase in blood cholesterol (p >.05).
Primary healthcare services should also be a strategic development, especially focus socially-supported on mental wellbeing which is beneficial for risk and hypertensive groups.
Keywords: Hypertension management program; socially-supported; primary health care systems Siriraj Med J 2016;68:369-376
E-journal: https://www.tci-thaijo.org/index.php/sirirajmedj doi:10.14456/smj.2016.26
resulted in cardiovascular complications, 20.79% in kidney problems and 2.25% in strokes.1 Stroke
patients suffered visual and mobility impair-ments.2-5 During the past 12 years, the risk of
cardiovascular disease has been shown to increase by 1.3 times when systolic and diastolic blood pressure are up by 10 mmHg, while the risk rose by 1.5 times with a blood pressure reading up by 5 mmHg.6
and alcohol consumption, smoking and sedentary habits. Stress, which triggers the sympathetic nervous system and adrenaline, causes several diseases including hypertension.7-11 Indirect factors
arise from intrapersonal behavior, including lack of awareness, motivation and support from the surrounding social environment.
Different strategies promote hypertension prevention. One is awareness and lifestyle training along with social support. Pender NJ, et al.,12
sug-gested that health promotion can be motivated by activities enhancing people’s physical, mental and emotional health. These activities serve to empower people in self-efficacy13 and can be
delivered through primary-level healthcare, the major national healthcare sector working closely with the community.14
The purpose was to measure the effective-ness of the hypertensive management program and social support for promoting health behaviors based on primary care unit services.
MATERIALS AND METHODS
Methodology: After the protocol was approved by the Research Ethics Committee of Thammasat University (Code 065/2555), permission was obtained to conduct the study. The patient rights and research-related informed consent were obtained. Sample size was calculated formula of the non-dependent group was measured atα= 0.05, 80% of the power of this test.15,16
Thirty six subjects from 35 to 59 years old, who were voluntary and passed inclusion cri-teria’s screening and living in nine villages of Klongluang District, Pathumthani Province. The inclusion criteria was divided into two groups. The first group where those whose blood pressure was classed as high-normal (measuring 125/80 mmHg on a digital, or 135/85 mmHg on a tradi-tional sphygmomanometer), was suspected to be hypertensive, but not yet diagnosed, and taking medication (new cases). The second hypertensive group with no more than grade 1 hypertension (135-154/85-94 mmHg measured digitally or 140-159/90-99 mmHg on a traditional sphygmo-manometer).5
Exclusion criteria: those who changed drug
regimens for disease complications, doses of physician-prescribed as per standard procedure. Data was collected from three sources: 1. A questionnaire covering five aspects:1) demographic and general health data, 2) sive risk factors and social support, 3) hyperten-sion knowledge and risk factors, 4) health status perception, self-efficacy and barriers to hyperten-sion preventative behavior and 5) hypertenhyperten-sion preventative behaviors. Subjects were asked to rate responses on a 5-level rating scale from the lowest to a highest extent. The knowledge section consisted of 26 closed true or false questions. All sections were validated by three experts and were test-retest reliable, with a Cronbach’s alpha coefficient. self-efficacy perception = .80, barriers perception = .88, preventative behaviors = .86. The section knowledge of hypertension was tested for validity, with a Kuder-Richardson For-mula 20 (KR20) score of 0.83. Quality tests scored 0.22±0.274 for discrimination and 0.25±0.30 for difficulty.
2. Diaries were kept by subjects at home recording, type of food consumed, type and dura-tion of exercise, blood pressure and any barriers to performance, and were every two weeks remin-ders provided by phone, to encourage subjects to complete and follow the program.
3. Subject primary care unite health records, covering physiology and biology.
Medical Instruments: used for health assess- ment were a tape measuring device, sphygmo-manometer, portable digital home blood pressure monitor, body composition monitor (BCM), galvanic skin response (GSR) sensor, and respira-tory rate monitor. All instruments were calibra-ted before use and the same devices were used throughout the study.
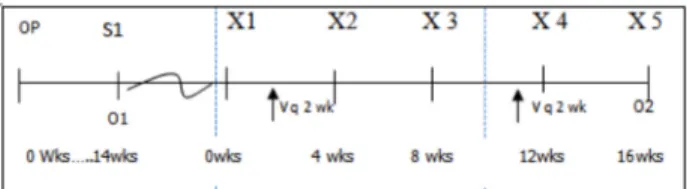
Study Design: The quasi-experimental, pre-posttest study was carried out on subjects and was performed during a sixteen-week period as follows:
In Fig 1:
OP signifies a survey of geography and planning in conjunction with organizational leaders contact team in community.
S1 signifies the first health screening of the popu-lation.
O1 signifies the first collection of data and the second in O2.
X1 X2 X3 and X4 signifies participation in CCHEP, from X1 (first session) to X4 (last ses-sion). X5 signifies the evaluation stage of the program.
V q 2 wks. signifies health check-ups at the PCU telephone counseling
The Comprehensive Continued Health Education Program (CCHEP) comprised of 7 counseling steps:
1) Building relationships and working together to assess the needs and hypertension risk factors.
2) Analyzing causes and determining accurate diagnosis.
3) Enhancing awareness which took 60 minutes in motivation and self-efficacy in three categories: food consumption (including consumption of alcohol and tobacco), emotional management and physical exercise. This included: Demonstrating and practicing breathing techni-ques, walking, and identification of three food colors –green, yellow and red- associated with low fat and sodium content in a distributed text. http://nutrition.anamai.moph.go.th/) Also local community case studies of healthy people and/or subjects with hypertension-related complications were presented.
4) Collective life planning and goal-setting to foster hypertension preventative behavior. 5) Suggesting choices with a collective commitment to engage in healthy home behaviors. 6) Building support groups among indivi-duals, families, health volunteers, and health teams involved, and monthly home visits.
7) Evaluating from group discussions problems, barriers, and solutions at the end of the project.
Analysis
Quantitative data were analyzed with the Kolmogorov-Smirnov and Shapiro-Wilk tests. The value was >.05, indicating a normal curve. A paired t-test was fore carried out to test variance within the group. Qualitative data were content describing from interviews and focus groups. (SPSS version 15 for windows was used for statis-tical analysis)
RESULTS
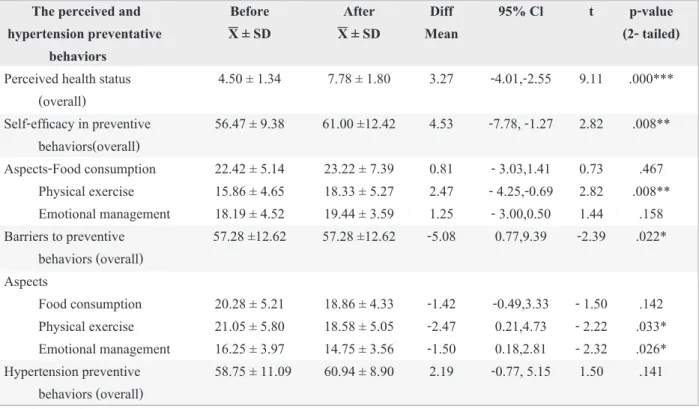
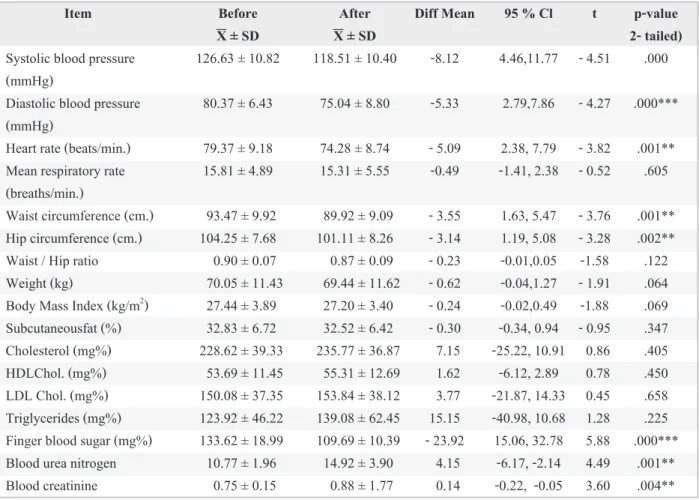
General subjects’ data is shown in Table 1. Also the comparative results before and after in samples showed that overall, mean scores of health perception and self-efficacy increased, but barriers perceptions decreased (=.000, .008 and -.022, respectively). There was a clear improve-ment in emotional manageimprove-ment and exercise; although there was no statistical significance in overall preventative behaviors. In addition, there was a decrease in systolic and diastolic blood pres-sure and heart rate (p=.000 and .001, respectively), and a decrease in waist and hip circumference (p=.001 and .002, respectively). There was also a fall in fingertip blood sugar and a rise in blood urea nitrogen and creatinine (p=.000, .001 and .004 respectively) and no statistically significant increase in cholesterol levels as shown in Tables 2 and 3. In addition, the relaxation scale increased from 30.6 to 71.2%, as shown in Table 4. According to home records, subjects prac-ticed deep inhalation and exhalation once a day for 30 minutes, while average blood pressure levels were systolic blood pressure = 125.49 ± 7.16 and diastolic blood pressure = 79 ± 8.64 mmHg. Not all subjects completed their food consumption and exercise because these are voluntarily recorded qualitative data are difficulty, and be not practically.
DISCUSSION
TABLE 1.Number, percentage of hypertensive factors (n = 36)
Hypertensive factors High normal or Hypertensive group Total
at risk group(n=23) (n=13) (n=36)
number (%) number (%) number (%)
Sleep apnea
Yes 11 (30.6) 4 (11.1) 15 (41.7) No 12 (33.3) 9 (25) 21 (58.3)
Hypertension in family history
Yes 15 (41.7) 2 (5.6) 17 (47..2) No 8 (22.2) 11 (30.6) 19 (52.8)
The other diseases (n=9)
Lipidemia 6 (16.7) 1 (2.8) 7 (19.5) Cardiovascular disease - 0 1 (2.8) Asthma or allergies 1 (2.8) 0 1 (2.8)
Hypertensive behaviors factors
Alcohol consumption
No 13 (36.1) 11 (30.6) 24 (66.7) Occasional consumption 10 (27.8) 2 (5.6) 12 (33.3) Smoking
No 18 (50) 13 (36.1) 21 (86.1) Current smokers 4 (11.1) 0 4 (11.1) Ever but not in present 1 (2.8) 0 1 (2.8)
Knowledge of hypertension
Passed (score over 60%) 9 (25) 10 (27.8) 19 (52.8) No passed (score under 60%) 14 (38.9) 3 (8.3) 17 (47.2)
The perceived and Before After Diff 95% Cl t p-value
hypertension preventative X ± SD X ± SD Mean (2- tailed)
behaviors
Perceived health status 4.50 ± 1.34 7.78 ± 1.80 3.27 -4.01,-2.55 9.11 .000*** (overall)
Self-efficacy in preventive 56.47 ± 9.38 61.00 ±12.42 4.53 -7.78, -1.27 2.82 .008** behaviors(overall)
Aspects -Food consumption 22.42 ± 5.14 23.22 ± 7.39 0.81 - 3.03,1.41 0.73 .467 Physical exercise 15.86 ± 4.65 18.33 ± 5.27 2.47 - 4.25,-0.69 2.82 .008** Emotional management 18.19 ± 4.52 19.44 ± 3.59 1.25 - 3.00,0.50 1.44 .158 Barriers to preventive 57.28 ±12.62 57.28 ±12.62 -5.08 0.77,9.39 -2.39 .022*
behaviors (overall) Aspects
Food consumption 20.28 ± 5.21 18.86 ± 4.33 -1.42 -0.49,3.33 - 1.50 .142 Physical exercise 21.05 ± 5.80 18.58 ± 5.05 -2.47 0.21,4.73 - 2.22 .033* Emotional management 16.25 ± 3.97 14.75 ± 3.56 -1.50 0.18,2.81 - 2.32 .026* Hypertension preventive 58.75 ± 11.09 60.94 ± 8.90 2.19 -0.77, 5.15 1.50 .141
behaviors (overall)
TABLE 2. Comparison of the average values of perceived and hypertension preventative behaviors scores before
and after participation in the program (n = 36)
support. There was interaction between knowledge, belief, and motivation in working towards the goal of promoting healthy behaviors in hypertension, as noted by Pender NJ, et al.,12 and Bloom B and
Dale E.17,18
Stress relief through slow deep-breathing awareness meditation improves general and peripheral muscle relaxation by stimulating the parasympathetic nervous system, also leading to relaxation of blood vessel walls. The heart rate slows, but the heart beats more effectively.19 The
study showed a slower heart rate of 5.09 beats per minute on average (p =0.01) and the relaxation scale increased from 30.6 to 72.2%, while the stress scale fell from 52.7 to 11.1%. Additional
effects from participating in group discussions were the release of tension and anxiety by ex- changing experiences. Some subjects felt con-strained and uncomfortable when practicing breathing, so group members with positive expe- riences suggested their own breathing techniques, after which the former felt better. Some subjects reported that they practiced breathing awareness before going to bed, so slept better. These occur-rences indirectly impacted emotional wellbeing perception.9
Greater incorporation of exercise into daily routine in the form of brisk walking instead of running, cycling to the fields and arm swinging resulted in a decrease in waist and hip
circumfe-Item Before After Diff Mean 95 % Cl t p-value
X ± SD X ± SD 2- tailed)
Systolic blood pressure 126.63 ± 10.82 118.51 ± 10.40 -8.12 4.46,11.77 - 4.51 .000 (mmHg)
Diastolic blood pressure 80.37 ± 6.43 75.04 ± 8.80 -5.33 2.79,7.86 - 4.27 .000*** (mmHg)
Heart rate (beats/min.) 79.37 ± 9.18 74.28 ± 8.74 - 5.09 2.38, 7.79 - 3.82 .001** Mean respiratory rate 15.81 ± 4.89 15.31 ± 5.55 -0.49 -1.41, 2.38 - 0.52 .605 (breaths/min.)
Waist circumference (cm.) 93.47 ± 9.92 89.92 ± 9.09 - 3.55 1.63, 5.47 - 3.76 .001** Hip circumference (cm.) 104.25 ± 7.68 101.11 ± 8.26 - 3.14 1.19, 5.08 - 3.28 .002** Waist / Hip ratio 0.90 ± 0.07 0.87 ± 0.09 - 0.23 -0.01,0.05 -1.58 .122 Weight (kg) 70.05 ± 11.43 69.44 ± 11.62 - 0.62 -0.04,1.27 - 1.91 .064 Body Mass Index (kg/m2) 27.44 ± 3.89 27.20 ± 3.40 - 0.24 -0.02,0.49 -1.88 .069
Subcutaneousfat (%) 32.83 ± 6.72 32.52 ± 6.42 - 0.30 -0.34, 0.94 - 0.95 .347 Cholesterol (mg%) 228.62 ± 39.33 235.77 ± 36.87 7.15 -25.22, 10.91 0.86 .405 HDLChol. (mg%) 53.69 ± 11.45 55.31 ± 12.69 1.62 -6.12, 2.89 0.78 .450 LDL Chol. (mg%) 150.08 ± 37.35 153.84 ± 38.12 3.77 -21.87, 14.33 0.45 .658 Triglycerides (mg%) 123.92 ± 46.22 139.08 ± 62.45 15.15 -40.98, 10.68 1.28 .225 Finger blood sugar (mg%) 133.62 ± 18.99 109.69 ± 10.39 - 23.92 15.06, 32.78 5.88 .000*** Blood urea nitrogen 10.77 ± 1.96 14.92 ± 3.90 4.15 -6.17, -2.14 4.49 .001** Blood creatinine 0.75 ± 0.15 0.88 ± 1.77 0.14 -0.22, -0.05 3.60 .004**
TABLE 3. Comparison of the average values in cardiovascular, respiratory and bodily composition and in blood
chemistry changes before and after the program (n = 36)
rence (3.55 and 3.14 cm.at p <.01, respectively). Breathing, meditation and continuous exercise increased blood vessel wall flexibility, with consequent decreased systolic blood pres-sure and diastolic blood prespres-sure (-8.12 and -5.33 mmHg, respectively). These results were reflected in findings of an experiment in which for 15 minutes per day subjects practiced breathing less than 10 times per minute and exhaling slowly20-22
and exercise with inhalation practice study in the hypertensive patients group decreased diastolic blood pressure (-10.14 mmHg at p< .001).23 Also
the study in the healthy group was a decrease in systolic blood pressure and diastolic blood pres-sure (4.3 and 2.7 mmHg ) (p<.05).24
There was an increase of blood cholesterol and lipids (p<.05). It is possible that the blood fat all of subjects before the program might have been above normal, but this was accounted for by increase in HDL cholesterol. This happened because it takes time to clear the system of harmful fats. There was no statistical difference in overall behavior, especially eating, where it was difficult to control sodium and fat consumption due to subject habits or preferences, Although they were suggested that reducing salt, carbohydrate and lipid in three color zones. The two subjects had experienced increasing weight due to increased appetite.
Possibly, changes in mental and physical perceptions are internal processes requiring additional methods to highlight the need for more strategic advice designed for specific individuals. Blood chemistry may change due to different
factors, including long-term behavioral changes lasting over four months.25-27
The primary healthcare team and com-munity leaders provided practical help in social support to positively influence health perception. Studies have shown that subjects with more social support had better preventative behavior than those without it.28 Similarly, those with emotional
support had lower stress levels, reducing the risk of hypertension and cardiovascular disease.29
Those with less support were at higher risk due to greater stress.30 Family members and caregivers
encouraged patients to exercise continuously.31
CONCLUSION
General subjects data revealed that interes-tingly the samples had similar risk findings which corresponded with national and international organizational studies of hypertension and arterial conditions.5,12 This program enhanced
preventa-tive motivation research is beneficial for inhibiting and slowing complication in two groups.
ACKNOWLEDGEMENTS
Research funded by Thammasat University. We would like to thank Prof. Preera Buranakitja-roen, Assistant Professor Dr.Nuntawon Suwona-loop, Assistant Professor Dr.Kornanong Yuen-yongchaiwat, and Sutiphol Udompanturak who provided advice on both the study and statistics, the leader and members of the primary health care team in the community, and all study participants.
Before (n=36) After (n=36)
number (%) number (%)
1. Relaxation as defined by warm skin 11 (30.6) 26 (72.2) 2. normal as defined by balanced skin temperature 6 (16.7) 6 (16.7) 3. Stress as defined by cold, clammy skin 19 (52.7) 4 (11.1)
REFERENCES
1. The Surveillance Ministry of Public Health. Chronic Diseases Surveillance Report 2011;43(17):257-72. 2. Thai Ministry of Public Health. Defining chronic illness
and disability. (Internet) Public Health Thailand (updated reviewed 2014 March 13; cited 2014 April 10) Available from: http://www.service.nso.go.th/knowledge09/sanita- tion.html, accessed on 12 February 2016.
3. The National Statistical Bureau of Policy and Strategy. Number of Deaths and Death Rates per 100,000 Population by Leading Causes of Death, 2006 – 2010, (Internet) Ministry of Public Health of Thailand. (update reviewed 2010; cited 2016 Feb 12) Available from : http://www.bps. ops.moph.go.th/Healthinformation/2.3.6_53.pdf, 4. Centers for Disease Control and Prevention. Healthy People
2020. (Internet) National Center for Chronic Disease Prevention and Health Promotion, Division for Heart Disease and Stroke Prevention (updated reviewed 2014 March 13; cited 2014 April 10) Available from:http:// www. cdc.gov/dhdsp/hp 2020.htm
5. Hypertension Society Committee. Thai Guidelines on the Treatment of Hypertension Update 2015, Hounum Printing Co., 2015.p.1-7.
6. Sritara P, Cheepudomwit S, Chapman N, Woodward M, Kositchaiwat C, Tunlayadechanont S, et al. Twelve-year changes in vascular risk factors and their associations with mortality in a cohort of 3499 Thais: the Electricity Genera- ting Authority of Thailand Study. Int J Epidemiol 2003; 32:461-8.
7. World Health Organization. Publications on primary health care and health promotion. (Internet) Geneva:Author. (updated 2002 ; cited 2012 July 3) Available from: http:// www. who. int/hpr/ archive/ docs/index.html
8. Keawkingkeo S. Psychiatric Nursing. 2nd ed. Pathumthani: Thammasat University Printing, 2011.p. 83-94.
9. Ruchiwit M. Stress management for promoting mental health. 2nd ed. Phathumthani: Thammasat University Prin-
ting, 2013.
10. Fuchs FD, Chambless LE, Whelton PK, Nieto FJ, Heiss G. Alcohol consumption and the incidence of hypertension: The Atherosclerosis Risk in Communities study. Hypertens. 2001;37(5):1242-50.
11. ESH & ESC. 2007 Guidelines for the Management of Arterial Hypertension The Task Force for the Management of Arterial Hypertension of Arterial Hypertension of the European Society of Hypertension (ESH) and of the European Society of Cardiology (ESC). Hypertens 2007; 25:1105-87.
12. Pender NJ, Murdaugh CL, Parsons MA. Individual Models to Promote Health Behavior in Health Promotion in Nursing Practice. 5th ed. California: Appleton & Lange, 2006.p. 50-66.
13. House, JS.Umberson D, Landis, KR. Structures and Processes of Social Support. Ann Rev Socio 1988;14:293- 318. (Internet) ITHAKA (update reviewed 2010 cited 2014 Jan 5) Available from: http:// www.jstor.org/ stable/ 2083320
14. Sukimanine U. Primary care. Royal Bird Welfare Institute Media Create Co., Bangkok, 2005.p. 48-73.
15. Boriboonhirunsarn D. Medical Research Symposium: Sample size calculator July 2008, Department of Obstetrics and Gynecology, Faculty of Medicine Siriraj Hospital, Mahidol University, 2008.
16. Daniel WW, Cross CL. Biostatistics: a foundation for analysis in the health sciences. John Wiley & Sons, New York, 1999.p.113-22.
17. Bloom B. The Properties of Bloom’s Taxonomy of Educa- tional Objectives for the Cognitive Domain. Seddon. JSTOR 1978;48(2):303-423.
18. Dale E. Audio-Visual Methods in Teaching. 3rd ed. Holt.
New York: Rinehart & Winston, 1969.p.108
19. Intarakumhumhang P. Principles of exercise training. Exercise: health promotion and disease prevention 21-22 August 2003 Cardiac rehabilitation League Rajvithee hospital Bangkok. Thailand 2003.
20. Tobin MJ, Chadha TS, Jenouri G, Birch SJ, Gazeroglu HB, Sackner MA. Breathing patterns. Part 1:Normal subjects. Chest 1983; 84: 202-5.
21. Elliott WJ, Lzzo JL, WhiteWB, Rosing DR, Snyder SC, Alter A, et al. Graded blood pressure reduction in hyper- tensive outpatients associated with use of a device to assist with slow breathing. J Clin Hyper 2004;6: 553-59. 22. Elliott WJ, Lzzo JL. Device-Guide Breathing to Lower
Blood Pressure: Case Report and Clinical Overview, 2006. (Internet) WebMD LLC (updated reviewed 2014 March 13; cited 2014 April 10). Available from: http://www.medscape. com/view article 539099.
23. Sangprasert P, Pradujkanchana N. The Effectiveness of Health Promotion Behavior Program (HPBP) in Thai Hypertensive Patients. Thammasat Int Sc Tech 2010;15 (1):53-59.
24. Sangprasert P. The Effect of Health Promotion Program on Exercise among Staff of Thammasat University (Rangsit Campus). J Nurs Sci 2005;54(4):252-65.
25. International Diabetes Federation. Anew worldwide defini- tion of the metabolic syndrome Consensus from the Inter- national Diabetes Federation could help stop the cardio vascular disease time bomb. International Diabetes Federa- tion and World Health Organization, 2005.
27. Tipmanosing D. The incidence of metabolic syndrome in patients 60 Rosesukon- manochayathon. The health organi- zation Bangkok, 2009; 8(1):4-10.
28. Cobb, S. Social support as a moderator of life stress. PSYCHOSOM MED. 1976;38:300-314.
29. Langlie JK. Social networks, health beliefs, and preventive health behavior. JSTOR. 1977;18:244-60.
30. Caplan G. Support Systems and community mental health: Lectures on concept development. New York: Behavioral Publications, 1974.p.7-8.