Using Machine Learning
on Sensor Data
Alexandra Moraru
1, Marko Pesko
1,2, Maria Porcius
3,
Carolina Fortuna
1and Dunja Mladenic
1,31Jozef Stefan Institute, Ljubljana, Sloveniaˇ
2MOBITEL Telecommunication Services Inc., Ljubljana, Slovenia 3J. Stefan International Postgraduate School, Ljubljana, Slovenia
Extracting useful information from raw sensor data re-quires specific methods and algorithms. We describe a vertical system integration of a sensor node and a toolkit of machine learning algorithms for predicting the number of persons located in a closed space. The dataset used as input for the learning algorithms is composed of auto-matically collected sensor data and additional manually introduced data. We analyze the dataset and evaluate the performance of two types of machine learning algorithms on this dataset: classification and regression. With our system settings, the experiments show that augment-ing sensor data with proper information can improve prediction results and also the classification algorithm performed better.
Keywords: sensor node, data mining, machine learning, prediction
1. Introduction
The development of sensor networks, particu-larly in the last years, has extended their ap-plicability in various domains, such as heritage preservation, environmental motoring and hu-man activity recognition. Sensor based systems are known as being highly application depen-dent. This also includes the top layer, which should handle the data in an efficient and use-ful manner. Furthermore, the size of collected data is rapidly increasing with the number and scale of deployed sensor networks and special-ized methods able to deal with such scale and still satisfy application requirements are needed. In this paper, we show how we can apply ma-chine learning (ML) algorithms on automati-cally gathered sensor data combined with
man-ually collected data in order to predict differ-ent evdiffer-ents. Our demonstration is based on the data collected from a sensor node deployed in our lab, which measured temperature, humid-ity, light and pressure over 15 days. These pa-rameters are affected by human presence. In parallel, we manually collected data related to human presence and events in the lab. These two sets of data are then aligned and used for training ML algorithms which are then able to predict the number of people in the lab.
This work is focused on ML for analysis of sen-sor data as a part of a complete vertical system integration, spanning from hardware at the bot-tom level to data-driven ML algorithms at the topmost. To the best of our knowledge, this is the first sensor system with such a deep vertical integration. Moreover, we consider our sys-tem as an example of applying machine learn-ing methods on sensor data, which can provide high-level guidelines for similar applications in-volving prediction from sensor data.
2. The Vertical System
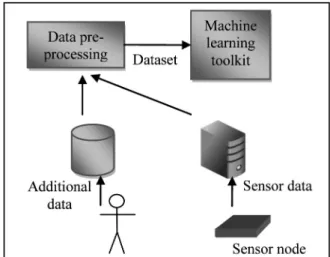
The components of the system are presented in Figure 1 and they are: the sensor node, a server collecting sensor data, a human component for introducing additional data, database with the additional data, data preprocessing tools and ML toolkit. For gathering the dataset, first we get raw data from sensors on the sensor node, and then we transmit these data to a machine for storage. In the next step, we use preprocess-ing methods to integrate automatically collected data with manually labeled data for training ML algorithms.
Figure 1.Vertical system integration.
2.1. Sensor node
The sensor node consists of sensors, power supply, LCD and ATmega128L microcontroller connected to the PC via RS232 to USB con-verter. We used Taos TSL2561 light-to-digital converter for measuring luminance, Sensirion SHT11 for temperature and relative humidity and VTI SCP1000 for absolute air pressure. The microcontroller gathers data from sensors at a sampling rate of 10 seconds, then packs data into a vector and finally sends it to a server for storage, via the serial port.
2.2. Data gathering
Sensor data are read from the serial port by an application(VS 2005 .NET application written in C#)which allows the user to set custom port,
Min Max Mean
Temperature (◦C) 16.94 29.93 25.93
Humidity (%) 14.43 47.9 31.12
Light (Lux) 0 64.71 26.30
Pressure (hPa) 995.7 1025.6 1011.9
Table 1.Sensor data statistics.
baud rate, target storage(database or simple text file) through a GUI. In our experiments, data were stored in a text file, each sample contain-ing 4 numerical values(temperature, humidity, light and pressure) and a time stamp. Table 1 contains the statistics of sensor data: minimum and maximum values, and mean value calcu-lated from all instances. From this, it can be concluded that the measurements are correct, with no extreme values.
In addition, three more attributes have been manually entered in the separate table: the num-ber of people in the lab, the numnum-ber of com-puters running and the position of the window. Each of these attributes has attached a time stamp, whenever a change in their values oc-curred. In this process of collecting additional data, all the persons working in our lab were involved. The class attribute is represented by the number of people present at one time in the lab, and it can have one of the following values: 0, 1, 2, 3.
Figure 2 plots an example of the variation of sen-sor data in the lab during a working day. From aligning this data with the additional manually introduced data(see the sample in Table 2)we
Time Persons Window Computers
7:15 1 open 3
10:00 0 closed 3
11:04 3 closed 3
13:11 3 open 3
13:55 3 closed 3
14:09 2 1/2 open 3
18:39 0 closed 2
Table 2.Manually collected data sample.
can observe that the humidity and temperature values are rising with the increase in the num-ber of people in the lab. Also, the intensity of the light is higher when people are in the lab, mainly due to artificial illumination. For example, it can be observed that the light was rapidly increasing at 7:15 when a person entered the room and turned on the lights. Significant changes in the temperature and humidity trend lines appear when the window is opened.
2.3. Data processing and learning
The first step in data processing was the align-ment of sensor data with the manually collected data, based on time stamps, resulting in an aug-mented dataset. The initial sampling rate for the sensor data was of 10 seconds, while for the manually collected data, the time stamp con-tained only the hour and minute of the entry. For all instances from the sensor data within the same minute we assigned the corresponding instance from the additional collected data. In the second step we performed dataset re-duction, first by choosing a sampling rate of 1 minute, since the manually collected data has the time stamp only in hour and minutes. How-ever, some of the features from the sensor data
(i.e. ambient light)present high variations dur-ing one minute, which cannot be correctly corre-lated with additional data. Namely, the moment when a person enters the office and turns on the light is sensed in no more than 10 seconds by the sensor device, while in the additional data, this is marked only in minutes. Moreover, the difference of the time stamps for the two sources of data may vary with a few minutes, because more people entered the additional data and was no time synchronization applied. We have also
eliminated the data obtained during the night
(between 8:00 PM and 6:00 AM), to avoid too many instances with 0 persons. Namely, the data obtained during the night had no persons and including all these data would make our dataset very unbalanced. Therefore, the result-ing dataset contains some incorrect instances due to human errors and the impossibility of perfectly aligning sensor data with manually collected data. On the other hand, there are no missing values in the dataset.
The dataset used in the learning process contains a total of 16,578 measurements, each with 9 at-tributes: temperature, humidity, light, pressure,
weekday (with two nominal values: working
day and weekend), hour interval (integer val-ues between 6 and 19), position of the window
(with three nominal values: open, half open and closed), number of computers working(integer values between 1 and 4)and number of people in the lab (class attribute). The value distribu-tion for the class attribute is: 44.17% instances with 0 persons, 25.27% instances with 1 per-son, 22.24% instances with 2 persons, 8.32% instances with 3 persons, respectively.
On this dataset we applied two learning meth-ods: classification and regression. The first method is used for predicting categorical class labels, while the second method models conti-nue-valued function for approximating the tar-get variable(class attribute). We decided to test both methods since the target variable, in our settings, can be seen both as a variable with dis-crete values or as a numerical variable. The classification algorithms applied are decision tree and Bayesian network. The first one pro-vides a good visual interpretation of the results and the second one has a better usage of all the attributes of the dataset. As a regression algorithm we chose the commonly used linear regression.
3. Interpretation and Evaluation of the Results
Algorithm
Evaluation J48 BayesNet RegressionLinear
MAE 0.17 0.12 0.44
RMSE 0.29 0.26 0.54
Simple Dataset
ACC 73% 80% —
MAE 0.15 0.1 0.34
RMSE 0.27 0.24 0.45
Augmented Dataset
ACC 78% 83% —
MAE:mean absolute error; RMSE: root mean squared error; ACC: accuracy
Table 3.Evaluation of classification and regression algorithms
attribute, while the second case augments sensor data with additional manually introduced data. To compare how different learning methods be-have on our dataset, we chose two classification algorithms: C4.5 algorithm for learning deci-sion trees and Bayesian networks. For the re-gression method we applied a standard linear regression. We used implementation of these algorithms available on WEKA toolkit[2]. In Table 3 it can be observed how the algo-rithms performed on the simple and augmented dataset. The mean absolute error (MAE) and the root mean squared error(RMSE)are quan-tifying how close the predictions to the target value are. While MAE is an average of the absolute error, RMSE indicate square of the ab-solute error, emphasizing on how large is the difference between the predicted and actual val-ues. For the classification algorithms, we also reported the classification accuracy.
As it can be seen in Table 3, all algo-rithms had better results with the aug-mented dataset, suggesting that combin-ing sensor data with additional relevant data can help in improving crowdedness prediction. We can see that Bayesian net-works have the best performance, closely followed by Decision trees (J48), while Linear regression has more than double error, compared to Bayesian networks on both datasets.
3.1. Decision tree
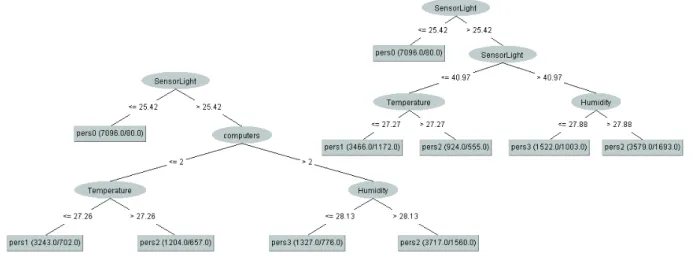
Figure 3 displays the decision trees for the sim-ple and augmented datasets. For this represen-tation, we put a constraint that at least 5% of the total number of instances has to be in a leaf
(the constraint was set after several preliminary tests). Both decision trees have the sensor light measurements attribute in the root node, which can easily classify a large number of the in-stances with 0 persons, if the light has low value
(<=25.42). Another observation is that for the simple dataset, three of the four attributes are used for classification: light, temperature and humidity. Moreover, it can be observed how additional data influence the structure of the de-cision tree. In this case, only one attribute from the additional data is used: the number of com-puters working.
Considering that increasing the minimum num-ber of instances in a leaf might generate data overfitting, but also the fact that other attributes
might be useful for a better classification, we de-cided to continue our experiments with Bayesian network learning method, as this method de-scribes probability distribution over a set of vari-ables.
3.2. Bayesian network
For the Bayesian network algorithm we used the following setting in WEKA toolkit: simple estimator and K2 search algorithm.
Table 4 and Table 5 show the confusion ma-trix of the two cases of simple and augmented datasets. We can observe that in the case of the augmented dataset, there is a better distinction between the instances with 0 persons and the rest of instances. For example, there are no in-stances with 2 or 3 persons misclassified in the category with 0 persons.
0 1 2 3
0 7096 120 100 11
1 95 2988 891 218
2 37 833 2566 253
3 1 246 492 640
Table 4.Confusion matrix for the simple dataset.
0 1 2 3
0 7073 208 45 1
1 38 3085 933 173
2 0 557 2731 401
3 0 16 378 985
Table 5.Confusion matrix for the augmented dataset.
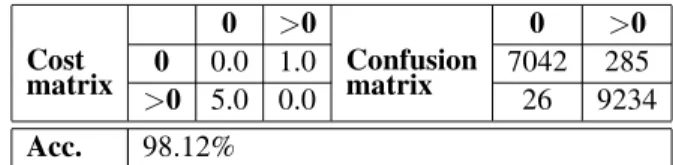
If we consider the class attribute as having only two values — 0 persons and more than 0 per-sons, then we can check if our system can be used for simple human detection. We per-formed a cost/benefit analysis and we were able to improve the accuracy of prediction on aug-mented dataset to up to 98%, compared to 83% correctly classified instances in the case of 4 categories(class attribute values). We chose to perform this analysis with Bayesian networks since it had the best overall performance. The results are shown in Table 6, where the cost and
0 >0 0 >0
0 0.0 1.0 7042 285
Cost
matrix >0 5.0 0.0 Confusionmatrix 26 9234
Acc. 98.12%
Table 6.Cost/benefit analysis.
confusion matrix are represented. We set a 5 times bigger cost for misclassifying instances with more than 0 persons, then for misclassify-ing instances with 0 persons. As a result, there were only 26 instances with more than 0 persons misclassified, with a recall1of 0.997. This type
of prediction can be useful in the case when it is more important to correctly classify the in-stances with more than 0 persons (e.g. alarm systems).
3.3. Linear regression
We have applied a simple linear regression al-gorithm. For the purpose of running linear re-gression, we need to have numeric values for all the attributes. Thus, the window attribute in the augmented dataset was mapped to three binary attributes (with values 0 or 1) corre-sponding to each nominal values (WinClosed,
WinHalfOpen WinOpen). Also, the weekdays
were mapped to a binary attribute (
Working-Day) with 0 for weekend and 1 for working
days; the class attribute has integer values from 0 to 3.
Figure 4 depicts the resulting linear model used for prediction. It can be noticed that the same
People=0.3913 * WorkingDay+
−0.0065 * Hours+0.0537 * Temperature+
−0.009 * Humidity+0.0105 * SensorLight+
−0.0059 * Pressure+0.351 * Computers+
−0.6541 * WinClosed+-0.4602 * WinHalfOpen+
−0.5627 * WinOpen+6.6509 People=0.0482 * Temperature+
−0.0071 * Humidity+0.0298 * SensorLight+
−0.0167 * Pressure+17.0532
Figure 4.Linear regression model for augmented(top)
and simple(bottom)datasets.
1 Recall is defined as the ratio between the number of true positive instances and the sum of true positive and false negative
attributes from the simple dataset are used as in the decision trees shown in Figure 3. We can see that temperature and sensor light have positive influence on the number of people. On the augmented data, the largest coefficients are at the number of computers and working day attributes, showing their positive influence on the predicted number of people. This indeed reflects the situation in the lab, as there are per-sonal computers and each person usually turns off the computer before leaving the lab.
4. Related Work
Though the number of vertical systems imple-mentations is not really high, similar work can be found in[3]. The authors present networked sensor infrastructure composed of commonly used devices in an office (PCs, PDAs, tele-phones etc.) to which a Bayesian ML method is applied in order to facilitate human interaction. The training set is composed by manually la-beling each activity detected on the monitored devices. This approach is different from our work in terms of the utilized sensors and the accent is put on the Bayesian learning method, not on a vertical system.
The work presented in[4]is in the context of us-ing semantic technologies in sensor networks. Using RDF and RDQL query languages with slight modifications, sensor data is modeled for querying in different situation. However, the dataset is obtained by simulating a sensor net-work that emphasizes the power of the system and query language, thus the system may per-form differently in a real environment. A differ-ent approach is described in[5], where the sen-sor network is modeled using Dynamic Markov Random Field to analyze real-world environ-ment, in which sensor data may be corrupted, influenced by noise or lost. Then the inference on data is done, using an implementation of two algorithms — Markov Chain Monte Carlo and Value Iteration — to predict and analyze forest fires.
5. Conclusions and Future Work
In this paper we presented vertical system in-tegration for predicting the number of persons
in our lab. We labeled sensor data with addi-tional data and created an augmented dataset to which we applied ML algorithms. After analyz-ing the prediction results from the simple and the augmented datasets, we conclude that the number of persons can be predicted based on sensor data. Furthermore, the prediction can be improved when adding additional information for all three ML algorithms. In addition, we have also shown the improvements in accuracy of prediction when we limited the values of the class attribute to 0 or no persons.
Choosing the right ML method to apply on sen-sor data depends on the application and on the expected outcomes. On our data, decision trees and Bayesian networks give better results than linear regression, but, to make general conclu-sions, more experiments on larger datasets are needed. We found the model generated by deci-sion trees to be the easiest to interpret and well performing.
The results we have obtained are encouraging for further extension of the system, by creating a network of sensors so that more information can be obtained. We are also considering com-plementing the current system with semantic technologies for enriching the data for more di-versified and highly accurate predictions.
6. Acknowledgments
This work was supported by the Slovenian Re-search Agency and the IST Programme of the European Community under PASCAL2 Net-work of Excellence(ICT-NoE-2008). This pub-lication only reflects the authors’ views.
References
[1] M. CERIOTTI,ET AL., Monitoring Heritage Build-ings with Wireless Sensor Networks: The Torre Aquila Deployment. Proceedings of the Interna-tional Conference on Information Processing in Sensor Networks, (2009) April 13–16, pp. 277– 288, Washington, DC.
[2] M. HALL, E. FRANK, G. HOLMES, B. PFAHRINGER, P. REUTEMANN, I. H. WITTEN, The WEKA Data Min-ing Software: An Update.SIGKDD Explorations,
[3] M. M ¨UHLENBROCK, O. BRDICZKA, D. SNOWDON, J. MEUNIERLearning to Detect User Activity and Availability from a Variety of Sensor Data. In Pro-ceedings of the Second IEEE International Confer-ence on Pervasive Computing and Communications,
(2004)March 14–17, Washington, DC.
[4] B. SZEKELY, E. TORRES, A semantic data collection model for sensor network applications. December 2004, http://www.klinewoods.com/papers/ semanticdcn.pdf[02/15/2009]
[5] J.-M. KIM, Applying Dynamic Markov Random Fields for Sensor Data Analysis. Report,
http://web.mit.edu/murj/www/v13/v13-Reports/v13-r1.pdf[02/15/2009]
Received:June, 2010 Accepted: November, 2010
Contact addresses: Alexandra Moraru J. Stefan Institute Jamova 39, 1000 Ljubljana Slovenia e-mail:[email protected] Marko Pesko MOBITEL Telecommunication Services Inc. Vilharjeva 23, 1537 Ljubljana Slovenia e-mail:[email protected] Maria Porcius J. Stefan International Postgraduate School Jamova 39, 1000 Ljubljana Slovenia e-mail:[email protected] Carolina Fortuna J. Stefan Institute Jamova 39, 1000 Ljubljana Slovenia e-mail:[email protected] Dunja Mladenic J. Stefan Institute Jamova 39, 1000 Ljubljana Slovenia e-mail:[email protected]
ALEXANDRAMORARUis a student at the J. Stefan International Post-graduate School in the Information and Communication Technologies second-level program. She got her BSc degree in computer science from the Technical University of Cluj-Napoca in 2009. She started her collaboration with J. Stefan Institute in 2008, with a 2 months internship program, and since 2009 she is a student there. Her general research interests are in the area of Semantic Web and semantic technologies, more specifically, the applicability of semantics in sensor networks.
MARKOPESKOreceived B.Sc. degree in electrical engineering from the Faculty of Electrical Engineering, University of Ljubljana in 2009. He is employed at Mobitel, Telecommunication Services, Inc., the ma-jor Slovenian mobile provider, and is a second year Ph.D. student of information and communication technologies at the Jozef Stefan Inter-national Postgraduate School. His research work is carried out in the frame of young researcher scheme in collaboration with the Department of Communication Systems at the Jozef Stefan Institute. His main re-search interests are in the area of wireless sensor networks and their integration with next generation mobile networks.
MARIAPORCIUSis a student at the Jozef Stefan International Post-graduate School in the Information and Communication Technologies second-level program. She got her BSc degree in computer science from the Technical University of Cluj-Napoca in 2009. She started her collaboration with Jozef Stefan Institute in 2009, within Communica-tion Systems department. She is also a member of SensorLab team, a group of mostly PhD students, who are developing their research work in the area of wireless sensor networks. Her research interests comprise challenges and issues on the network and application layers for sensor systems.
CAROLINAFORTUNAis a senior research assistant and a PhD student working at the Department of Communication Systems, Jozef Stefan Institute. She got her BSc degree in electrical engineering from the Technical University of Cluj-Napoca, Romania. Her research is in-terdisciplinary focusing on semantic technologies with applications in modelling of communication and sensor systems and on combining semantic technologies, statistical learning and networks for analyzing large datasets. She has published papers in refereed conferences and journals, served in the program committee of conferences such as ICC, Globecom and WCNC. She has also been to industry internships at Bloomberg LP and Siemens PSE.