VOLUME 16 ISSUE 3 (2018) Page 233 – 247
EVALUATING TRAVEL TIME AND PASSENGER RIDERSHIP OF UNIVERSITY SHUTTLE BUS SERVICE
Nur Syahira Zulkefly1 & Abdul Azeez Kadar Hamsa2
1,2
Kulliyyah of Architecture and Environmental Design INTERNATIONAL ISLAMIC UNIVERSITY MALAYSIA
Abstract
Poor service adherence to the scheduled timetable and less service frequency during peak hours have contributed to unreliable shuttle bus services in International Islamic University Malaysia. As a result, students use either private vehicles or walk on-campus rather than riding the shuttle buses. This paper analyse travel time and passenger ridership of shuttle bus services from field surveys on journey time, running time, dwell time and passenger volume along Mahallah Ruqayyah and Mahallah Salahuddin shuttle bus routes. One of the key results on travel time indicates poor service adherence by bus service providers. In terms of passenger ridership, there was a huge gap between Mahallah Ruqayyah and Mahallah Salahuddin route where Mahallah Salahuddin has recorded a low passenger ridership even during peak hours. The findings also show that the service frequency of shuttle bus during peak hours cannot accommodate all students and therefore students either walk or use private vehicles to commute within campus area. Recommendations on the improvement of shuttle bus services are also discussed in this paper.
INTRODUCTION
One of the main roles of public transportation is to provide adequate mobility and wide connectivity to major land uses at an affordable fare to a larger population at both urban and regional level. The use of public transport depends very much on how efficient, reliable, quick, comfortable and economical that the transport services provided for to a larger population. The high use of public transport is seen as an advantage to the society in terms of reducing traffic congestion, decreasing parking demand, and reducing noise and air pollutions. The public transport services for an University campus is very important because it provides not only better accessibility to a wider University population but also help to serve in mitigating the increased number of private vehicle use. Shuttle bus service is one of the public transportation system provided in International Islamic University Malaysia (IIUM), Gombak campus to serve students from students’ residential areas on-campus to the main academic and administrative centres. Presently, the services are provided along two routes, one connecting female residential (Mahallah) areas to the main academic and administrative centres and other connecting male residential areas to main academic and administrative centres. Since the introduction of the shuttle bus services on-campus, the use of these services has been declining due to decrease in service performance related factors such as increase in travel time and low service frequency. As a result, many students on-campus either walk or use motorcars and motorcycles for their daily travel between residential areas and main academic and administrative centres.
The purpose of this paper is to investigate the travel time and passenger ridership of the two shuttle bus service routes in IIUM. It is to ascertain the existing service performances of these services along the two selected bus routes. The findings of this study are expected to shed lights on the application of measures to improve public shuttle bus services on-campus and as a result help decrease the use of private transport.
SHUTTLE BUS AND SHUTTLE BUS SERVICES IN IIUM
The advantages of public transport system are obvious in the sense that it transport large number of people from one place to another in a less number of vehicles. Public transport is intended to provide passenger transport services operating on established schedules along designated routes with specific stops and available to any individual in a community for a fare. Optimal organizational structure should be established to maximize the use of public transport, non-motorized transport and minimize the use of private vehicles for the benefits of less energy consumption, greenhouse gas emission and use of urban spaces (Shibayama, 2011).
different activity centres such as shopping centres, tourism areas and airports (Vuchic, 2007). Buses, vans and rail transit are generally used to transport people between these activities. Generally, non-stop services are provided between these activities. However, the routes may have stops in between if demanded by the passengers.
One of the important indicators for the success of the shuttle bus services is travel time. Travel time is broadly defined as the time required to traverse a route between any two points of interest (Turner, Eisele, Benz, & Holdener, 1998). Travel time can be directly measured by traversing the routes that connects two or more stations along the route. Travel time is usually related to several factors such as characteristics of the driver, the vehicle, traffic incidents, traffic management system, and weather patterns (Turner et al., 1998). Travel time consists of running time and stopped delay time (Turner et.al., 1998).
• Running Time – the travel time when the vehicle is in motion.
• Stopped Delay Time – time when the vehicle is stopped (or moving sufficiently slow as to be stopped)
• The other travel time related to public bus vehicle-trip are (Neils, 2011):
• Driving time – actual driving time from stop to stop including unplanned stopping time between stops.
• Dwell Time – time involved for boarding and alighting at stop.
Passenger ridership is another important service performance indicator to determine the success of a shuttle bus service. Generally, it is known that higher the passenger ridership, greater the acceptability of the services by the passengers. It is important to take note that “identifying significant passenger load points helps indicate whether services are excessive or deficient and thereby assisting service planning and schedule adjustment” (Healy, 2001).
Shuttle Bus Service in IIUM
The shuttle bus services are provided to serve student population who live in the residential areas on-campus to the academic and administrative centres. The total number of buses serving the IIUM community is four covering two different travel routes. One of them connects female Mahallah Ruqayyah (residential area) to academic and administrative centres and the other connects male Mahallah Salahudding to academic and administrative centres. The following sub-sections highlight some of the characteristics of the shuttle bus services provided on-campus.
Bus Exterior and Interior capacity and Seating Design
double-seat (2 + 2) on each side of the bus with approximately 50 cm aisle width. A bus provided with two double-seat arrangement on each side should not normally be used for carrying passengers with standees to avoid discomfort to the bus users (Vuchic, 2007). On the other hand, a bus provided with 2+1 seating arrangement is ideally considered as a better layout for carrying passengers with standees (Vuchic, 2007). Hence, the design layout of the IIUM’s shuttle bus is not appropriate and suitable to transport people on-campus. To add further, the buses are not provided with holding bars for the standing passengers while traveling in the bus.
Distance and Stops of the IIUM Shuttle Bus Routes
IIUM shuttle bus services are provided along two different routes, one serving female residential areas to the core academic and administrative centres and other male residential areas to the core academic and administrative centres. These two routes are named Mahallah Ruqayyah (female residential area) and Mahallah Salahuddin (male residential area). The total distance (one-way) covered along each of the two routes is slightly different. The distance covered by Mahallah Salahuddin (Salahuddin) is slightly longer than Mahallah Ruqayyah (Ruqayyah).
Shuttle Bus Operation
The schedule of bus service is actually based on demand. The schedule of bus services for both routes (Ruqayyah and Salahuddin) is the same. During peak-hour, the bus is scheduled at every 15 minutes and during other hours, more than 15 minutes. It is obviously due to higher demand during peak-hour than other hours. During weekdays, the buses operate 2-3 trips per hour in the morning, evening and night. But on Saturday, the buses operate only in the morning starting at 8 am and ending at 1 pm with less frequency of services. The shuttle bus services for the two routes were operated from Monday to Saturday but no services on Sunday. As indicated earlier, each route was served by two buses to cater for the increased number of passengers especially during peak-hour.
RESEARCH APPROACH
Table 1: Details of field survey
Day Tuesday and Wednesday
(typical days having classes at respective Kuliyyah during weekdays) Time of data
collection
Peak Hour (8.00a.m. – 9.00 a.m.) Off-Peak Hour (9.00 a.m. -10.00 a.m.) Number of
Enumerators
4 enumerators (2 enumerators each for Mahallah Ruqayyah route & Mahallah Salahuddin route.)
For on-board survey, one enumerator records the travel time data and another one records the passenger ridership data.
Travel Time Survey
Travel time survey was administered to measure travel time of the shuttle bus users along each of the two selected routes. The survey was conducted by employing on-board enumerators. The enumerators recorded the travel time of shuttle bus users by using a digital watch. Travel time was measured starting from the first bus stop of each shuttle bus route. Travel time that were measured includes running time (without delay) and journey time (with delay). A standard digital watch showing time in hh:mm:ss was used to measure the travel time of the users. The time taken by the shuttle bus starting from the first stop of the route to the last stop including stoppage time at every bus stop along the route was measured. The stoppage time includes amount of time stopped at the junctions, allowing boarding and alighting of passengers and traffic congestion.
Passenger Ridership Survey
Passenger ridership survey was conducted to count the number of passengers boarding and alighting at each bus stop along the two routes. Enumerators were given the task to count the number of passengers at the starting point of the bus services and whenever passengers boarded and/or alighted at every bus stop along the route. Each enumerator was given a pre-prepared passenger ridership form to record the passenger ridership data. The passenger ridership survey was administered on Tuesday and Wednesday during both peak and off-peak periods. This survey was conducted concurrently with that of travel time survey.
Observational Survey
factors that contribute towards increase in travel time of the shuttle bus services. The factors that cause delay in running shuttle bus services were recorded in a travel time survey form.
Method of Analysis
Univariate analysis technique was applied to describe the variables such as journey time, running time, dwell time and passenger ridership. Some of the techniques used to describe variables are frequency distribution and mean. The findings of these variables were summarized and presented in the form of tables and figures. This study also applies bivariate analysis technique to discern the relationship between selected variables of interest. Cross-tabulation technique was used to identify relationship between schedule and observed travel time and distance of bus stops, dwell time and passenger boarding and alighting. T-test was also applied to test the differences in the journey time of the bus services during peak and off peak hours statistically.
ANALYSIS AND FINDINGS
Travel Time
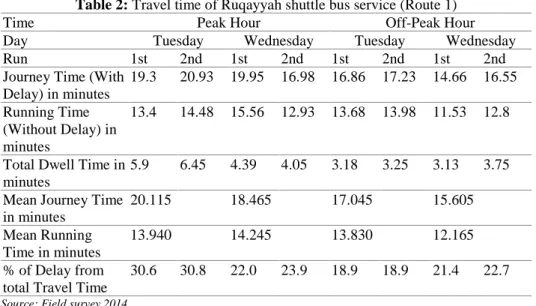
Table 2: Travel time of Ruqayyah shuttle bus service (Route 1)
Time Peak Hour Off-Peak Hour
Day Tuesday Wednesday Tuesday Wednesday
Run 1st 2nd 1st 2nd 1st 2nd 1st 2nd
Journey Time (With Delay) in minutes
19.3 20.93 19.95 16.98 16.86 17.23 14.66 16.55
Running Time (Without Delay) in minutes
13.4 14.48 15.56 12.93 13.68 13.98 11.53 12.8
Total Dwell Time in minutes
5.9 6.45 4.39 4.05 3.18 3.25 3.13 3.75
Mean Journey Time in minutes
20.115 18.465 17.045 15.605
Mean Running Time in minutes
13.940 14.245 13.830 12.165
% of Delay from total Travel Time
30.6 30.8 22.0 23.9 18.9 18.9 21.4 22.7
Source: Field survey 2014
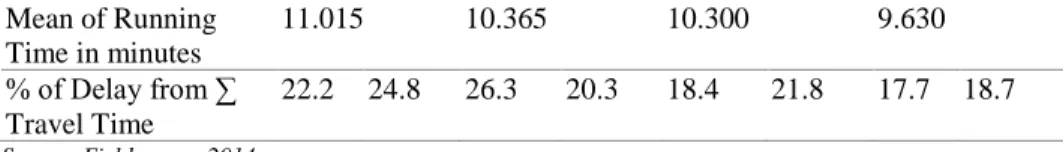
Table 3 shows travel time of shuttle bus service for the other route namely Salahuddin route. It is noticed there exists a considerable gap in the overall travel time in terms of journey and running time between Salahuddin and Ruqayyah. Salahuddin bus route has recorded lower travel time for each run than Ruqayyah. The total journey time including delay time along this route was not more than 15 minutes on each of the two runs on both Tuesday and Wednesday during peak and off peak hour. The highest average journey time was 14.405 minutes on Tuesday during peak hour and the lowest average journey time was 11.6 minutes on Wednesday during off-peak hour. One of the reasons is the number of male users near Salahuddin was lower than the number of female users near Ruqayyah.
Table 3: Travel time of Salahuddin shuttle bus service (Route 2)
Route Peak Hour Off Peak Hour
Day Tuesday Wednesday Tuesday Wednesday
Run 1st 2nd 1st 2nd 1st 2nd 1st 2nd
Journey Time (With Delay) in minutes
14.31 14.5 13.6 13.43 12.56 13.23 11.6 11.95
Running Time (Without Delay) in minutes
11.13 10.9 10.03 10.7 10.25 10.35 9.55 9.71
Total Dwell Time in minutes
3.18 3.6 3.57 2.73 2.31 2.88 2.05 2.24
Mean Journey Time in minutes
Mean of Running Time in minutes
11.015 10.365 10.300 9.630
% of Delay from ∑ Travel Time
22.2 24.8 26.3 20.3 18.4 21.8 17.7 18.7
Source: Field survey 2014
Observed and Scheduled Travel Time
Figure 1 and 2 illustrate the comparison between observed and schedule travel time of the two shuttle bus services. The bus on-board survey was administered to record observed time at each of the bus stop along the two bus routes. The data collected for each route is based on the timing of IIUM shuttle bus schedule during both peak and off-peak hour. The on-time performance analysis is one of the ways to identify the compliance of service adherence to the actual schedule of bus services. The data was collected for two runs during peak hour at 8:15 a.m. and 8:45 a.m. and another two runs at 9:15 am and 9:45 am during off-peak hour. Referring to travel time of Ruqayyah bus route as shown in Figure 1, it can be seen that the shuttle bus departs late in the morning by 19 minutes, where it was scheduled to depart at 8.15 a.m. but the bus departs at 8.34 a.m. This trend is the same for each of the two runs. This difference in the scheduled and observed departure time far exceeds the permissible time differences that can be allowed in achieving the reliability and punctuality of the bus services. One of the reasons for the delay in the departure time of the bus service was due to significant number of passenger boarding and alighting at the bus station. On the other hand, it was noticed that there exists almost no differences in the scheduled and observed time of the shuttle bus services along Salahuddin bus route.
The findings also showed that the bus departs early than the actual scheduled departure time. In one of the runs, the bus departs at 8:31 a.m. from the actual scheduled departure time at 8:45 a.m. Overall, it can be seen that the shuttle bus services are not reliable where at times, the bus departs early or late from the scheduled departure time. Figure 1 and 2 show that the gap between scheduled and observed travel time along both Ruqayyah route and Salahuddin route is small during off-peak hour. However, it is not the case during peak hour especially along Ruqayyah bus route. The unreliable departure time is due to less number of buses being operated especially during peak hour.
Dependent T-Test
Figure 1:Observed and scheduled travel time vs distance Travelled along Ruqayyah bus route
Figure 2: Observed and scheduled travel time vs distance travelled along Salahuddin bus route 08:00:58 08:29:46 08:58:34 09:27:22 09:56:10 10:24:58 T im e (Hrs: M m :S s)
Distance Travelled (km)
Schedule 8:15a.m Observed 8.15a.m. (Tuesday) Observed 8.15a.m. (Wed) Schedule 8:45a.m observed 8.45a.m (Tuesday) observed 8.45a.m (Wed) Schedule 9:15a.m observed 9:15a.m. (Tuesday) observed 9:15a.m. (Wed) 08:09:36 08:38:24 09:07:12 09:36:00 10:04:48 0 9 0 6 .5 1 2 8 2 .5 1 5 3 8 .5 1 7 4 9 .2 1 9 0 3 .8 2 1 7 8 .5 2 6 7 2 .6 3 1 8 8 3 4 5 1 .4 3 5 4 0 .4 3 7 4 8 .4 4 9 5 6 .1 T im e (Hrs: M m :S s)
Distance Travelled (km)
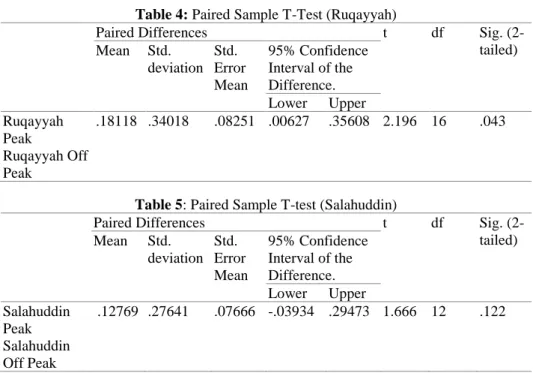
Table 4: Paired Sample T-Test (Ruqayyah)
Paired Differences t df Sig.
(2-tailed)
Mean Std.
deviation Std. Error Mean
95% Confidence Interval of the Difference.
Lower Upper
Ruqayyah Peak
Ruqayyah Off Peak
.18118 .34018 .08251 .00627 .35608 2.196 16 .043
Table 5: Paired Sample T-test (Salahuddin)
Paired Differences t df Sig.
(2-tailed)
Mean Std.
deviation Std. Error Mean
95% Confidence Interval of the Difference.
Lower Upper
Salahuddin Peak Salahuddin Off Peak
.12769 .27641 .07666 -.03934 .29473 1.666 12 .122
The results show that the difference in journey time between peak and off peak hours for Ruqayyah was statistically significant at 95% confidence interval. The t value is 2.196 and p value is 0.043 which is less than 0.05. The findings shows that there exists significant differences in journey time between peak and off peak hour in the case of Ruqayyah bus route.
In the case of Salahuddin bus route, the differences in journey time between peak and off peak hour was statistically insignificant at 95% confidence interval. The t value is1.666 and p value 0.122 which is greater than 0.05. The findings shows that there exists no significant differences in the total journey time between peak and off peak hours in the case of Salahuddin bus route.
Passenger Ridership
Passenger ridership helps to identify the number of passengers boarding and alighting at each bus stop along the route. It also helps to identify overloading and underloading of bus services during each operating schedule of bus service.
Wednesday whereas it was 23 and 24 respectively in the case of Salahuddin bus route.
Table 6:Passenger Ridership along Ruqayyah and Salahuddin route
Hour Peak hour Off Peak hour
Day Tuesday Wednesday Tuesday Wednesday
Run 1st 2nd 1st 2nd 1st 2nd 1st 2nd
Total Passenger Ridership (Ruqayyah)
62 86 81 46 22 24 23 24
Average Passenger Ridership 74 64 23 24
Total Passenger Ridership (Salahuddin)
22 25 21 23 15 17 15 13
Average Passenger Ridership 24 22 16 14
Source: Field Survey, 2014
Relationship between Passenger Ridership and Dwell Time
Figure 3 to 10 shows the relationship between passenger ridership and dwell time of bus services along Ruqayyah bus route. In the case of Ruqayyah bus route, it can be seen that the passenger ridership and dwell time is high at the first stop on Tuesday and Wednesday both during both peak and off peak hour. It has taken 2.5 minutes for 60 passengers to board the bus at the first stop. The findings show that the number of passengers alighting at bus stop 4 and bus stop 13 was generally higher than the other bus stops along this particular route. Bus stop 4 is located close to Kulliyyah (faculty) of Engineering and bus stop 13 close to another Kulliyyah, which is Kulliyyah of Information and Communication Technology. Hence, the time taken for the passengers to alight at these two bus stops was higher than the other bus stops along this route. The findings also show most of the passengers were using this shuttle bus service between bus stop 1 and 13 and very few passengers were using the services from bus stop 14 and bus stop 17. As a result, the dwell time also drops and become almost zero from bus stop 14 to bus stop 17.
Figure 3 & 4:Dwell time vs. passenger ridership Ruqayyah Tuesday peak hour (Run 1 & Run 2)
Figure 5 & 6:Dwell time vs. passenger ridership Ruqayyah Tuesday off peak hour (Run 1 & Run 2)
Figure 9 & 10:Dwell time vs. passenger ridership Ruqayyah Wednesday off peak hour (Run 1 & Run 2)
Figure 11 & 12:Dwell time vs. passenger ridership Salahuddin Tuesday peak hour (Run 1 & Run 2)
Figure 15 & 16:Dwell time vs. passenger ridership Salahuddin Wednesday peak hour (Run 1 & Run 2)
Figure 17 & 18: Dwell time vs. passenger ridership Salahuddin Wednesday off peak hour (Run 1 & Run 2)
DISCUSSION AND CONCLUSION
shows the number of female students using the shuttle bus services was higher than male students.
The general observation shows that many male students were found using motorcycles to travel from their residential areas to academic and administrative centres than female students. Provision of frequent and fast bus services on-campus will actually increase the passenger ridership of bus services.
The analysis on the departure time of bus service according to actual schedule time shows that there exists a considerable gap between actual and observed time schedule of bus services. That makes the total time taken to reach a place longer than what is actually planned for. It is one of the indications showing less number of passengers using the services especially along Salahuddin bus route. To increase the passenger ridership for making the bus services attractive and successful, the adherence to the actual scheduled departure time is highly important which in turn makes the services reliable. Considerable efforts should also be taken to reduce the overall dwell time at each bus stop through application of appropriate measures to reduce the total travel time of the bus services. Unless these proactive measures are taken to increase the reliability of the bus services, the number of users especially students using the bus services will be low and thus it would make the use of motorcars and motorcycles on-campus more attractive.
Some of the measures that can be applied to improve the services of shuttle bus on-campus are: increasing the frequency of shuttle bus during peak hour; installing transit information display board at bus stops to make known real time departure and arrival time of the buses to the users, introducing mini bus services; and lastly applying strict enforcement on the adherence to departure and arrival time at every bus stop by the enforcement agency. These measures are expected to improve the services of shuttle buses on-campus for the purpose of providing reliable and attractive bus services to the campus community. As a result, it improves the environment of the campus area towards realizing sustainable transport on-campus.
REFERENCES
Healy, R. (2001). Passenger counting and service monitoring: A worldwide survey of
transportation agency practices. Brooklyn: MTA New York Transit.
Neils, V. O. (2011). Service reliability and urban public transport design (Doctoral
dissertation). TRAIL Research School, Delft, the Netherland.
Shibayama (2011). Organizational structures of urban public transport – a diagrammatic
comparison and a typology. Journal of the Eastern Asia Society for Transportation
Studies, 9, 126-141.
Turner, M., Eisele, L., Benz, J., & Holdener, J. (1998). Travel time data collection handbook.
Washington, DC: Federal Highway Administration, Office of Highway Information Management.
Vuchic, V. R. (2007). Urban transit systems and technology. New Jersey: John Wiley & Sons