Table of contents
Introduction . . . .2
Incident Management (IM) . . . 2
Introducing IT Analytics . . . 3
Improving Incident Management . . . 3
Conclusion . . . 8
For more information . . . 8
Data tells no tales—improving incident
management with IT Analytics
Introduction
Incidents are bombarding your production environment at an increasing rate, yet staffing is not increasing . How can you reduce the number of incidents and thus improve mean time to resolution? The key lies within the data you already have and a system of Continual Service Improvement (CSI) leveraging IT Analytics . The concept of CSI was introduced in ITIL®
(IT Infrastructure Library) v3 and is concerned with regular, incremental improvement to the quality of the services that IT delivers to the business . For many ITIL adopters, the concept may seem premature . After all, they may feel their ITIL program is too immature to warrant a structured assessment and improvement program . But CSI is crucial to actually attaining the original organizational goals of implementing an ITIL program: without assessing service effectiveness, IT has no concrete idea how well they are meeting business requirements, nor how to identify or prioritize possible improvements to their immature ITIL program to yield the greatest positive impact . Moreover, an effective CSI program starts by optimizing the core ITIL processes, which actualizes payback on the ITIL investment by driving process effectiveness and thereby cost reduction . This paper introduces a new type of technology solution called IT Analytics, which brings CSI into reality for ITIL adopters . This paper will also walk through a demonstration derived from real customer data that shows how the IT Analytics capabilities of HP DecisionCenter software were used to enact significant improvements to the customer’s incident management process, demonstrating how an effective CSI program can enhance a core ITIL process .
Incident Management (IM)
As one of the most fundamental processes defined by ITIL, IM defines how service anomalies are detected, processed, investigated, tracked, and resolved, with the goal of restoring normal operations as quickly as possible with minimum impact to the business . In short, IM is the way IT deals with the everyday issues associated with its services . Other ITIL processes are dependent on IM for their correct function, and so not surprisingly, IM is foundational and one of the first and most commonly deployed processes adopted by ITIL practitioners .
The owner of the IM process, the incident manager (who in smaller organizations may also be the help desk manager), is responsible for ensuring that the IM process is conducted correctly, efficiently, and effectively . This individual is the end-to-end process owner . Like a manufacturing line manager ensuring the line is always moving forward efficiently, the incident manager is responsible for ensuring that all incidents are advanced consistently and according to their priority status . In addition, as described by ITIL® v3 CSI, the incident manager monitors the
performance of the IM process in order to identify and resolve emerging bottlenecks and inefficiencies . Thus, IM establishes a standardized process, but achieving process excellence requires continual improvement . Operational reports are essential to enabling the incident manager to perform his day-to-day duties, such as tracking incidents, understanding incident priority and state volumes, and allocating incidents to support groups . However, operational reports do not provide the data and tools necessary to assess
and maintain the efficiency and effectiveness of the IM process itself . Operational reporting provides the up-to-the-minute data required to operate the process, much like the cockpit of an airplane provides the data necessary to fly the plane . However, in the same way that diagnostic computers are necessary to diagnose problems and optimize the performance of the airplane, a different sort of information is required to identify and resolve IT process problems and inefficiencies . This information must have a historical perspective, showing trends over time . It must correlate data from different sources and different processes, and allow interactive analysis . And it must be
presented in a way that eliminates data overload and enables incident managers to manage by exception, rather than manually sifting through reams of data looking for patterns and anomalies .
Unfortunately, most incident managers lack the analytical tools required to optimize the IM process itself . But the price of not monitoring the IM process is high: A broken or impaired IM process drives IT costs up, productivity down, and puts service level agreements (SLAs) at risk .
Introducing IT Analytics
IT Analytics is a new and powerful direction in processing service management data that leverages data warehousing and Business Intelligence (BI) principles and best practices . IT Analytics instruments key IT processes such as incident management, enabling measurement of their effectiveness and efficiency . It provides a correlated historical view, archiving data from multiple sources to enable analysis of trends over time and across processes . IT Analytics also provides BI tools such as metrics, KPIs, critical success factors (CSFs), dashboards, and
scorecards to allow composite views of process health to be easily calculated and visualized . And finally, IT Analytics supports interactivity, providing drill-down capabilities for ad-hoc analysis . The capabilities of IT Analytics give IT the unprecedented ability to look broader and deeper at its processes in order to identify, analyze, and improve their performance . HP DecisionCenter is one of the first IT Analytics solutions on the market developed exclusively for optimizing IT processes and efficiencies . It comprehensively provides all the described capabilities, as well as out-of-the-box integration with other HP IT solutions such as HP Service Manager software, HP ServiceCenter software, and HP Asset Manager software .
Improving Incident Management
For most organizations, the task of delivering consistent, repeatable processes is daunting enough without considering how they are going to continually improve them . But with the right IT Analytics solution, IT managers finally have the information and tools necessary to truly delve into how well their processes are working, regardless of how mature those processes are . This document will now demonstrate how one IT organization improved its incident management process . The demonstration is derived from actual customer IM data and shows how HP DecisionCenter was used to identify, analyze, diagnose, and fix serious problems in the customer’s IM and related processes that were impacting its ability to run effectively and efficiently and to thereby meet its SLAs . The demonstration also shows how, far from being a distant ideal, a CSI program can have an immediate and significant positive impact on the most fundamental ITIL processes, and how it is easier to implement than might be expected .4
Background
For this demonstration, the customer has been made to look like a financial services firm in order to honor the customer request for anonymity . The firm provides a wide range of investment banking, securities, investment management, and wealth management services and has worldwide reach, serving a broad range of clients including corporations, governments, institutions, and individuals . As you would expect, the customer’s IT organization is large, complex, and responsible for the technology infrastructure of its myriad services . Service disruptions have an enormous financial impact on the customer and its clients, and so the IM process is essential part of the business’ success .
The demo scenario encompasses four months of customer data and contains four categories of incidents . Escalations
Each day, the incident manager logs into HP
DecisionCenter to view his dashboard, which provides at-a-glance visualization of the most pertinent information about the health of the IM process (see Figure 1) . In this case, the incident manager has customized his dashboard to include information about the percentage of first call resolutions, incident aging, and incident volume .
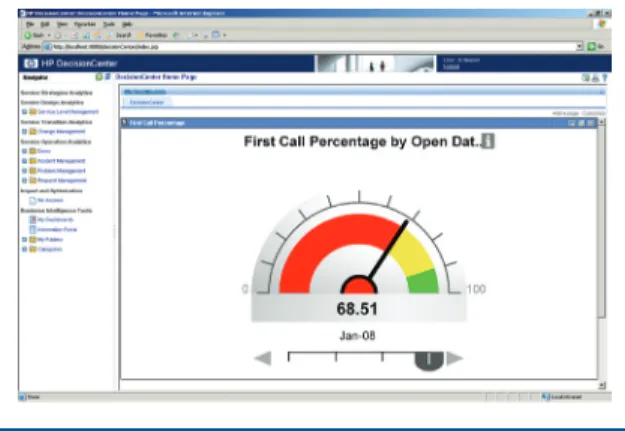
By checking the first call resolution speedometer (see Figure 2), the incident manager can see that too many incidents are not being resolved on the first call . The thresholds that define green (acceptable), yellow (warning), and red (problem) performance are customizable . In addition, alerts can be configured to automatically notify relevant personnel when a critical metric has passed into a red or yellow state .
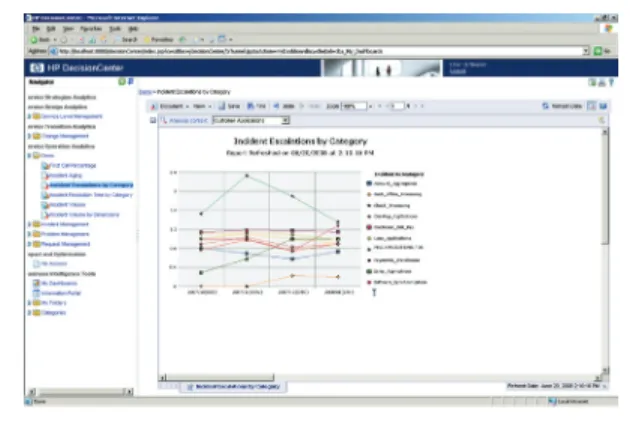
The incident manager wants to investigate the problem further, so he clicks the title of the dashboard panel to drill through to the next level of detail, which is an Incident Escalations by Category analytic (see Figure 3) .
This graph shows the categories of incidents that have the most escalations, which are incident tickets that transfer from one assignment group to another . Escalation rates are a key metric because escalations greatly increase resolution time, affecting cost, customer satisfaction, and SLA conformance . If incidents are not being resolved on first call, it is probable that they are being escalated .
A critical capability of IT Analytics is the ability to interact with the data by drilling down . This allows the incident manager to see the big picture in order to identify trends and anomalies, and then navigate to greater levels of detail to find root causes .
Figure 1: Incident manager dashboard
Figure 2: First call resolution speedometer
In this case, the incident manager can view incident escalations from a variety of vantage points, on the fly . From the Incident Escalations by Category analytic, the manager can drill down into any of the incident categories in the graph . For instance, drilling into the “Customer Applications” category shows the escalation rates for each of the client-facing applications supported by IT (see Figure 4) .
The graph can also be filtered down to show only the top offenders, or presented using a different type of graph or visualization . As you can see, the check processing application had a spike in escalations in November . At this level, incidents averaged greater than two escalations per ticket . This “mis-escalation” means a number of things . It means that it took longer per ticket to resolve check processing incidents, wasting time and money . It also means a potential impact to service levels in the sense that while IM staff was wasting time, it may not have been able to deliver potential service levels to customers . In other words, process effectiveness is required for service effectiveness .
The incident manager next wants to view results by assignment group to see if there are particular departments accounting for the escalations . The incident manager can use a drag-and-drop interface to quickly edit the report, using a cross-tab template and dragging incident subcategory, technician assignment group, and average reassignments objects into place (see Figure 5) .
The results of his ad-hoc changes add a table to the graph that shows the number of escalations for the various assignment groups involved in the incident management process . (see Figure 6) .
The incident manager notes that there were a significant number of escalations for the “Check_Processing” application that appeared to be addressed after November . Based on what he has discovered, the incident manager also suspects that additional training of the first-level agents could reduce the high number of escalations . While the final resolution may require different groups’ involvement to fully diagnose the problem, the data has uncovered a problem that would have gone unnoticed until a customer complaint . Also, it has narrowed the problem down to a more manageable set of applications and assignment groups .
5
Figure 5: Editing the incident escalations cross-tab
Figure 6: Incident escalations cross-tab Figure 4: Incident escalations by category, customer applications
Incident Aging
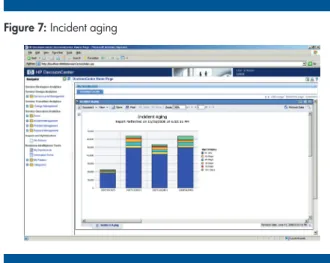
The incident manager now returns to his DecisionCenter dashboard and moves on to the next dashboard panel . Examining the Incident Aging graph (see Figure 7), he notices that there was a spike in the number of incidents in November, and that a significantly larger number of incidents are now taking over 15 days to resolve, which puts other SLAs in jeopardy . Although the number of incidents taking 15 – 30 days to resolve decreased again in January, there is still more than the usual number of incidents open over 30 days .
The incident manager drills down into this report to see the data by week in order to focus on the period when the spike occurred . He needs to characterize the type of incidents that are causing the spike, so he brings up the Incident Resolution Time by Category analytic (see Figure 8) to see which categories of incidents took the longest to resolve . In November, all categories of incidents went up in resolution time, with “Customer Applications” and “Core Systems” incidents having the most impact .
This demonstration illustrates how incident management is a complex, long-running system . A spike in one month can have a persisting effect in subsequent months . For the incident manager in this demo, the November timing and affected categories of the incident spike prompted him to recall the annual change freeze scheduled in December by his IT organization—a common procedure at many companies . Perhaps an increased volume of changes just prior to the freeze (in order to slip changes in under the deadline) adversely affected the incident management process and business customers for months to come . Implementing ITIL successfully requires that organizations consider processes holistically . In this case, the change success rate has a direct impact on the quality of the incident process . The relationship between the number of changes and change success rates can also be shown with HP DecisionCenter, but that data was not yet being included by the customer . The data did, however, arm the incident manager with the information required to identify the problem and focus his subsequent investigations, following up with his change manager counterpart to look into change success rates for November . This would have been difficult to impossible using only operational reports . Incident Volume
The incident manager returns again to his dashboard and turns his attention to the details of the Incident Volume analytic (see Figure 9) .
With this graph he can determine which categories have the largest increase in incident volume, and thus have insight into problematic service categories . The graph indicates that incident volumes for the “Customer” and “Core Systems” application categories have increased significantly . Although the volume dropped some in December, it remained considerably higher than previous periods .
6
Figure 7: Incident aging
Figure 9: Incident volume
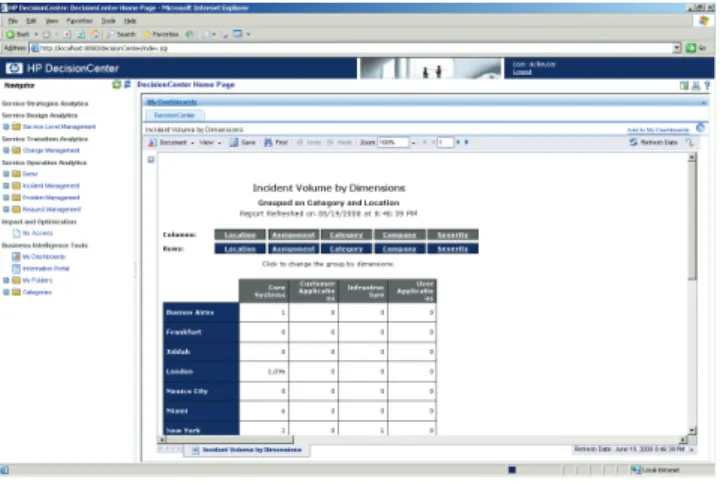
The incident manager needs more detail to assess the rise in volume . Clicking on a data point of interest in the graph, he drills down to the Incident Volume by Dimensions report (see Figure 10) . This report shows the volume of incidents for each application category broken down by dimensions including geographic location, severity, categories, client, and assignment group . By evaluating location and category, he can see that London opened over 1,096 Core Systems incident tickets .
Next, the incident manager selects the “Assignment” dimension on the report in order to determine which assignment groups are receiving the incident volume . The ability to examine data from multiple dimensions, on the fly accelerates the analysis process . He finds that while the “Back-Office” group received over 300 of the Core Systems incidents, all 1,096 of the incidents were routed through the EMEA Service Desk . And by selecting the “Category” and “Severity” dimensions, the incident manager discovers that despite the high volume of incidents, there are not significantly more severe incidents for Core Systems than for other categories . With an unusually high volume of incidents in London passed to two assignment groups, the incident
manager believes that the help desk was overwhelmed by the volume and calls the help desk supervisor to validate this suspicion . It is likely that the help desk overload was also responsible for the increased aging of the incidents . However, the high volume could also indicate defective hardware or software associated with the “Customer” and “Core Systems” services .
Epilog
In this case, the incident manager’s suspicions about the annual December change freeze were correct . The freeze had the effect of greatly increasing the number changes implemented in November, of which a significant portion were unsuccessful causing an increased volume of incidents preceding the freeze . The sheer volume of incidents overwhelmed the help desk, causing adverse results that lingered for months . The demo shows that analysis sometimes does not lead definitively to a single root . Sometimes there is no smoking gun . However, using the IT Analytics capabilities of HP DecisionCenter, the incident
manager was able to identify the problem and perform ad-hoc analysis that strongly suggested potential root causes to focus the investigation . Moreover, the incident manager now had the data to irrefutably demonstrate the long-lasting deleterious effects of the change freeze on the incident management process . As a result, the customer amended the change freeze policies to allow specific types of low risks changes to be processed during the December period, relieving some of the pressure to get changes in prior to the freeze . In addition, the customer is integrating change management and other process data into HP DecisionCenter in order to increase the scope of future root cause analysis and enable greater levels of correlation of inter-process data .
7
Technology for better business outcomes
To learn more, visit www .hp .com/go/btosoftware
© Copyright 2008 Hewlett-Packard Development Company, L .P . The information contained herein is subject to change without notice . The only warranties for HP products and services are set forth in the express warranty statements accompanying such products and services . Nothing herein should be construed as constituting an additional warranty . HP shall not be liable for technical or editorial errors or omissions contained herein . 4AA2-3526ENW, November 2008
Conclusion
ITIL states that the first goal of incident management is to ensure service quality and availability by restoring normal operations as quickly as possible and with the least impact . This goal is in jeopardy when an incident manager does not have sufficient insight into the health of the process to identify problems, causes, and solutions . Insight of this sort is particularly difficult when the problem is caused by another related but separate process, as shown in the demonstration . The same holds true for all ITIL processes . With a complete set of integrated analytics covering all ITIL processes, the potential is realized for holistic process and service improvement including analytics aimed at SLAs . IT Analytics gives IT the ability to extract meaning from its service management data—to
spot the high-level trends and then to drill deeper to identify probable causes and solutions . This makes IT Analytics as realized by HP DecisionCenter ideal for implementing ITIL v3 Continual Service Improvement . The end result is greater operational efficiency, lower costs, and improved IT performance .
For more information
To learn more about HP Software solutions, contact your local HP Software sales representative . To find an HP Software sales office or reseller near you, visit www.hp.com/go/bto-buy
For more information on HP DecisionCenter software, visit www.hp.com/go/continualserviceimprovement