Survival Analysis,
Software
As used here, survival analysis refers to the anal-ysis of data where the response variable is the time until the occurrence of some event (e.g. death), where some of the observations may not yet have experi-enced the event at the time of the analysis (these cases are censored). Analysis of this type of data occurs in many fields, and the general form of analysis has several different names, including reliability analysis (engineering), event history analysis (sociology), and duration analysis (economics). Although the biosta-tistical terminology is used here, many of the cur-rent statistical methods originated in other fields, and some excellent software (some of which is discussed below) is aimed at practitioners in other disciplines. We provide some guidance on jargon, but it cannot be regarded as definitive.
This article has several purposes:
1. It provides a categorization scheme for guiding our discussion of computer packages for survival analysis. Examples of packages in each category are provided.
2. It briefly discusses some special features of some software packages.
3. It provides some guidance on assessing such software and finding information comparing the packages.
A Categorization Scheme for Survival
Analysis Software
The range of software currently available makes any categorization scheme somewhat problematic. The categorization presented here is limited to two dimensions: the purpose aimed at and the method(s) used in achieving the purpose(s):
1. tests comparing time to survival for different groups (e.g. different treatments; (see Hypoth-esis Testing). Most of the packages mentioned in this article have at least one such test. How-ever, they will not be discussed in detail here for the following reasons:
(i) There are numerous such tests and, unfortu-nately, some lack of consistency in naming
them [4, 5].
(ii) There is also some controversy regarding whether they should be used at all. There are two general objections:
(a) Some statisticians are opposed to the use of tests and favor point and inter-val estimation instead.
(b) Many of the tests are just special cases of information available from a more general model (e.g. the log rank test is a score test from a Cox proportional hazards regression)
2. modeling the data for purposes of description and/or estimation/testing; in general, models can be:
(i) nonparametric (Kaplan Meier, Nelson Aalen); most packages that have any claim to analyzing survival data include the Kaplan Meier estimate in some form (ii) semi-parametric (Cox proportional
haz-ards (CPH); see Cox Regression Model); Cox’s 1972 article initiated this entire area, and many packages have at least the most simple version of this. Many packages allow time-dependent (defined) and/or time-varying (internal or ancillary) regressors, which allows one to have Cox-type models without proportional hazards (iii) parametric (Weibull, exponential,
lognor-mal, etc., including accelerated failure time models for the Weibull and exponen-tial distributions); this might also include more traditional censored linear regres-sion models such as Buckley James (bio-statistics), Schmee Hahn (engineering), or Tobit and its generalizations (economics). A comparison of Buckley James and Tobit, showing Buckley James to be gen-erally superior, can be found in Moon [21]. Several other models have been suggested in the biostatistical literature; a comparison by Miller & Halpern [20] again showed the Buckley James procedure to be generally superior.
There are also a number of modeling issues that can be used to distinguish among software packages, including:
above assumes that time is measured continu-ously. If time is clearly discrete (e.g. the issue is granting of tenure, which can only happen once per year), then logistic regression can handle the problem more easily and with easily interpreted results (e.g. [26])
2. use of a counting process formulation. Although this was introduced in Aalen’s 1975 dissertation [1], this has been slow to catch on. Although few packages use this formulation, it has several prac-tical advantages over the traditional formulation (see, for example, [2])
3. estimation via loglinear models, especially logis-tic and Poisson regression [19]. A few packages note these relationships
4. multiple occurrence models (e.g. number of heart attacks and time between them; see Repeated Events). In the literature, there are several ways to model this, but commercial software seems to be limited to the use of the so-called “Huber robust sandwich” [12, 17, 18, 24, 25] estimator of variance after assuming a “working indepen-dence” model
5. competing risks:
(i) Independent risks can be modeled easily by just classifying failure from some other cause as a censored case.
(ii) However, dependent competing risks can-not be modeled in this way.
6. cure models: not everyone will eventually fail via the event of interest. While, especially in medical contexts, it may be reasonable to treat this as a standard, right-censored observation, there are some contexts where it is important to distinguish those who are cured from those still at risk
7. data issues:
(i) left-truncated data and delayed entry: (a) Left-truncated data refers to the
absence, in the data set, of those who failed before a certain time. Usually there is no information, not even a count, on these observations, other than that they exist (e.g. studying the survival of those with heart disease who are referred to a central clinic for treatment; the left-truncated group are those who do not survive long enough to either get a referral or to arrive at the central clinic). The
current standard form of analysis is to condition on arrival at the clinic. However, this provides no help for some interesting questions (e.g. is it worthwhile to expend resources so that people are referred to the central site earlier?). Numerous other examples exist in epidemiology and various social sciences, and there is some literature, including [22]. There is also literature regarding right-truncated data (e.g. products with no problems during the warranty period) and in standard linear regression. The theory is the same in these two cases, changing the direction of time (see [13 16] and [7]).
(b) Delayed entry refers to observations that do not enter the data set until some time after what is defined as time 0. This yields the same statistical problem as left truncation.
(ii) types of censoring: in many data sets, all one really knows about the timing of the event is that it happened between time a and timeb; this is interval censoring and is somewhat more complicated than standard right censoring (some people have not had the event when the analysis is performed). If all data are either interval- or right-censored, then this can easily be treated as discrete-time data. However, if the fail-ure time is known for some cases but only known within an interval for other cases, then there are no clearly superior methods of analysis known, at least when covariates are present. Several variants, with a com-parative assessment, are discussed in [3]. 8. whether the software is special purpose or is part
of an integrated package. The mention, above, of discrete-time methods is one of the reasons we prefer an integrated package: a full analysis of the data may require many different types of analysis in addition to survival analysis. The performance of all the analyses, which may jump between survival and nonsurvival several times, is, at the least, more convenient with an integrated package. Note that “special purpose” as used here refers to the lack of standard descriptive statistics routines; a package that is primarily oriented to
a specific discipline might still be considered general-purpose here.
Capabilities of Existing Software
Packages
For each package mentioned below, we include con-tact information (US information is supplied where available; many have numerous contact sites outside the US also) as well as a table showing which of the above modeling capabilities it has (much of this is from Harrell & Goldstein [10]), although some is from Goldstein et al. [5]. The list is not complete; emphasis was placed on packages that include model-ing procedures, especially Cox’s proportional hazards model. The packages are in alphabetical order.
1. BMDP, SPSS Inc., 444 N. Michigan Ave., Chicago, IL 60611, USA; (312) 329-4000. 2. Egret, Cytel Software Corp., 675 Massachusetts
Avenue, Cambridge, MA 02139, USA; (617) 661-2011.
3. Epicure, HiroSoft International Corp., 1463 E. Republican Ave., Suite 103, Seattle, WA 98112, USA; (206) 328-5301.
4. Epilog Plus, Epicenter Software, PO Box 90073, Pasadena, CA 91109, USA; (818) 304-9487.
5. Limdep, Econometric Software, Inc., 15 Gloria Place, Plainview, NY 11803, USA; (516) 938-5254.
6. NCSS, 329 North 1000 East, Kaysville, UT 84037, USA; (801) 546-0445.
7. SAS, SAS Institute, Inc., Box 8000, Cary, NC 27511, USA; (919) 677-7000.
8. Spida, The Statistical Laboratory, Macquarie University, NSW 2109 Australia; 02-850-8792. 9. S-PLUS, MathSoft, Inc., Data Analysis Prod-ucts Division, 1700 Westlake Avenue North, Suite 500, Seattle, WA 98109, USA; (800) 569-0123.
10. SPSS, SPSS Inc., 444 N. Michigan Ave., Chicago, IL 60611, USA; (312) 329-4000. 11. Stata, Stata Corp., 702 University Drive East,
College Station, TX 77849, USA; (800) 782-8272.
12. Statistica, StatSoft, 2325 East 13th Street, Tulsa, OK 74104, USA; (918) 583-4149.
13. Survival, Salford Systems, 8880 Rio San Diego
Dr., Suite 1045, San Diego, CA 92108, USA; (619) 543-8880.
14. True Epistat, Epistat Services, 2011 Cap Rock Circle, Richardson, TX 75080-3417, USA; (214) 680-1376.
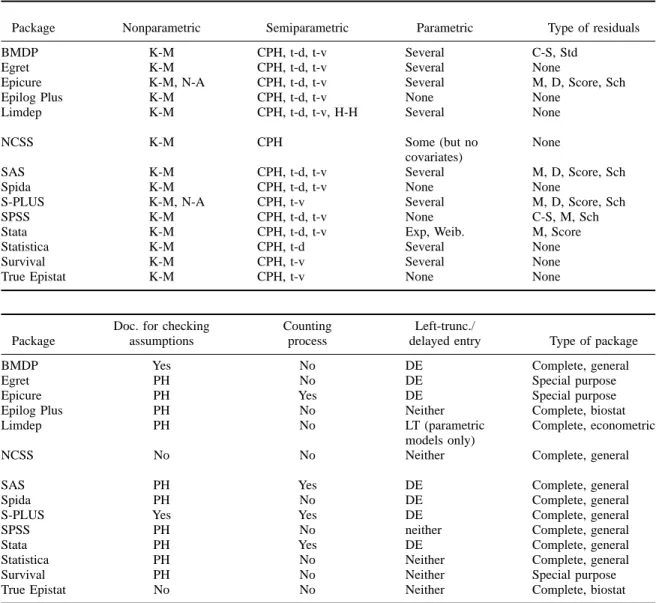
Table 1 shows some of the capabilities of each of the packages. Some of the issues previously discussed are not included in the Table since so few packages have the capability, including:
1. use of the robust sandwich variance estimator: only S-PLUS and Stata have this
2. “cure” models: only Epilog Plus and Limdep have this
3. censored linear regression: most packages have something to handle this, but the options are wide and several packages have more than one relevant technique
4. BMDP version 7 has an option for competing risk models using parametric techniques. The following is a guide to the abbreviations used in Table 1
1. Under “Nonparametric”: “K-M” is the Kaplan Meier product limit estimator; “N-A” is the Nelson Aalen estimator.
2. Under “Semiparametric”: “CPH” is Cox’s pro-portional hazards model; “t-d” means that one can use time-dependent variables in CPH; “t-v” means that one can use time-varying (or, step function) variables in CPH; “H-H” means the Han Hausman estimator [8].
3. Under “Types of Residuals” (discussion of the various residuals for CPH models can be found in [6], [23], and [3]); note that the martingale and Schoenfeld residuals appear to be the most important types as they are particularly useful for checking major regression assumptions; the score residuals are useful in checking for influential observations, as well as for computing sandwich covariance matrix estimates: “C-S” is Cox Snell; “Std” means standardized residuals; “M” is mar-tingale residuals (these are useful for assessing the adequacy of an hypothesized transformation of a predictor variable); “D” is deviance residu-als; “Score” is score residuresidu-als; “Sch” is Schoen-feld residuals, which are useful for testing the PH assumption.
Table 1 Attributes of various packages
Package Nonparametric Semiparametric Parametric Type of residuals BMDP K-M CPH, t-d, t-v Several C-S, Std
Egret K-M CPH, t-d, t-v Several None
Epicure K-M, N-A CPH, t-d, t-v Several M, D, Score, Sch Epilog Plus K-M CPH, t-d, t-v None None
Limdep K-M CPH, t-d, t-v, H-H Several None NCSS K-M CPH Some (but no None
covariates)
SAS K-M CPH, t-d, t-v Several M, D, Score, Sch Spida K-M CPH, t-d, t-v None None
S-PLUS K-M, N-A CPH, t-v Several M, D, Score, Sch SPSS K-M CPH, t-d, t-v None C-S, M, Sch Stata K-M CPH, t-d, t-v Exp, Weib. M, Score Statistica K-M CPH, t-d Several None Survival K-M CPH, t-v Several None True Epistat K-M CPH, t-v None None
Doc. for checking Counting Left-trunc./
Package assumptions process delayed entry Type of package
BMDP Yes No DE Complete, general
Egret PH No DE Special purpose
Epicure PH Yes DE Special purpose Epilog Plus PH No Neither Complete, biostat Limdep PH No LT (parametric Complete, econometric
models only)
NCSS No No Neither Complete, general
SAS PH Yes DE Complete, general
Spida PH No DE Complete, general
S-PLUS Yes Yes DE Complete, general SPSS PH No neither Complete, general
Stata PH Yes DE Complete, general
Statistica PH No Neither Complete, general Survival PH No Neither Special purpose True Epistat No No Neither Complete, biostat
4. Under “Doc[umentation] for checking assump-tions”, the possible entries are: “Yes”, meaning that the testing of both the proportional hazards (PH) assumption and the loglinear assumption are discussed in the manual; “PH”, meaning that only the testing of the PH assumption is dis-cussed; “No”, meaning there is no discussion of testing assumptions in the manual (the user may still be able to test assumptions, but the manual provides no help or guidance).
5. Under “Left-trunc[ation]-delayed entry”: “DE” means that the package can handle observations
whose entry into the risk set is delayed (soft-ware packages that have this capability have it for the Cox model only, not for parametric models); “LT” means that the package can han-dle left-truncated data; “neither” means that the package can’t deal with either delayed entry or left-truncation.
6. While there are no abbreviations under “Type of package”, it is worthwhile to note that pack-ages that are extendable, and have active user communities making extensions, may well have
additional techniques; two of the included pack-ages have such user communities:
(i) S-PLUS: not only was the original routine written by a user (Terry Therneau), but the second author of this article has written a coordinated set of functions for in-depth survival modeling which includes:
(a) relaxing and testing linearity assump-tions using cubic splines
(b) automatic pooled Wald tests (see Likelihood)
(c) bootstrap model validation
(d) presentation graphics for describing models
(see [1] and [9])
(ii) Stata: there were many additions to the prior version, including Bailey Makeham models, which will also work with the cur-rent version; the first author has added cubic splines to Stata’s toolbox.
Where to Go for More Information
There are no good general sources of information on what software is available. Eventually, there will probably be a source on the Internet which can be added to frequently. A recent review [10] cites several other reviews of this software.
It is clear that software for survival analysis is still in a state of flux, with packages having widely varying capabilities and using inconsistent language. Also, several important issues are either not dealt with by any package or are not dealt with to a sufficient degree. However, the software is changing fairly rapidly.
References
[1] Aalen, O.O. (1975). Statistical Inference for a Family of Counting Processes, PhD Thesis. University of Cal-ifornia, Berkeley.
[2] Andersen, P.K., Borgan, O., Gill, R.D. & Keiding, N. (1993). Statistical Models Based on Counting Processes. Springer-Verlag, New York.
[3] Collett, D. (1994). Modeling Survival Data in Medical Research. Chapman & Hall, London.
[4] Dain, B.J., Freeman, D.H. & Vredenburgh, J.J. (1989). Comparison of different packages’ survival test results, in Proceedings of the Statistical Computing Section. American Statistical Association, Alexandria, pp. 315 318.
[5] Goldstein, R., Anderson, J., Ash, A., Craig, B., Har-rington, D. & Pagano, M. (1989). Survival analysis software on MS/PC-DOS computers, Journal of Applied Econometrics 4, 393 414.
[6] Grambsch, P. & Therneau, T. (1994). Proportional haz-ards tests and diagnostics based on weighted residuals, Biometrika 81, 515 526; amendments and corrections in Biometrika 82 (1995), p. 668.
[7] Gross, S.T. & Lai, T.L. (1996). Nonparametric esti-mation and regression analysis with left-truncated and right-censored data, Journal of the American Statistical Association 91, 1166 1180.
[8] Han, A. & Hausman, J. (1988). Semiparametric Estima-tion of DuraEstima-tion and Competing Risk Models. Depart-ment of Economics, MIT, Cambridge, Mass.
[9] Harrell, F.E. (1996). Design: S-Plus functions for bio-statistical/epidemiological modeling, testing, estimation, validation, graphics, prediction, and typesetting by stor-ing enhanced model design attributes in the fit. Avail-able from Statlib,http://lib.stat.cmu.edu. [10] Harrell, F.E., Jr. & Goldstein, R. (1997). A survey
of microcomputer survival analysis software: the need for an integrated framework, American Statistician, to appear.
[11] Harrell, F.E., Lee, K.L. & Mark, D.B. (1996). Multi-variable prognostic models: Issues in developing mod-els, evaluating assumptions and adequacy, and mea-suring and reducing errors, Statistics in Medicine 15, 361 387.
[12] Huber, P.J. (1967). The behavior of maximum likeli-hood estimates under nonstandard conditions, in Pro-ceedings of the Fifth Berkeley Symposium on Mathemat-ical Statistics and Probability. University of California Press, Berkeley, pp. 221 233.
[13] Kalbfleisch, J.D. & Lawless, J.F. (1988). Estimation of reliability in field-performance studies (with discus-sion), Technometrics 30, 365 388.
[14] Kalbfleisch, J.D. & Lawless, J.F. (1991). Regression methods for right truncated data with applications to Aids incubation times and reporting lags, Statistica Sinica 1, 19 32.
[15] Kalbfleisch, J.D. & Lawless, J.F. (1992). Some useful statistical methods for truncated data, Journal of Quality Technology 24, 145 152.
[16] Kalbfleisch, J.K., Lawless, J.F. & Robinson, J.A. (1991). Methods for the analysis and prediction of warranty claims, Technometrics 33, 273 285. [17] Lin, D.Y. (1994). Cox regression analysis of
multivari-ate failure time data: the martingale approach, Statistics in Medicine 13, 2233 2247.
[18] Lin, D.Y. & Wei, L.J. (1989). The robust inference for the Cox proportional hazards model, Journal of the American Statistical Association 84, 1074 1078. [19] Lindsey, J.K. (1995). Fitting parametric counting
pro-cesses by using log-linear models, Applied Statistics 44, 201 212.
[20] Miller, R. & Halpern J. (1982). Regression with cen-sored data, Biometrika 69, 521 531.
[21] Moon, C.-G. (1989). A Monte Carlo comparison of semiparametric Tobit estimators, Journal of Applied Econometrics 4, 361 382.
[22] Nelson, W. (1990). Hazard plotting of left truncated life data, Journal of Quality Technology 22, 230 238. [23] Therneau, T.M., Grambsch, P.M. & Fleming, T.R.
(1990). Martingale-based residuals for survival models, Biometrika 77, 216 218.
[24] White, H. (1980). A heteroskedasticity-consistent vari-ance matrix estimator and a direct test for heteroskedas-ticity, Econometrica 48, 817 830.
[25] White, H. (1982). Maximum likelihood estimation of misspecified models, Econometrica 50, 1 25. [26] Wu, M. & Ware, J.H. (1979). On the use of repeated
measurements in regression analysis with dichotomous responses, Biometrics 35, 513 521.
(See also Software, Biostatistical)