Cardiovascular Disease and Risk Factors
I
ntroductIonIn recent decades, efforts have been made to include diverse popu-lations in clinical research. These ef-forts are important in order to fully understand the disease processes and causes of persistent health dispari-ties among historically underrepre-sented groups, particularly African Americans.1 Many of the existing studies examining how to encourage minorities to participate in research only address recruitment strategies and not retention. A meta-analysis of 95 reports analyzing recruitment and retention of racial/ethnic minorities in clinical research found only 13% involved longitudinal or multi-wave studies.2 Of these longitudinal and multi-wave reports, the majority were clinical trials or prevention trials with relatively short follow-up periods.2 Health disparities cannot be under-stood or adequately addressed
with-out understanding how to recruit and retain minorities in medical research.
The Atherosclerosis Risk in Com-munities (ARIC) Study, a predomi-nantly biracial longitudinal cohort of men and women, provides an op-portunity to examine retention of African American study participants over a 27-year follow-up period and identify some factors associated with retention in comparison with Whites.
among
a
Frican
a
merican
and
W
hite
P
articiPants
in
the
a
therosclerosis
r
isk
in
c
ommunities
s
tudy
(aric) P
rosPective
c
ohort
: 1987-2013
Kristen M. George, MPH1; Aaron R. Folsom, MD1;
Anna Kucharska-Newton, PhD2; Tom H. Mosley, PhD3;
Gerardo Heiss, PhD2
Background: Few studies have addressed retention of minorities, particularly African Americans, in longitudinal research. Our aim was to determine whether there was differ-ential retention between African Americans and Whites in the ARIC cohort and identify cardiovascular disease (CVD) risk factors and indicators of socioeconomic status (SES) as-sociated with theseretention differences.
Methods: 15,688 participants, 27% African American and 73% White, were included from baseline, 1987-1989, and classified as having died, lost or withdrew from study contact, or remained active in study calls through 2013. Life tables were created illustrating retention patterns stratified by race, from baseline through visit 5, 2011-2013. Prevalence tables stratified by race, participation status, and center were cre-ated to examine CVD risk factors and SES at baseline and visit 5.
Results: 54% of African Americans com-pared with 62% of Whites were still in follow-up by 2013. This difference was due to an 8% higher cumulative incidence of death among African Americans. Those who remained in follow-up had the lowest baseline CVD risk factors and better SES, followed by those who were lost/withdrew,
thenthose who died. Whites had lower lev-els of most CVD risk factors and higher SES than African Americans overallat baseline and visit 5; though, the magnitude of visit 5 differences was less.
Conclusions: In the ARIC cohort, reten-tion differed among African Americans and Whites, but related more to mortality dif-ferences than dropping-out. Additional re-search is needed to better characterize the factors contributing to minority participants’ recruitment andretention in longitudinal research. Ethn Dis. 2017;27(1):31-38; doi:10.18865/ed.27.1.31.
Keywords: Attrition; Race; Prospective Cohort; CVD Risk Factors; SES
1 Division of Epidemiology and Community
Health, University of Minnesota, Minneapolis, MN
2 Department of Epidemiology, University of
North Carolina, Chapel Hill, NC
3 Department of Geriatric Medicine,
University of Mississippi, Jackson, MS
Address correspondence to Kristen M. George; 630.740.5079; georg535@umn. edu
Health disparities
cannot be understood
or adequately addressed
without understanding
how to recruit and retain
M
ethodsBetween 1987 and 1989, 15,792 participants were enrolled into the ARIC prospective cohort using prob-ability sampling of individuals, aged 45 to 64 years, from Forsyth County, NC, Jackson, MS, the northwestern suburbs of Minneapolis, MN, and Washington County, MD.3 Afri-can AmeriAfri-cans only were recruited in Jackson, whereas the Minneapo-lis and Washington County samples were overwhelmingly White. The Forsyth County sample included both Whites and African Ameri-cans. A previous report showed that initial recruitment and baseline par-ticipation in the ARIC cohort was 46% for African Americans and 67% for Whites, and factors asso-ciated with lower participation
in-cluded lower education, smoking, lower income, and reporting poor overall health.4 The differences in cardiovascular risk factors between respondents and non-respondents were greater among Whites than among African Americans.4 Among those who did participate at ARIC baseline, African Americans had higher prevalence of many cardiovas-cular risk factors than did Whites.5 Following cohort participants’ informed consent, ARIC assessed cardiovascular disease (CVD) and CVD risk factors at up to five clinic visits (1987-89, 1990-92, 1993-95, 1996-98, 2011-13) with occasional additional visits for ancillary ex-aminations in subsets of the cohort. These visits typically lasted 3-6 hours and included interviews, physical ex-aminations, and imaging studies. Of
note, there were two additional op-portunities for brain imaging in Af-rican AmeAf-ricans. In an ongoing fash-ion, ARIC also conducted annual or semi-annual telephone follow-up contacts, lasting about 15 minutes, to enhance retention and to identify incident and fatal events. Although all study procedures were standard-ized, interviewer techniques were tai-lored to the needs of individual com-munities.The two ARIC centers with African American participants used a variety of strategies to encourage continued cohort attendance, includ-ing participation appreciation events, community engagement efforts, and race-matched recruiters, interview-ers, and clinical exam staff (Table 1). For the analyses presented in this article, we excluded non-White and non-African American participants,
Table 1. Strategies used for ARIC retention, 1987-2013
General Promotion
Highlighted National Institutes of Health and University sponsorship and created an ARIC identity with a study logo Promoted the altruistic and personal benefits of participation in important health research.
Issued periodic press releases about ARIC or its findings Created a study website and referred to information therein Conducted occasional town meetings with the cohort (some centers) Mailed a study newsletter periodically and sent annual birthday cards
Techniques to Maintain Contact
Obtained and updated participants’ contact information at examinations 15-minute phone calls to maintain contact annually to semi-annually If required, made multiple attempts to contact participants when telephoning Traced participants via commercial sources when need be
Left open the opportunity to return to the study if participation became temporarily difficult Involved proxy telephone respondents when cohort members needed help
Specific Examination Strategies
Made every attempt to minimize participant time and burden by keeping exams short lasting 3-6 hours Ensured staff diversity and professionalism
Offered transportation to examinations as the cohort aged Offered financial incentives to participate in later years
Provided a snack and study tokens (eg, refrigerator magnets, water bottles)
Returned clinically relevant examination results to participants and their health providers
leaving 15,688 individuals whose censoring status was tracked from baseline, 1987-89, through visit 5, 2011-13. Our first aim was to il-lustrate the retention rates of ARIC participants from baseline through visit 5 stratified by race. Race-spe-cific life-tables were created, show-ing, over time, the proportions of participants who died, were lost/ withdrew from continued contact, or remained in follow-up (ie, continued study phone calls) through 2013. The date of death was obtained and reflected in decedents’ censor dates. Censor dates for those who were lost/withdrew and for the group who remained in follow-up, were deter-mined from the last date of known status. To ensure that those who were lost/withdrew had not died, National Death Index (NDI) searches were periodically conducted to identify deaths among cohort participants.
Among those who lost/withdrew, very few were lost; the majority voluntarily withdrew from further ARIC contact. Participation rates at each of the five examination visits were plotted as the number who took part in the visit divided by the num-ber estimated to be alive at the time. Our second aim was to describe retention in relation to baseline char-acteristics. We described prevalences or means and standard deviations of socioeconomic and cardiovascular disease risk factors, including educa-tion, income, reported health, leisure and sport activity, smoking status, al-cohol consumption, obesity, diabetes, hypertension, and plasma cholester-ol, measured by ARIC’s standardized methods, stratified by race, by center among African Americans, and by
the three retention groups. We as-sessed baseline prevalences stratifying African Americans by center to high-light the heterogeneity within the race group. Characteristics of partici-pants from these two centers notably differed and stratification offered a more nuanced view of retention dif-ferences within the African American cohort as well as between African Americans and Whites. Character-istics of White participants did not appreciably differ between centers. Our third aim was to deter-mine how attrition between 1987 and 2013 affected the previously reported risk factor differences ob-served at baseline between African Americans and Whites. We analyzed the same CVD risk factors assessed at baseline at visit 5, stratified by race, and by center among African Americans, between those who at-tended the visit. Stratification by center among African Americans was carried out for reasons listed above.
r
esultsAt baseline visit 1 during 1987-89, African American participants represented 27% of the total cohort of 15,688 with 24% from Jackson, MS and 3% from Forsyth County, NC, whereas White participants represented 73%. 55% of the co-hort was female, 45% male, and the mean baseline age was 54.2 years old with a range of 45 to 64 years old. By visit 5 during 2011-13, there were 6,415 total participants, 23% African American, with 22% from Jackson, MS and 1% from Forsyth County, NC, and 77% White
par-ticipants. Women made up 59% of the cohort, 41% male, and the mean age was 75.8 years of age (range 66 to 90). Of those examined at ARIC visit 5, 91% of participants underwent a full clinic examina-tion, 3% had abbreviated clinic ex-aminations, and 6% were examined in their homes or care facilities.
Race-specific Retention over
ARIC Follow-up Period
As shown in Figure 1, among Af-rican AmeAf-rican participants, 54% remained in follow-up by visit 5, 35% had died by or during visit 5, and 11% were lost/withdrew from the study. Among White participants (Figure 2), 62% remained in follow-up through visit 5, 26% had died by or during visit 5, and 12% were lost/ withdrew from the study. Thus, over-all, African Americans were less likely to still be in follow-up in the study by visit 5, mainly because they were more likely to have died over the follow-up period. African American and White participants were lost/withdrew from the study at similar propor-tions through the most recent exam. Notably, participation in each of the five examination visits among those who remained in follow-up tended to be lower in African Ameri-cans than Whites (Figure 1). At visit 5, 89% of African Americans still in follow-up in ARIC completed a full or abbreviated ARIC examina-tion, compared to 93% of Whites.
Association of Baseline CVD
Risk Factors with Retention
Categories
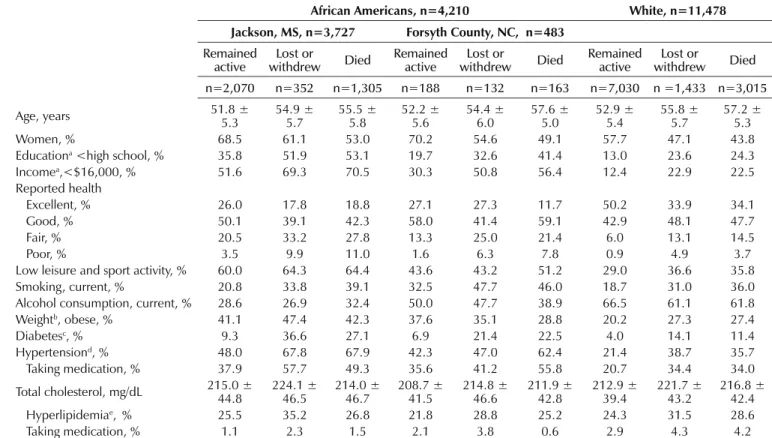
died by visit 5 were, on average, the oldest, followed by those who were lost/withdrew, and those who re-mained in follow-up. This was true
for both Jackson and Forsyth Af-rican AmeAf-ricans and was mirrored in the White cohort. Women made up a greater proportion of
partici-pants remaining in follow-up and a smaller proportion of those who died. Education and income were lowest among Jackson participants, followed by Forsyth County partici-pants, and considerably lower overall than Whites. Reported health among both cohorts of African Americans was worse, on average, than the re-ported health of Whites.Poor health was most prevalent among those who died or were lost/withdrew. The level of leisure activity was lowest among Jackson participants, followed by Forsyth participants, then White participants. Those
V 1 V 2
V 3 V 4
V 5
0% 10% 20% 30% 40% 50% 60% 70% 80% 90% 100%
1 3 5 7 9 11 13 15 17 19 21 23 25
Years Aer Visit 1
Died
Lost or Withdrew Remained Acve Visit Parcipaon
Figure 2. Participation of Whites through visit 5
V 1
V 2
V 3 V 4
V 5
0% 10% 20% 30% 40% 50% 60% 70% 80% 90% 100%
1 3 5 7 9 11 13 15 17 19 21 23 25
Years Aer Visit 1
Died
Lost or Withdrew Remained Acve Visit Parcipaon
Figure 1. Participation of African Americans through visit 5
Reported health among
both cohorts of African
Americans was worse, on
average, than the reported
health of Whites.
among those who were lost/withdrew than the other two retention catego-ries, across all race and center groups.
Race Differences in CVD
Risk Factors among Visit 5
Participants
Although African Americans had more attrition due to death during ARIC follow-up, the disparity in risk factors between African Americans and Whites, and between Jackson and Forsyth African Americans, seen
at baseline were still apparent at visit 5 (Table 3). Among visit 5 partici-pants, more Whites reported excel-lent or good health than did African Americans, while, among African Americans, more Jackson participants reported excellent health but more Forsyth participants reported good health than did those from Jackson. African Americans compared with Whites at visit 5 were more likely to have low levels of physical activity, be current smokers, but were less likely to be current drinkers. African Amer-icans had more prevalent obesity,
diabetes, and hypertension. Notably, while African Americans had higher average total cholesterol concentra-tions, those in the Jackson cohort had less prevalent hyperlipidemia than those in the Forsyth cohort and Whites, both of whom had preva-lences of hyperlipidemia of 11%.
d
IscussIonRetention in the ARIC cohort over the 27 years of follow-up has been good. Yet, there were
differenc-Table 2. Prevalence of CVD risk factors at baseline visit 1, 1987 through 1989, stratified by race, center, and status at visit 5, 2011 through 2013, ARIC
African Americans, n=4,210 White, n=11,478 Jackson, MS, n=3,727 Forsyth County, NC, n=483
Remained
active withdrewLost or Died Remained active withdrewLost or Died Remained active withdrewLost or Died
n=2,070 n=352 n=1,305 n=188 n=132 n=163 n=7,030 n =1,433 n=3,015
Age, years 51.8 ± 5.3 54.9 ± 5.7 55.5 ± 5.8 52.2 ± 5.6 54.4 ± 6.0 57.6 ± 5.0 52.9 ± 5.4 55.8 ± 5.7 57.2 ± 5.3
Women, % 68.5 61.1 53.0 70.2 54.6 49.1 57.7 47.1 43.8
Educationa <high school, % 35.8 51.9 53.1 19.7 32.6 41.4 13.0 23.6 24.3
Incomea,<$16,000, % 51.6 69.3 70.5 30.3 50.8 56.4 12.4 22.9 22.5
Reported health
Excellent, % 26.0 17.8 18.8 27.1 27.3 11.7 50.2 33.9 34.1
Good, % 50.1 39.1 42.3 58.0 41.4 59.1 42.9 48.1 47.7
Fair, % 20.5 33.2 27.8 13.3 25.0 21.4 6.0 13.1 14.5
Poor, % 3.5 9.9 11.0 1.6 6.3 7.8 0.9 4.9 3.7
Low leisure and sport activity, % 60.0 64.3 64.4 43.6 43.2 51.2 29.0 36.6 35.8
Smoking, current, % 20.8 33.8 39.1 32.5 47.7 46.0 18.7 31.0 36.0
Alcohol consumption, current, % 28.6 26.9 32.4 50.0 47.7 38.9 66.5 61.1 61.8
Weightb, obese, % 41.1 47.4 42.3 37.6 35.1 28.8 20.2 27.3 27.4
Diabetesc, % 9.3 36.6 27.1 6.9 21.4 22.5 4.0 14.1 11.4
Hypertensiond, % 48.0 67.8 67.9 42.3 47.0 62.4 21.4 38.7 35.7
Taking medication, % 37.9 57.7 49.3 35.6 41.2 55.8 20.7 34.4 34.0
Total cholesterol, mg/dL 215.0 ± 44.8 224.1 ± 46.5 214.0 ± 46.7 208.7 ± 41.5 214.8 ± 46.6 211.9 ± 42.8 212.9 ± 39.4 221.7 ± 43.2 216.8 ± 42.4
Hyperlipidemiae, % 25.5 35.2 26.8 21.8 28.8 25.2 24.3 31.5 28.6
Taking medication, % 1.1 2.3 1.5 2.1 3.8 0.6 2.9 4.3 4.2
a. Based on self-report during visit 1.
b. Based on BMI < 18.5 kg/m2 for underweight, 18.5 – 24.9 kg/m2 for normal weight, 25 – 29.9 kg/m2 for overweight, and > 30 kg/m2 for obese at visit 1.
c. Diabetes defined as non-fasting blood glucose > 200 mg/dL, fasting blood glucose > 126 mg/dL, self-report of diabetes, or reporting takin medication for diabetes or high blood sugar at visit 1.
Table 3. Prevalence of cardiovascular disease risk factors at visit 5, 2011 through 2013, stratified by race and center, ARIC
African American, n=1,499 White, n=4,916 Jackson, MS, n=1,401 Forsyth County, NC, n=98
Age, years 75.1 ± 5.2 75.0 ± 5.4 76.0 ± 5.3
Women, % 68.0 64.3 56.2
Reported health
Excellent, % 13.7 8.3 26.7
Good, % 51.0 75.0 56.7
Fair, % 31.4 8.3 14.3
Poor, % 3.9 8.3 2.3
Leisure & sport activity
Low leisure & sport, % 43.0 36.5 35.3
Smoking
Current smoker, % 6.9 6.5 5.4
Alcohol consumption
Current drinker, % 18.8 21.0 57.8
Weighta
Obese, % 46.9 40.7 31.6
Diabetesb, % 41.2 38.0 25.6
Hypertensionc, % 88.2 87.6 70.8
Taking medication, % 88.1 86.6 72.1
Total cholesterol, mg/dL 184.2 ± 40.2 182.9 ± 43.0 180.7 ± 7
Hyperlipidemiad, % 8.2 11.2 11.1
Taking medication, % 53.6 52.6 56.7
a .Based on BMI < 18.5 kg/m2 for underweight, 18.5 – 24.9 kg/m2 for normal weight, 25 – 29.9 kg/m2 for overweight, and > 30 kg/m2 for obese at visit 5.
b. Diabetes defined as non-fasting blood glucose > 200 mg/dL, fasting blood glucose > 126 mg/dL, self-report of diabetes, or reporting taking medication for diabetes or high blood sugar at visit 5.
c. Diastolic blood pressure > 90 mm Hg, systolic blood pressure > 140 mm Hg, or use of hypertensive medication at visit 5. d. Total cholesterol > 240 mg/dL at visit 5.
es in the proportions of White and African American ARIC participants who took part in each of the five ex-amination visits. A main contributor to differences in retention was the 8% higher cumulative risk of death among African Americans compared with Whites despite African Ameri-cans and Whites being classified as lost/withdrew at about the same proportions. Racial differences in mortality are closely related to socio-economic status as well as risk factors associated with CVD and total mor-tality.6 African Americans from Jack-son and Forsyth County who died by visit 5 had the highest risk factors for CVD compared with African Ameri-cans who were lost/withdrew and
those who remained in follow-up. African Americans also had higher levels of CVD risk factors at baseline than White participants overall, and this pattern persisted to ARIC visit 5. Poorer participation in exams and poorer longitudinal retention of African American participants in co-hort studies may be related to poorer health, lower socioeconomic status, as well as other social and behavioral factors that should be considered when designing and implementing longitudinal research. These differ-ences, particularly related to mortal-ity, require changes to study design as well as analysis to fully account for potential bias. While there are effec-tive statistical methods to deal with
Being able to identify factors impor-tant in predicting retention among ARIC participants who remained active and those who were censored helps pinpoint how racial/ethnic subgroups differ and how these dif-ferences may affect study results. ARIC has used a variety of strate-gies to boost study retention (Table 1) including annual or semi-annual telephone contact, annual birthday cards, opportunities to return to the study if participation was temporar-ily difficult, culturally aware and pro-fessional research staff, and returning clinically relevant examination re-sults to participants and their health-care providers. Despite these efforts to enhance retention, understand-ing the most cost-effective strategies to retain diverse study participants deserves more adequate study. A meta-analysis of 24 clinical trials that included African American partici-pants, with follow-up times ranging from 3 months to 5 years (median of 34 months), had an average drop-out rate of 23.3%.7 Reasons for drop-out included personal obligations, loss to follow-up, non-compliance with study requirements, and monetary or other incentives for participation that participants considered too low.7 Retention strategies reported were similar to those used in ARIC and focused on building rapport with participants and maintaining fre-quent, thoughtful communication while trying to keep the burden of participation low.7 While the clinical trials examined were much shorter than ARIC, many of the issues sur-rounding retention were the same. There are some limitations to the ARIC data. The categories for
‘remained in follow-up,’ ‘lost/with-drew,’ and ‘died’ did not take into account the completeness of partici-pation. ARIC followed participants by telephone even if they did not at-tend or refused to complete an exam. Within the group that remained nominally in follow-up, there may have been important differences be-tween those who attended every clin-ic exam and those who refused one or more exams. We showed that African Americans who still participated in telephone interviews were less likely to participate in clinic visits than Whites. This suggests that despite differential loss due to death between African Americans and Whites, con-siderations surrounding retention are still relevant in understanding the higher number of African Ameri-cans than Whites still in follow-up who are not fully participating. We also did not differentiate between those who were lost to follow-up and those who voluntarily withdrew from the study as those numbers were relatively small, but these two groups may, in fact, have impor-tant differences. Finally, we could not study other ethnic groups due to their small numbers. It is unclear whether the differences in retention seen in African Americans would apply to other race-ethnic groups.
c
onclusIonExamination of factors associated with retention among the African American and White ARIC partici-pants over the course of an extended follow-up revealed that disparities evident during the baseline study
visit persisted and may have contrib-uted to differential retention rates. Unbiased assessment of the associa-tion of risk factors with outcomes in diverse longitudinal cohorts requires employment of targeted population-sensitive retention strategies and de-tailed assessment of factors that may contribute to differential attrition.
Conflict of Interest
No conflicts of interest to report.
Author Contributions
Research concept and design: George, Folsom, Kucharska-Newton; Acquisition of data: George, Folsom, Mosley; Data analysis and interpretation: George, Heiss; Manuscript draft: George, Mosley, Heiss; Statistical expertise: George; Acquisition of funding: Mosley, Heiss; Supervision: Folsom, Kucharska-Newton; Administrative: George, Folsom
References
1. Heiat A, Gross CP, Krumholz HM. Repre-sentation of the elderly, women, and minori-ties in heart failure clinical trials. Arch Intern Med. 2002;162(15):1682-1688. http:// dx.doi.org/10.1001/archinte.162.15.1682. PMID:12153370.
2. Yancey AK, Ortega AN, Kumanyika SK. Effective recruitment and reten-tion of minority research participants.
Annu Rev Public Health. 2006;27(1):1-28. http://dx.doi.org/10.1146/an-nurev.publhealth.27.021405.102113. PMID:16533107.
3. The ARIC investigators. The Atherosclerosis Risk in Communities (ARIC) Study: design and objectives. The ARIC investigators. Am J Epidemiol. 1989;129(4):687-702. http:// dx.doi.org/10.1093/oxfordjournals.aje. a115184. PMID:2646917.
4. Jackson R, Chambless LE, Yang K, et al; The Atherosclerosis Risk in Communities (ARIC) Study Investigators. Differences between respondents and nonrespondents in a multicenter community-based study vary by gender ethnicity. J Clin Epidemiol. 1996;49(12):1441-1446. http://dx.doi. org/10.1016/0895-4356(95)00047-X. PMID:8970495.
relationship with cardiovascular disease inci-dence. J Am Coll Cardiol. 2011;57(16):1690-1696. http://dx.doi.org/10.1016/j.
jacc.2010.11.041. PMID:21492767. 6. Crimmins EM, Saito Y. Trends in healthy
life expectancy in the United States, 1970-1990: gender, racial, and educational differences. Soc Sci Med. 2001;52(11):1629-1641. http://dx.doi.org/10.1016/S0277-9536(00)00273-2. PMID:11327137. 7. Otado J, Kwagyan J, Edwards D, Ukaegbu
A, Rockcliffe F, Osafo N. Culturally compe-tent strategies for recruitment and recompe-tention of African American populations into clinical trials. Clin Transl Sci. 2015;8(5):460-466. http://dx.doi.org/10.1111/cts.12285. PMID:25974328.