IMPACTS OF HIGH TEMPERATURES ON CAUSE-SPECIFIC EMERGENCY DEPARTMENT VISITS IN NORTH CAROLINA
Steven J. Lippmann
A dissertation submitted to the faculty at the University of North Carolina at Chapel Hill in particial fulfillment of the requirements for the degree of Doctor of Philosophy in the
Department of Epidemiology in the Gillings School of Public Health.
Chapel Hill 2015
Approved by:
David B. Richardson
Charles E. Konrad
Charles Poole
Scott K. Proescholdbell
ABSTRACT
Steven J. Lippmann: Impacts of High Temperatures on Cause-Specific Emergency Department Visits in North Carolina
(Under the direction of David B. Richardson)
Background: High ambient temperature is associated with a number of physiological and
psychological responses that may influence the occurrence of emergency department visits. This
dissertation project uses a cause-specific approach to assess the exposure-response associations
between high ambient temperature and a wide range of disease and injury types, with the aim of
more fully describing the impact of heat on emergency department visits in North Carolina. The
first aim of this dissertation focuses on temperature and injury-related emergency visits. The
second aim focuses on temperature and a nearly comprehensive set of diagnosis groups.
Methods: Data on emergency department visits in North Carolina between April 1st and
October 31st in 2008-2013 were ascertained from a statewide surveillance system.
County-specific daily mean temperature data were obtained from meteorological archives. For Aim 1,
injury visits were classified by intent and mechanism using external cause of injury codes. For
Aim 2, visits were categorized into diagnosis groups using the Clinical Classification Software
system. Age- and sex-stratified exposure-response trends for the associations between
temperature and emergency department visits were quantified using Poisson regression
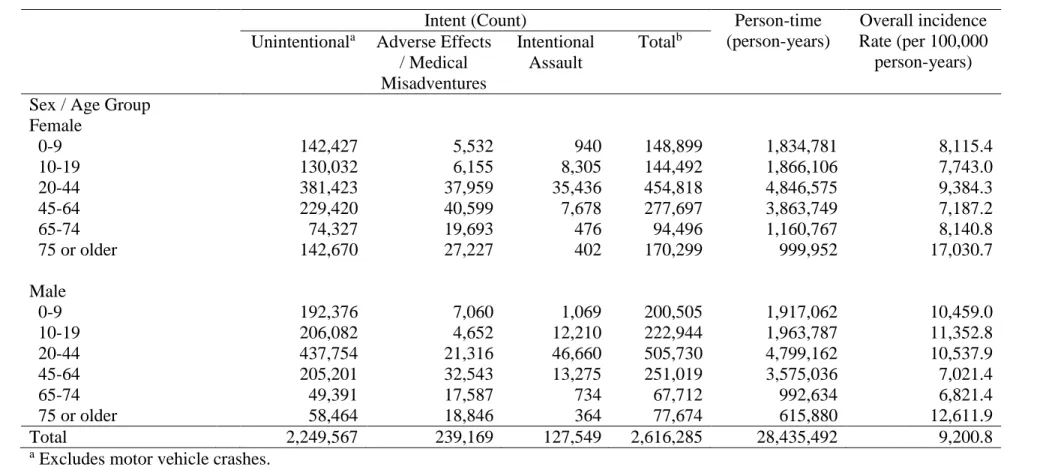
Results: Over 13 million emergency department visits were categorized. In the first aim,
unintentional injuries due to drowning among children were positively associated with
temperature, as were bites and stings and excessive heat in all age groups. Adverse medical
adolescents and young adults was positively associated with temperature. In the second aim,
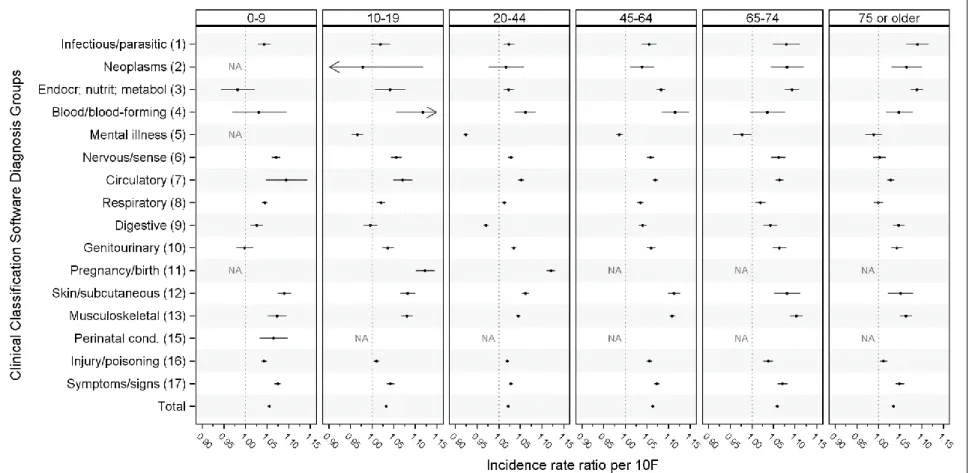
Injury/Poisoning and Symptoms/Signs were leading causes of ED visits in all ages, and
Circulatory diagnoses ranked highest in patients ≥65 years old. The exposure-response patterns
for nearly all age and diagnosis combinations were reasonably well described by a linear
function of temperature and most of these associations were positive. Mental illness was the only
diagnosis group that was inversely associated with temperature in all age groups.
Conclusions: This study offers strong evidence of positive associations between daily
mean temperatures and wide range of conditions resulting in emergency care, and highlights the
ACKNOWLEDGMENTS
Sincere gratitude is due to Dr. David Richardson, Chair and Advisor, for introducing me
to the topic of temperature and health, and for knowing the right mix of patience and prodding to
guide me through this dissertation process. To Dr. Charlie Poole, for teaching me the
fundamentals of epidemiologic methods, and for giving me the opportunity to teach those skills
to others as a teaching assistant. To Dr. Anna Waller, for providing support, encouragement, and
mentorship during my years as a graduate research assistant, and for continuing to provide office
space while I worked on the dissertation. To Dr. Chip Konrad, for educating this Northerner on
the geography and climate of the North Carolina and for helping me sort through the
meteorological data. To Scott Proescholdbell, for providing his expertise in injury data in the
state and for dedicating his time to giving swift and supportive feedback at many points
throughout the project.
My completion of this project is due in large part to the support of my wife Amy, who
carried our family on her shoulders throughout my education at UNC. Thank you for always
being there as my cheerleader, my safety net, and my friend during those long periods where it
wasn’t clear when, or if, I would ever see the light at the end of this tunnel. This work is also
dedicated to my daughters, Sydney and Abby, whose developmental milestones were like mile
markers on the road to graduation.
To my parents, Frank and Fannie Lippmann, and to my in-laws, Stanley and Judy Jacobs,
and my brother-in-law and sister-in-law, Alan Jacobs and Antje Ellermann, for showing interest
and enthusiasm about this project as it developed.
The support of many other people was crucial to my reaching this point:
The staff at NC DETECT (Amy Ising, Clifton Barnett, Dennis Falls, and Shaun Mason),
as well as fellow graduate research assistants (Katie Harmon, Sarah Rhea, and Jennifer Jones) for
helping me understand the intricacies of the data and providing a social outlet in what would
otherwise be a solitary endeavor. Karin Yeatts, whose mentorship and cheerleading kept me on
the path towards this goal. Debbie Travers, who introduced me to the Clinical Classification
Software. Early mentors Stephen Marshall and Carol Runyan for giving me a solid foundation in
injury epidemiology upon which I built parts of this dissertation. Ryan Boyle and Ashley Hiatt
from the State Climate Office for providing the meteorological data. Lauren Thie of the NC
Division of Public Health, for her keen interest in this topic and her annual tracking of
summertime heat-related illness emergency department visits in the state. David Hemenway,
Matthew Miller, Deborah Azrael, Angela Browne, and Cathy Barber of the Harvard Injury
Control Research Center, who embraced me as a research assistant, nurtured my interest in
public health, and launched me on this journey. Epidemiology friends Petra Sander, Sudha
Raman, and Yvonne Golightly, and the rotating cast of my dissertation support group: Kim
Gaetz, Anne Hakenwerth, Kirstin Huiber, Sarah Rhea, Peter Samai, Leah Schinasi, and Jonathan
Todd. I am indebted to the continual support of the department’s student services staff: Nancy
Colvin, Carmen Woody, and Valerie Hudock.
This dissertation project was partially supported by the Robert Verhalen Scholarship in
Award. The early part of my MSPH/PhD training was supported by a training grant from the
National Institute of Occupational Safety and Health.
Disclaimer: The North Carolina Disease Event Tracking and Epidemiologic Collection Tool (NC
DETECT) is an advanced, statewide public health surveillance system. NC DETECT is funded
with federal funds by North Carolina Division of Public Health (NC DPH), Public Health
Emergency Preparedness Grant (PHEP), and managed through collaboration between NC DPH
and the University of North Carolina at Chapel Hill Department of Emergency Medicine's
Carolina Center for Health Informatics (UNC CCHI). The NC DETECT Data Oversight
Committee does not take responsibility for the scientific validity or accuracy of methodology,
TABLE OF CONTENTS
LIST OF TABLES ... xi
LIST OF FIGURES ... xii
LIST OF ABBREVIATIONS ... xiv
CHAPTER 1. SPECIFIC AIMS ... 1
CHAPTER 2. BACKGROUND ... 3
2.1. Overview ... 3
2.2. Temperature and Injury and other External Causes ... 5
2.2.1 Introduction ... 5
2.2.2 Epidemiological Studies ... 5
2.2.3 Studies from Related Fields ... 6
2.2.4 Heat and Violence ... 8
2.3. Temperature and Cause-Specific Mortality/Morbidity ... 9
CHAPTER 3. METHODS ... 12
3.1. Study Design ... 12
3.1.1 Study Designs in Existing Literature ... 12
3.1.2 Study Design for this Project ... 13
3.2. Study Setting and Population ... 13
3.3. Data Sources and Acquisition ... 14
3.3.1.1. Categorization of Injury Types (Aim 1) ... 16
3.3.1.2. Categorization of ICD-9-CM Diagnosis Codes (Aim 2) ... 18
3.3.2 Exposure Data: Meteorological Data ... 20
3.3.2.1. Temperature Metrics ... 20
3.3.2.2. Meteorology Data ... 21
3.3.3 Population Estimates ... 24
3.4. Data Examination and Quality Assurance ... 24
3.5. Statistical methods ... 26
3.5.1 Data Transformations... 26
3.5.2 Statistical Analysis ... 28
CHAPTER 4. TEMPERATURE, INJURIES, AND ADVERSE EFFECTS ... 31
4.1. Introduction ... 31
4.2. Methods... 32
4.2.1 Study Setting ... 32
4.2.2 Meteorological Data ... 32
4.2.3 Emergency Department Visit Data ... 34
4.2.4 Outcomes of interest ... 35
4.2.5 Census data ... 36
4.2.6 Statistical Methods ... 36
4.3. Results ... 38
4.5. Tables and Figures ... 47
CHAPTER 5. TEMPERATURE AND CAUSE-SPECIFIC EMERGENCY DEPARTMENT VISITS ... 52
5.1. Introduction ... 52
5.2. Methods... 53
5.2.1 Meteorological Data ... 55
5.2.2 Statistical Methods ... 56
5.3. Results ... 57
5.4. Discussion ... 60
5.5. Conclusions ... 62
5.6. Tables and Figures ... 63
CHAPTER 6. CONCLUSIONS ... 66
6.1. Overview ... 66
6.2. Strengths ... 66
6.3. Limitations ... 67
6.4. Summary of Findings and Conclusions ... 68
APPENDIX A. CHAPTER 4 APPENDIX 1 ... 70
APPENDIX B. CHAPTER 4 APPENDIX 2 ... 74
APPENDIX C. CHAPTER 5 APPENDIX ... 78
LIST OF TABLES
Table 3.1. Description of data elements, sources, and transformations ...26
Table 4.1 Summary statistics on injury-related emergency department visit counts
and rates by sex and age group. North Carolina, April-October, 2008-2013. ...47
Table 4.2 Select injury-related emergency department visit rates by county-level
daily mean temperature (F). North Carolina, April-October 2008-2013. ...48
Table 5.1 Crude incidence rates (per 100,000 person-years) of emergency department visits, grouped by discharge diagnosis using the multi-level version of the Clinical
Classification Software, April-October 2008-2103, North Carolina. ...63
eTable A.1 Description of inclusion and exclusion criteria for injury-related emergency
department visits. ...70
eTable A.2 Intent- and mechanism-specific injury-related emergency department visit rates by county-level daily mean temperature (F). North Carolina,
LIST OF FIGURES
Figure 3.1 Map of participating hospitals contributing data to NC DETECT, 2013. ... 15
Figure 4.1 Predicted incidence rates and 95% confidence bands for emergency department visits for selected unintentional injury types, by age group.
North Carolina, April-October 2008-2013. ... 49
Figure 4.2 Predicted incidence rates and 95% confidence bands for emergency department visits for adverse effects and medical misadventures, by sex and
age group. North Carolina, April-October 2008-2013. ... 50
Figure 4.3 Predicted incidence rates and 95% confidence bands for emergency department visits for intentional assault, by sex and age group. North Carolina,
April-October 2008-2013... 51
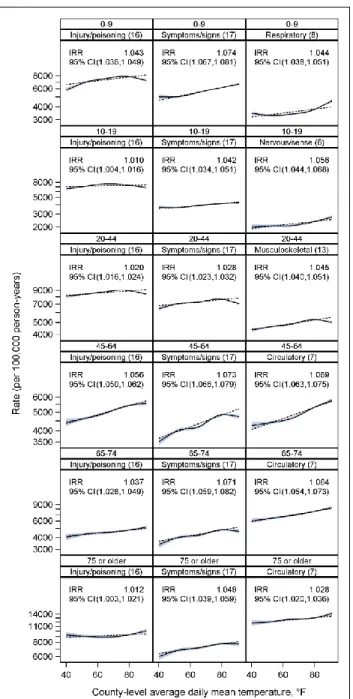
Figure 5.1 Predicted incidence rates of emergency department visits by county-level average daily mean temperature for the three highest-incidence Clinical Classification
Software groups in each age group, North Carolina, April-October 2008-2013. ... 64
Figure 5.2 Cause-specific incidence rate ratios for a 10F increase in county-level average daily mean temperature, by age group, in North Carolina, April-October
2008-2013, from a model with a linear parameterization of temperature. ... 65
eFigure A.1 Predicted incidence rates and 95% confidence bands for emergency department visits for additional selected unintentional injury types, by age group, in North Carolina, April-October 2008-2013, adjusted for calendar year, weekday,
and day of year. ... 73
eFigure B.1 Predicted incidence rates and 95% confidence bands for emergency department visits for selected unintentional injury mechanisms, by age group.
North Carolina, April-October 2008-2013. Unadjusted model. ... 74
eFigure B.2 Predicted incidence rates and 95% confidence bands for emergency department visits for adverse effects and medical misadventures, by sex and age
group, in North Carolina, April-October 2008-2013. Unadjusted model. ... 76
eFigure B.3 Predicted incidence rates and 95% confidence bands for emergency department visits for intentional assault, by sex and age group, in North Carolina,
April-October 2008-2013. Unadjusted model. ... 77
eFigure C.1 Predicted incidence rates of emergency department visits for the
top-level Clinical Classification Software groups for ages 0-9 years, North Carolina,
April-October 2008-2013... 78
eFigure C.2 Predicted incidence rates of emergency department visits for the
top-level Clinical Classification Software groups for ages 10-19 years, North Carolina,
eFigure C.3 Predicted incidence rates of emergency department visits for the
top-level Clinical Classification Software groups for ages 20-44 years, North Carolina,
April-October 2008-2013... 80
eFigure C.4 Predicted incidence rates of emergency department visits for the
top-level Clinical Classification Software groups for ages 45-64 years, North Carolina,
April-October 2008-2013... 81
eFigure C.5 Predicted incidence rates of emergency department visits for the
top-level Clinical Classification Software groups for ages 65-74 years, North Carolina,
April-October 2008-2013... 82
eFigure C.6 Predicted incidence rates of emergency department visits for the
top-level Clinical Classification Software groups for ages ≥75 years, North Carolina,
LIST OF ABBREVIATIONS
CCS Clinical Classification Software
CDC Centers for Disease Control and Prevention
CI Confidence interval
DPH Division of Public Health
ED Emergency Department
F Fahrenheit
ICD-9-CM International Classification of Diseases, 9th Revision, Clinical Modification
IRR Incidence rate ratio
NC North Carolina
CHAPTER 1. SPECIFIC AIMS
As climate change awareness increases and governmental agencies develop plans to
minimize potential health effects of warmer temperatures, it is important to have comprehensive,
research-based information about the public health impacts of heat. While there is a substantial
literature on associations between ambient temperature and mortality, primarily among older
adults residing in urban areas, with a focus on deaths due to cardiovascular and respiratory
causes, recent studies have found temperature effects across a wider spectrum of causes. This
study examined the effects of heat exposure on people of all age groups and examined heat
effects on emergency department visits for a wide range of diseases and injuries. The results of
this study improve our understanding of the effects of temperature on injury and disease among
residents of North Carolina of all ages.
This study utilized state-wide surveillance data for 2008-2013 from the North Carolina
Disease Event Tracking and Epidemiologic Collection Tool (NC DETECT) system, which has
captured data on over 99% of all emergency department visits throughout the state of North
Carolina since 2008. Emergency department visits were categorized into ICD-9-CM diagnosis
groups using the Clinical Classifications Software, a widely-used standardized diagnosis
clustering tool developed by the Agency for Healthcare Research and Quality. Injury-related
emergency department visits were grouped by intent and mechanism based on ICD-9-CM
external cause of injury codes. These data were merged with ecological data at the county level,
population estimates from the U.S. Census Bureau to form a time-series analytical database with
daily emergency department visit counts for each diagnosis and injury group.
The specific aims addressed by this study were:
Aim 1: Describe associations between county-level daily average
ambient temperature and warm-season (April-October) injury-related
emergency department visits, with detailed attention to variation by
injury intent and mechanism, as well as by demographic factors
including sex and age.
Aim 2: Examine the association between warm season daily average
ambient temperature and emergency department visits for a
comprehensive set of diagnosis groups, assessing the relative and
absolute contributions of different diagnosis groups to the overall burden
CHAPTER 2. BACKGROUND
2.1.Overview
Like all species, humans can thrive in only a relatively narrow band of the temperature
spectrum. Exposure to temperatures beyond tolerable thresholds can result in illness, injury, and
death as our body’s natural ability to thermoregulate increasingly fails, resulting in multi-organ
dysfunction.1,2,3(chap3) Concern about the impact of extreme temperatures on human health is
growing, especially in light of mass casualties during major recent heat waves 4–9 and projected
global climate change 10–12. Many governmental agencies are currently developing or refining
their heat advisory and preparedness strategies.13–17 More effective emergency preparedness
policies and programs may be developed if we understand more completely the impact of heat on
human health outcomes.
Epidemiological research has consistently found U- or J-shaped curvilinear associations
between temperature and mortality and morbidity outcomes, with the lowest risk in an optimal
central range of temperatures and increasingly higher risk at the extremes.18–22 The exact shape
and inflection points of these curves differ depending on cause of death/morbidity, geographic
location, population distribution, acclimatization, and availability of technologies such as
air-conditioning, but the basic form remains. This study focused on heat effects, though cold effects
are equally concerning, especially in cooler climates.23,24
While there is now a large body of literature on temperature effects on health, several
important research gaps exist. First, most studies have examined all-cause mortality or
Comparatively little research has been conducted on temperature and morbidity, in part because
morbidity surveillance data are less available than vital statistics and death certificate data.21
Even within the temperature-morbidity literature, most studies have focused on hospital
admissions rather than emergency department visits and thus may only capture the most severe
non-fatal outcomes.25 Addressing this gap is important because studies have shown that the
heat-morbidity patterns can differ considerably from those observed for mortality.26,27 Second, many
studies have focused exclusively on the impact of specific heat wave episodes using heat-wave
period versus non-heat-wave period comparisons rather than using time-series or case-crossover
designs that allow estimation of the effects of temperature over broader time intervals and
temperature ranges.21 Third, in both the mortality and morbidity literature, researchers have
usually chosen a limited set of diseases or health outcomes of interest. This practice leaves open
the possibility that there are unstudied diseases that are, in fact, affected by temperature. Major
recent studies have all tended to use similar small sets of disease groupings (primarily
cardiovascular and respiratory diseases), which were selected based on outcomes that were
historically used in heat-wave-specific studies of mortality. More specifically, nearly all studies
have excluded health outcomes that are due to external causes, such as injury and poisoning 28–31,
though the rationale for this exclusion is rarely discussed.
Recent papers that have cast a wider net are notable exceptions, and have found heat is
associated with many types of disease and injury.32–34 Additional studies which have focused on
individual diseases have found temperature is associated with conditions as disparate as renal
disease 35, gout attacks 36, and preterm birth 37. Together, these findings suggest that
temperature-disease associations may extend beyond the cardiorespiratory outcomes that are typically
approach that includes both disease and injury causes to evaluating the full public health impact
of high temperatures on emergency department morbidity in North Carolina.
2.2.Temperature and Injury and other External Causes
2.2.1Introduction
Historically, the possible effect of high temperatures on injury has received little
epidemiological attention. In fact, many of the largest epidemiologic studies of heat and
mortality have specifically excluded deaths due to injury and external causes, and focused
instead on “non-accidental” all-cause, cardiovascular, or respiratory mortality.24,28–31 While this
exclusion is likely founded on the known excess of cardiovascular and respiratory deaths during
heat waves, it precludes an investigation of potential associations between temperature and
injuries..
2.2.2Epidemiological Studies
Two recent heat-mortality studies have suggested that the effects of heat may include
external causes.32,33 Both studies found evidence of heat effects on external cause / injury deaths.
In fact, in both studies the relative effect estimates for some injury causes of death were of
similar magnitude to those for cardiovascular or respiratory sub-types.32,33 Similarly, a recent
study of meteorological effects on emergency department visits for nine different diagnosis
groups in Taipei, Taiwan found that higher temperatures were associated with increased
emergency department visits categorized into the catch-all group for “accidents” that included all
Other epidemiological studies have also found evidence of associations between
temperature and injuries. Higher temperatures have been associated with higher trauma
admission volumes 39–42 and with work-related injuries 43,44 In an Australian heatwave-focused
mortality and morbidity study that incorporated ambulance call-outs, however, there were more
mixed results. While assault- and work-related ambulance calls increased during heat waves,
some other injury categories, including sports and falls, had inverse or null associations with
temperature.45 Weak temperature associations were also reported in a study evaluating the
usefulness of several weather variables in predicting pediatric injury-related emergency
department volumes.46
Interpretation of temperature-injury association findings has been complicated by the fact
that some prior studies have combined all injuries together 38; this can be problematic because it
combines heat-related illness (ICD-9-CM code 992.x, which includes heat exhaustion, heat
stroke, and heat syncope) with other injuries. By not disaggregating injuries, these studies
preclude estimation of temperature effects on specific types of injuries. Other studies include
only heat-related illness and do not include any other injury types.45,47 In these studies, and in
studies that focus exclusively on heat-related illness, the effect sizes for this diagnosis group
have been very large.47–49
2.2.3Studies from Related Fields
Studies in fields such as ergonomics and occupational hygiene, military medicine, and
environmental/social psychology provide support for considering the associations between
temperature and injury. From the 1950’s to the 1990’s, researchers in the fields of occupational
health and ergonomics conducted many experimental and observational studies on the effects of
Safety and Health tried, unsuccessfully, to persuade the Occupational Safety and Health
Administration to mandate upper limits on occupational heat exposure.50,51 These efforts were
reinvigorated recently, and a new draft criteria for occupational exposure to hot environments,
updated with additional research findings, was distributed for public comment in 2013.13
Although this NIOSH document primarily focuses on physiological mechanisms such as
inadequate heat balance that can result in heat illness, it also discusses the cognitive and
performance effects of heat, which can result in an increased likelihood of injury.13(pp3, 51)
Some of these cognitive and psychomotor performance effects have been directly studied
in ergonomic laboratory tests. Performance tasks used in these studies have included measures of
reaction time; attention/perceptual skill; mathematical processing; and reasoning, learning, and
memory. Overall, increased temperature has been associated with performance decrements, but
the results have been somewhat mixed, with some studies finding no effect and others finding
performance increments with increased temperature.52,53 Some researchers have argued that these
differences are related to the type of tasks used in the experiments or the type of heat
exposure.53–56
In additional to experimental data, the fields of ergonomics and occupational health have
also provided some observational evidence for potential heat effects on injury. One such study
examined the effects of workplace temperature on unsafe work behaviors.57 After observing over
17,000 observations of worker behavior and directly measuring proximal heat exposures, a
U-shaped curve emerged in adjusted models, with the lowest unsafe behavior index measures
occurring when the temperature was in the range 17°C to 23°C wet-bulb globe temperature 57 In
a more recent study, Morabito et al. found an association between apparent temperature and
that workplace injury peaked at high, but not extremely high temperatures, possibly due to
changes in work behaviors at those extremes.44
Many of the early findings about heat stress and the physiology of heat-related illness
emerged from studies conducted by military researchers.58–62 Military studies have also provided
a mechanism for evaluating whether findings from laboratory observations hold true under
real-world conditions. One such study, conducted by researchers from the Israeli Air Force, examined
records for 500 randomly selected warm-season helicopter incidents due to pilot error and
compared the temperature on the day of those events to the temperature on 1000 other days
during the same period.63 Notably, this study design is similar to a case-crossover design, though
the authors do not refer to the study as using that method and do not appear to have used
conditional statistical methods. Again, a curvilinear J-shaped dose-response curve was found,
with increasing temperatures being associated with more pilot-error-related incidents.63
Seasonal variations have also been linked to injury rates during military trainings, with
warmer season training sessions resulting in higher injury rates.64,65 Since military training is
standardized and runs throughout the year, potential confounding by season-varying task
activities, a limitation of most sports-related studies, is reduced. In the 2002 study, injuries were
categorized into overuse (e.g. strains, stress fractures, and tendinitis) or traumatic (e.g. sprains,
dislocations, lacerations). Interestingly, the risk of injury in summer for both overuse and
traumatic injury was about twice that in fall, even after controlling for difference in physical
characteristics of the four training groups.64
2.2.4Heat and Violence
Another way that temperature might affect injury rates is through heat effects on
collar”, “hot tempered”, and “in the heat of the moment” capture the commonly held connection
between heat and aggression.66
Heat acts as both a physiological and psychological stressor. Researchers in the field of
environmental and social psychology have linked temperature with increased aggression or
violent crime.66–75 There has been considerable debate, however, about whether this relationship
is linear and monotonically increasing; non-monotonic (with some researchers finding a decrease
in violence at the highest end of the temperature spectrum); or even a real effect at all.67,70,76–79
Some researchers have even expanded this potential connection from interpersonal violence to
climate effects on global inter- and intra-national conflicts.80,81
2.3.Temperature and Cause-Specific Mortality/Morbidity
In the heat-health literature, researchers have typically created ad hoc diagnosis groups of
diseases of interest for each study. Tracing the history of these groupings in many recent papers
leads back to findings from a seminal paper describing excess hospital admissions during the
1995 heat wave in Chicago.82 Over time, these groupings have been replicated and augmented by
other researchers, though much of the focus has remained on cardiovascular and respiratory
diseases.
Semenza et al. considered nearly all ICD-9-CM diagnosis categories in their study of
excess hospital admissions during the catastrophic 1995 heat wave in Chicago. Both primary and
secondary discharge diagnoses were evaluated. The conditions that exhibited an excess as
primary diagnoses during the heat wave were related to dehydration, heat-related illness, or renal
failure. However, when considering primary discharge diagnoses together with secondary
diagnoses, which were thought to represent comorbidities and existing conditions,
important underlying conditions that elevated risk of hospital admission during the heat wave.
Semenza et al. are careful to note that by using admission data, they may be not be adequately
representing illnesses that are treatable in the emergency department or another outpatient
provider.82(p276) They also point to incomplete E-coding as potentially limiting their ability to
detect excesses in external cause admissions.82(p276) Unfortunately the details of these limitations
have seemingly been lost over time and the implicit exclusion of external causes and certain
other diagnoses, justified on the basis of a lack of evidence of an excess in injury admissions in
this paper, continues to propagate.
Several recent heat-health studies have taken a different approach, however. These
studies have focused on systematically and consistently modeling the cause-specific associations
between heat and various diseases, both by widening the set of disease groups under study and
by disaggregating sub-types of major disease categories such as cardiovascular and respiratory
disease. Together, these studies serve as models for our approach to assess the heat effects on
cause-specific emergency department visit morbidity.
Two of these studies investigated cause-specific mortality.32,33 Using a shared modeling
strategy for each cause of death, these studies provided evidence on the relative contribution of
each cause to the total health impact of heat. Gasparrini et al. examined cause-specific
temperature-mortality relationship across 33 different cause of death categories and included
groups for “all external causes”, “accidents/injuries”, and “intentional self-harm”.32 Basagaña et
al. studied 66 cause-of-death groups, including eight external cause of injury subgroups.33
This approach has also been used in two studies of hospital admissions: one in Australia34
researchers used the same Clinical Classification Software diagnosis grouping system that we
employ in Aim 2 of this dissertation project.
Since mortality and hospital admission research involve only the most serious cases,
disproportionate emphasis may be placed on certain diseases that are either more fatal or require
greater medical intervention, or populations whose health may already be compromised, such as
older adults. Prior research has already found important differences between mortality and
hospital admissions resulting from heat 26,27 and it is likely that emergency department visit
patterns will differ from both deaths and hospital admissions. The literature on ambient
temperature and emergency department visits is very limited. Two studies in California have also
looked at cause-specific effects across many disease categories, first in a study of hospital
admissions and emergency department visits focused on a 2006 heatwave, in which 11 groups
were used 25, and a case-crossover study of temperature effects on hospital admissions in nine
California counties, in which 16 groups were formed.84
Only a few studies have looked at cause-specific associations at the emergency
department level. Two studies in California, one focused on heat waves 25 and the other a
case-crossover design 47 examined cardiovascular and respiratory diseases (each disaggregated into
sub-types in the Basu et al. paper), as well as electrolyte imbalance, cerebrovascular disease,
renal failure, diabetes, and heat-related illness. A recent study of emergency department visits in
Taipei, Taiwan, examined temperature effects on nine different diagnosis groups.38 In these
studies, however, the outcomes of interest do not comprehensively encompass the different types
CHAPTER 3. METHODS
3.1.Study Design
3.1.1Study Designs in Existing Literature
Three main study designs have been used in the temperature-health literature: 1) case
series studies, such as those enumerating the impact of specific heat wave events5,82,85; 2)
time-series studies, which model the temporal associations between heat exposures and health
effects32,86; and 3) case-crossover studies, which compare heat exposures at the time of the event
(case) to those during a sample of other time points (crossover).31,47 Case series studies of heat
wave mortality have been informative in revealing risk factors and vulnerable populations
including being elderly, lower socio-economic status, having a mental illness,
African-Americans, and having co-morbid conditions such as cardiovascular or respiratory disease.19,87
Protective factors included air-conditioning and access to transportation.19,88–90 Methodological
research has demonstrated the equivalence of rate ratios obtained from time-series and
case-crossover designs in the special case where exposures are shared by the population and are
measured at the ecological level, such as air pollution or temperature.91–93
Many heat-health studies have focused on comparing “heatwave” periods to
“non-heatwave” periods.25,33,45 This approach can be problematic, however, because heat wave
definitions vary widely in temperature thresholds and duration requirements94, and different
interest in assessing whether there is an added effect of a heat wave above and beyond the effects
of high temperature itself.23,96–98
3.1.2Study Design for this Project
This study linked emergency department visit data from a state-wide surveillance system
with meteorological observations and population estimates to estimate the associations between
daily county-level temperatures and county-level emergency department visit rates for a large set
of disease and injury groups. The study used a time-series design with outcomes and potential
confounders or modifiers measured at the individual level and exposures shared at the
geographical level. The combined data were analyzed using Poisson generalized linear
regression models.91,99–101
3.2. Study Setting and Population
The source population was all residents of the state of North Carolina in the years
2008-2013. North Carolina residency was determined by the patient’s recorded county of residence.
Since NC DETECT, the source of emergency department visit data, captures nearly all
emergency department visits in North Carolina, we considered the full state as the catchment
area and calculated rates using Census population denominators.
North Carolina is a large and growing Southeastern state with a 2010 population of
approximately 9.5 million people, making it the 10th most populous US state 102. North Carolina
is divided into 100 counties, with Census 2010 total populations ranging from 4,400 (Tyrell
county) to 920,000 (Mecklenburg county) and land areas ranging from 172.5 (Chowan county)
to 949.2 (Robeson county) square miles. The state has a varied topography and is geographically
westward to Interstate 95 and beyond to a natural fall line running from Halifax County
southwest to Scotland County; the Piedmont, in the center of the state, containing the
fast-growing population centers connected by Interstates 85 and 40--Charlotte-Mecklenburg,
Greensboro-Winston-Salem-High Point (the “Triad”), and Raleigh-Durham-Chapel Hill (the
“Triangle”); and the Appalachian Mountains region in the western portion of the state,
containing the Blue Ridge and Smoky Mountain ranges. The topography of these geographic
regions also produces distinct climates, with the Coastal Plains typically having a warmer and
moister climate due to its proximity to the Atlantic Ocean, and the Mountains experiencing
cooler temperatures throughout the year as a result of its higher elevation.
3.3.Data Sources and Acquisition
3.3.1Outcome Data: Emergency Department Visit Data
The NC DETECT surveillance data system has been collecting data on emergency
department visits in North Carolina since the early 2000’s, but it expanded into a comprehensive,
statewide system after the NC legislature mandated that all hospitals with 24-hour acute care
emergency departments must provide their data for public health surveillance purposes, effective
January 1, 2005. Hospitals now report de-identified visit data to NC DETECT electronically, in
near real time, via the North Carolina Hospital Emergency Surveillance System. By 2008, nearly
all hospitals contributed data, with only a few small, rural hospitals as temporary holdouts.
Psychiatric, military and veteran’s hospitals are not included in the data available for research.
As of August 13th, 2013, there were 122 active hospitals reporting to the system, though this
number fluctuates as new hospitals come online and others either close or have gaps in data such
distribution of the EDs that report to NC DETECT. An estimated 99.5% of all emergency
department visits statewide in 2008 were captured in NC DETECT 103; with essentially all
hospitals reporting, the effective catchment area for this surveillance system encompasses the
whole state, allowing us to calculate population-based rates using Census denominators. Over 4
million emergency department visits are recorded in the NC DETECT system each year.
Figure 3.1 Map of participating hospitals contributing data to NC DETECT, 2013.104
For this dissertation project, I obtained state-wide visit-level data for all emergency
department visits made by North Carolina residents to civilian 24/7 acute-care hospital-affiliated
emergency departments during the period between January 1st, 2008 and December 31st, 2013
oversight committee. The following data elements from NC DETECT were used to develop the
analysis dataset: age, sex, discharge diagnosis codes (up to 11 ICD-9-CM diagnoses), coded
cause of injury (up to 5 ICD-9-CM E-codes), date and time of visit, and patient’s county of
residence. Demographic information other than age and sex are unavailable in the NC DETECT
system; race and ethnicity data were not collected prior to June 2015.
3.3.1.1.Categorization of Injury Types (Aim 1)
Injury-related emergency department visits were categorized using both ICD-9-CM
diagnosis codes and external cause of injury codes, also known as E-codes. Each injury-related
visit record in the NC DETECT data includes up to five ICD-9-CM external cause of injury
codes, or “E-codes”. These codes provide additional information about the precipitating event
that resulted in the patient being injured and needing emergency care.
In the language of the ICD-9-CM codebook, the term “external causes”, and their
corresponding “E-codes”, refers to an additional classification scheme that was developed to
describe the circumstances under which an injury, poisoning, or adverse effects event
occurred.105 E-codes are prefixed with an “E” followed by a 3-5 digit number, and range from
E800-E999.xx. A fully-coded data record for a patient treated for an injury, poisoning, or adverse
effect at the emergency department should receive both diagnosis code(s) and E-code(s). For
example, a patient who falls on a set of stairs and breaks her ankle would receive a diagnosis
code reflecting the ankle fracture itself (such as 824.8) and an E-code reflecting the fact that the
fracture was the result of a fall from stairs (such as E880.9).
Emergency department visits were identified as “injury-related” if they contained either
an ICD-9-CM diagnosis code in the 800-999 range, or an ICD-9-CM external cause of injury
groups using the CDC’s injury matrix framework for ascribing E-codes to different types of
injury.106,107 Due to the more complex meteorological effects on motor vehicle crashes, such as
the effects of precipitation and fog, and the lack of driving exposure metrics and detailed crash
data, we chose to exclude motor vehicle crashes from this study.
There are two primary axes by which injuries are categorized: Intent and Mechanism 106.
Intent is divided into six groups: 1) Self-Inflicted, which includes suicide and other self-harm; 2)
Assault, which includes injuries intentionally inflicted by others; 3) Unintentional, which
includes “accidental” injuries such as falls; 4) Undetermined, including injuries for which intent
could not be adequately discerned; 5) Adverse Effects, which includes adverse reactions to
medications and medical misadventures; and 6) Other, which includes legal intervention (injuries
resulting from legal police actions) and operations of war. Mechanism of injury describes the
physical causes of the injury, such as falls, poisoning, cutting/piercing, fight/brawl, fire, natural
and environmental factors, firearms, or suffocation.
In addition to intent and mechanism, E-codes can also be used to describe the place of
occurrence. Place codes are listed in the E849.0-E849.9 range, and include the following
categories: Home, Farm, Mine and quarry, Industrial place and premises, Place for recreation
and sport, Street and highway, Public building, Residential institution, Other specified place, or
Unspecified place. In 2010, two new sets of E-codes were introduced into the ICD-9-CM to
describe the status and activity of the patient at the time of the injury. Status codes are useful for
differentiating between occupational, military, and recreational injuries. Status categories
include: civilian activity done for income or pay, military activity, other external cause status,
of the injury. They are particularly useful for identifying sports and recreational activities that
resulted in injury, since each sport has its own code.
Despite their utility in providing additional details about injury events, these place,
status, and activity E-codes are not consistently coded by hospitals. This is particularly true for
activity and status codes because these codes were introduced in the middle of the study period
and are still being adopted by hospitals in North Carolina. As a result, the data for this study did
not have sufficient inclusion of place, status, and activity codes to use them for categorizing
injury-related emergency department visits.
For the Aim 1 analyses, we assigned visits to injury groups based on the first-listed
E-code that represents intent and mechanism. Since place, activity, and status E-codes can be present
amongst the five possible E-code positions, I developed data management routines to scan
through each set of E-codes and skip over E-codes that indicate only the place, activity, or status
of the injury event. While the second- or lower-listed E-codes may provide additional
information, researchers commonly focus on the first-listed code both for practicality given the
quantity of data and because the first-listed E-code is supposed to represent the primary intent
and mechanism of injury which resulted in the emergency department visit.108 Furthermore, it
has been reported that in the NC DETECT system more than 50% of injury-related emergency
department visits in 2010 received only one E-code 108, limiting the possible gains from also
considering the 2nd-5th codes.
3.3.1.2.Categorization of ICD-9-CM Diagnosis Codes (Aim 2)
With the proliferation of electronic medical records and health surveillance systems, the
vast magnitude of health data accentuates the need for standardized classification schemes.
physicians, help to ensure that the disease groupings are clinically relevant. Taking a health
informatics approach, we used a standardized classification algorithm for grouping the thousands
of illnesses and other conditions codified in the ICD-9-CM into a more manageable set of
clinically-related diagnosis groups.109
Emergency department visits were categorized into diagnosis groups based on ICD-9-CM
diagnosis codes using the Clinical Classification Software (CCS) diagnosis clustering system.109
The CCS is actively maintained by the Healthcare Cost and Utilization Project and sponsored by
the Agency for Healthcare Research and Quality. Also referred to as a “clinical grouper”, the
CCS is a diagnosis categorization scheme that condenses the more than 14,000 individual
ICD-9-CM diagnosis codes into 285 clinically-meaningful diagnosis groups.109 Although other
diagnosis clustering tools are available, the CCS was previously found to have the best coverage
for the types of diagnoses that are typically encountered in the emergency department 110 and has
been used successfully with NC DETECT data in earlier studies.111
There are two forms of the CCS system: a single-level version with 285 clusters and a
multi-level version that hierarchically positions the single-level groups into larger super-groups
and also provides even finer sub-groups for some conditions.109 For example, the ICD-9-CM
diagnosis code “493.02 Extrinsic asthma with acute exacerbation” is labeled in the single-level
version as group “128 (Asthma)”. In the multi-level version, however, it is labeled as group
“8.3.2.3”, where each digit represents a different level in the hierarchy: “8 (Diseases of the
respiratory system)” > “8.3 (Asthma)” > “8.3.2 (Other and unspecified asthma)” > “8.3.2.3
(Other asthma with acute exacerbation)”. Note that in this case, the single-level CCS group
bridging the two versions, but some single-level groups correspond instead to the 1st, 3rd or 4th
levels.
While the 285 single-level CCS groups are far more manageable than the thousands of
individual ICD-9-CM codes, it is still impractical to estimate effects for all 285 groups. In order
to reduce the number of groups but still retain a comprehensive and exhaustive approach, we
used the highest level of the multi-level form of the CCS as the basis for grouping diagnoses.
3.3.2Exposure Data: Meteorological Data
3.3.2.1.Temperature Metrics
Several metrics are available to characterize meteorological exposure; some are directly
measured, such as ambient temperature, while others combine multiple variables algorithmically
to incorporate both temperature and the potential effects of other factors such as humidity, dew
point temperature, wind speed, or solar radiation 112–114. These algorithmic “biometeorological”
measures, such as heat index and apparent temperature, were originally developed to characterize
human thermal comfort and are often presented alongside temperature forecasts in media outlets
because they are informative for choosing weather-appropriate apparel, but they have also been
used extensively in heat-health research.19,87
The question of which of these metrics to use in heat-health research has been an active
area of deliberation. Further complicating this decision, each of these measures can also be
summarized at the daily level with many different statistics, including daily mean, median,
maximum, or minimum. Several comparison studies have tested various metrics against each
other to determine which performs best at predicting health outcomes, but no clear winner has
Furthermore, for epidemiological studies, where less emphasis is placed on the purely predictive
quality of models, it has been concluded that these metrics tend to produce similar
exposure-response patterns, largely due to the fact that these metrics are highly correlated.116,120,121 For
practical purposes, these studies have suggested that these metrics are largely interchangeable 121
and have advocated selecting a metric for which the available data are most spatially and
temporally complete116 and which is most easily measured and interpreted to aid effective
communication in heat-warning systems.121 In North Carolina, like elsewhere, average daily
ambient temperature data are most spatially and temporally complete; and, it is for these reasons
that I will use this temperature metric in my dissertation analyses.
3.3.2.2.Meteorology Data
Meteorological data, including the daily maximums, minimums, and means for ambient,
dewpoint, and heat index temperatures (where available), were obtained from the NC Climate
Retrieval and Observations Network Of the Southeast (NC CRONOS) system via a data request
to the State Climate Office of North Carolina.
Weather conditions throughout the state of North Carolina are continually monitored at
first order automated weather stations, including Automated Weather Observing System
(AWOS), Automated Surface Observing System (ASOS), Agricultural Weather Network
(AgNet), and North Carolina Environment and Climate Observing Network (NC ECONet)
stations maintained by the Federal Aviation Administration (AWOS and ASOS), the National
Weather Service (ASOS), the Department of Defense (ASOS), the NC Agricultural Research
Service (AgNet), and the NC State Climate Office (AgNet and NC ECONet). These first order
period. In addition to the first order stations, there is also an additional network of
non-automated Cooperative Observing Program (COOP) monitoring stations, maintained by a
network of volunteers and contractors organized by the National Weather Service, in areas of NC
where first order stations are not available. These COOP stations record 24-hour-period
minimum and maximum ambient temperatures, though the time of observation varies from
station to station and is typically not midnight-to-midnight as with the first order stations. Data
from both the first order and COOP monitoring stations are aggregated in NC CRONOS and
made available to researchers through data requests to the NC State Climate Office.
Meteorological exposures were assigned by county and day, by linking the patient’s
county of residence and the visit date recorded in the NC DETECT system to measurements
taken at monitoring stations within that county. If more than one monitoring station was situated
in a given county, the stations’ values were averaged. If one or more of the monitoring stations in
a county had missing or invalid data for a given day, the average of the remaining functioning
monitors was used.
One limitation of using the patient’s county of residence is that we cannot guarantee that
the precipitating events that led to the emergency department visit occurred in that same county
or in another county. For example, if a Wake County resident went to the emergency department
while vacationing in New Hanover County, it is possible to introduce exposure misclassification
by assigning the temperature in Wake County to that emergency department visit. An alternative
approach would be to use the county in which the emergency department facility is located, with
the presumption that patients are usually brought to the nearest emergency department. However,
due to restrictions in NC DETECT data use agreements, we were prohibited from identifying
also restricted from obtaining facility’s county because that information would identify the
facility itself. To address this concern empirically, we created larger regional clusters of
counties; instead of identifying the location of each facility at the county level, we were able to
identify which region it was in. With this information, we compared the region of the facility to
that of the patient’s county of residence to evaluate the extent to which travel outside of the
county of residence might affect our results.
Exposure assessment at the individual-level was neither available nor practical for this
study. Exposure misclassification may occur as a result of the use of ecologic, rather than
personal, ambient temperature. However, an exposure assessment study conducted in Baltimore
with a small group of elderly subjects using personal ambient temperature monitors found that
personal ambient temperatures were well correlated with temperatures measured in downtown
and at Baltimore Washington International airport, though the personal ambient temperatures
were slightly lower than those measured by weather stations.122 Another concern is that outdoor
temperatures may not reflect the actual exposures that the population experiences; for example,
office workers may typically experience lower temperatures during work hours due to the
cooling effects of air conditioning. This potential misclassification can go in the opposite
direction, too; a study of the homes of older adults in Detroit found that indoor temperatures
often exceeded outdoor ambient temperatures.123 The correlation between outdoor ambient
temperature and personal ambient temperatures, however, is likely to vary by factors such as
geography (for example, microclimate differences, such as elevation or forestation, between
where an outdoor temperature is measured and where a person resides) or occupation (for
conditioning prevalence is likely to be appreciably higher in North Carolina than in the cooler
climate of Detroit, actual usage is highly dependent on economic factors.
3.3.3Population Estimates
Age-group and sex-specific county-level mid-year population estimates for each study
year were obtained from the U.S. Census Bureau’s Intercensal Population Estimates (2008-2009)
and Current Estimates (2010-2013). These data serve in the current analysis as population
denominators in calculations of incidence rates.124,125 These data were available with five-year
age groups. To match the breakpoints in the Census population data, we used the following six
groups: 0-9, 10-19, 20-44, 45-64, 65-74, and 75 and older.
3.4.Data Examination and Quality Assurance
Several data quality steps were performed to address the presence of incomplete or
erroneous data points in the input datasets.
Meteorology: Data in the NC CRONOS system are the raw measurements taken by
weather monitoring stations and are not processed through data quality checks prior to inclusion
or dissemination. When monitoring stations malfunction, the data contributed to NC CRONOS
can contain implausible values, such as midsummer temperatures of -40°F; if the malfunction
persists, there can be long strings of unusual values in the time series. Potentially erroneous
meteorological values were identified using range checks based on climate normals for North
Carolina. Values that fell outside of the expected range were vetted by comparing them to values
from nearby stations for the same time period. When we determined that a value was likely to be
the result of monitor malfunctions, the erroneous values was set to null. These checks were run
averaging monitor values when 2 or more monitors were situated in a given county, we could
still generate an average from the remaining monitors after removal of the erroneous values
stemming from a malfunctioning monitor.
NC DETECT: When new hospital electronic medical records systems are deployed or
when existing systems experience technical problems, there can be temporal discontinuities in
the data feeds that are aggregated into the NC DETECT system. In many instances, these
discontinuities are able to be repaired with data updates at a later time, but in other cases, the NC
DETECT data remain incomplete. This may affect all data elements coming from a given
hospital, or can be specific to one or more variables. The duration of these gaps can be as short
as a day or as long as several months.
Additionally, some hospital data feeds into NC DETECT are more systematically missing
certain elements, such as diagnosis codes or E-codes, for a substantial proportion of visits. For
example, some hospitals’ data are regularly missing diagnosis codes for approximately 40-50%
of their visits. Since these codes are necessary for categorizing emergency department visits into
disease or injury groups, this under-coding can affect our ability to accurately enumerate
diagnosis- or injury-specific visit counts and may result in underestimates of rates and outcome
misclassification in the time-series analyses.
To address this issue, we examined the emergency department visit data; since the data
use agreement did not include hospital identifiers, these data quality checks were performed at
the county level. Temporal discontinuities were identified through visual inspection of
county-specific time-series plots for each variable of interest. Systematic data incompleteness was
assessed by calculating the proportion of all visits made in a given county on a given day that
We developed a threshold for missing diagnosis codes or E-codes after considering both
the need to remove from the analysis those county-days that lacked adequate data with which to
generate accurate visit counts and the cost of removing county-days in terms of reduced power
and rate stability. When the data completeness in a given county on a given day crossed that
threshold, both the visit count numerators and the corresponding person-time were removed prior
to the calculation of rates and regression analyses.
3.5.Statistical methods
3.5.1Data Transformations
NC DETECT data were structured as a line-listing with each row consisting of a single
emergency department visit. Data elements in the NC DETECT, meteorological, and population
data were categorical or continuous, and some of these data values were transformed for analysis
(Table 3.1). The emergency department visit data were grouped by county, day, age group, and
sex. Next, these data were linked to meteorological data by county and day, and to population
data by county, age group, sex, and year to form a grouped data table.
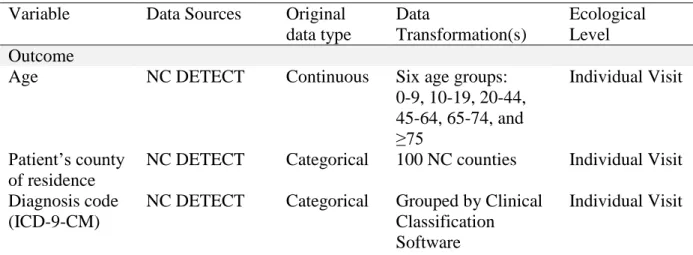
Table 3.1. Description of data elements, sources, and transformations.
Variable Data Sources Original data type Data Transformation(s) Ecological Level Outcome
Age NC DETECT Continuous Six age groups: 0-9, 10-19, 20-44, 45-64, 65-74, and ≥75
Individual Visit
Patient’s county of residence
NC DETECT Categorical 100 NC counties Individual Visit
Diagnosis code (ICD-9-CM)
NC DETECT Categorical Grouped by Clinical Classification Software
Injury E-code (ICD-9-CM)
NC DETECT Categorical Grouped by Intent and Mechanism
Individual Visit
Exposure Ambient temperature
NC CRONOS Continuous Daily mean: Either mean of minimum and maximum
temperatures or mean of hourly temperature values, based on weather station type. Parameterizations: Categorical (approx. 5F increments); linear; natural cubic spline County Population Age group specific mid-year population estimates U.S. Census Bureau
Categorical Six age groups: 0-9, 10-19, 20-44, 45-64, 65-74, and ≥75
County
Day of year NC DETECT (visit date); NC CRONOS (date of temperature observation) Integer (April 1=1 to October 31=214) Smoothing function for longer term time trends (spline)
N/A
Day of week NC DETECT (visit date); NC CRONOS (date of temperature observation)
Integer (1-7) Indicator term for weekday vs weekend
N/A
Year NC DETECT
(visit date); NC CRONOS (date of temperature observation)
Integer (2008-2013)
Indicator for year N/A
The analysis dataset was a matrix constructed from the cross-classification groups of
county, day, sex (Aim 1 only) and age, with additional variables for each diagnosis/injury group.
In this dataset, there was one data row for every cross-classification of county (n=100), day
(n=214*6=1284, for the 214 days between April 1 and October 31, and 6 data years from
structure also included the spatio-temporally linked meteorological and population data
corresponding to each county-day-age-sex group. Additional variables indexed the selected
diagnosis/injury groupings, and contained the daily disease/injury-specific emergency
department visit counts enumerated for each county-day-age-sex group combination.
3.5.2Statistical Analysis
Descriptive statistics included cause-specific emergency department visit counts and
rates, as well as cross-tabulations by age, sex, and temperature intervals. Cells sized >0 and <10
were suppressed in compliance with the NC DETECT data use agreement with NC DPH.
Distributional plots and statistics for ambient temperature such as mean, median, and range were
also generated.
In both aims, count-based Poisson generalized linear regression models were used to
estimate the exposure-response patterns for the associations between temperature and
cause-specific emergency department visit rates, and to adjust for potential confounders.99,100 The
natural logarithm of the population estimate for the relevant age group, sex, county, and year
strata was used as an offset term for incorporating the population denominator into the Poisson
We modeled the exposure-response curve for the association between warm-season
county-level average daily mean temperature and emergency department visits for each disease
or injury group separately, using a series of generalized linear models of the form:
ln(𝑐𝑜𝑢𝑛𝑡𝑖𝑗𝑘𝑙) = 𝛼 + 𝑓(𝛽; 𝑡𝑖𝑗, ) +
𝛾𝑌𝐸𝐴𝑅
𝑗+
𝛾𝐷𝑂𝑊𝑗+ 𝑓(𝛾; DOY𝑗, )+ ln(𝑝𝑒𝑟𝑠𝑜𝑛𝑦𝑒𝑎𝑟𝑠𝑖𝑗𝑘𝑙/100,000)
where:
i indexes county;
j indexes calendar day;
k indexes age group;
l indexes sex;
ln(𝑐𝑜𝑢𝑛𝑡𝑖𝑗𝑘𝑙) is the natural logarithm of the daily emergency
department visit count for county i, day j, age group k, and sex l;
𝛼 represents the intercept;
𝑓(𝛽; 𝑡𝑖𝑗, 𝑠) is a set of beta coefficients representing the functional
form of the parameterization of the county-specific daily mean ambient temperature (and optionally, including product interaction terms for potential effect measure modifiers s);
𝛾𝑌𝐸𝐴𝑅𝑗 Represents the coefficients for the indicator term for
calendar year;
𝛾𝐷𝑂𝑊𝑗 represents the coefficients for the indicator term for day of week (weekday vs weekend);
𝑓(𝛾; DOY𝑗, ) is the set of coefficients representing the functional form
of the smoothing function for day of year; and ln(𝑝𝑒𝑟𝑠𝑜𝑛
− 𝑦𝑒𝑎𝑟𝑠𝑖𝑗𝑘𝑙
/100,000)
is the population denominator offset term: the natural logarithm of the county-year-age-sex-specific population estimate represented as person-years divided by 100,000.
To evaluate the shape of the exposure-response relationship, our modelling approach
explored several parameterizations for temperature. Modelling of ambient temperature started
interval, and then proceed to more flexible natural cubic spline parameterizations. Some recent
papers consider lagged effects of temperature on morbidity or mortality, examining for example
the association between the rate of disease on day j and average daily ambient temperature on
day j, j-1, j-2,…j-n.127 The current analysis examines only unlagged associations. To account
for longer term time trends, we included in the model a smoothing function for day of year, a
term for day of week (weekend vs weekday), and a term for calendar year, with no regression
model adjustment for sex or age. Some heat-health studies have considered air pollution as a
potential confounder; this is particularly true for heat studies that are offshoots of air pollution –
health studies. However, recent methodological commentaries have called this practice into
question using directed acyclic graphs, on the grounds that air quality is a causal intermediate of
the heat-health association and not a confounder of this relationship. 128,129 For this reason, we
did not adjust for air pollution concentrations in this study.
While age and sex were not considered important potential confounders a priori, we
were interested in modification of ambient temperature-disease associations by sex and age. To
examine heterogeneity in these associations, we repeated the analysis using interaction terms for
sex and age group. Figures depicting the stratified exposure-response curves on the log-rate scale
were produced for each diagnosis or injury group, including 95% confidence bands. Where
summarization with simpler models was possible, we also produced tables and forest plots with
CHAPTER 4. TEMPERATURE, INJURIES, AND ADVERSE EFFECTS
4.1.Introduction
Despite the extensive literature on the effects of high temperatures on human mortality18–
20,22,130 and morbidity21,25,34,38,48,83,84,131,132, few epidemiological studies have quantified the
effects of temperature on injuries39–43,45,46,133,134. In fact, many of the largest recent heat-health
studies have specifically excluded external cause outcomes a priori.24,29,30,135
Such exclusions are noteworthy since research in fields such as ergonomics, psychology,
and criminology provides support for considering the associations between temperature and
injury generally, and not just the patent increased risk of heat-related illnesses such as heat
exhaustion and heat stroke, which are also classified as external cause of injury events.48 Heat
acts as both a physiological and psychological stressor, and can lead to increased cognitive and
psychomotor fatigue, decreased concentration, or other performance decrements53,55 that may
increase the risk of unintentional injury to self or others. High temperature has also been posited
to affect intentional injury rates through heat effects on aggression, violence, or mental health.
Researchers in the field of environmental and social psychology have linked temperature with
increased aggression and violent crime.66–70,72,74,75
The current study examines associations between county-level average daily mean
temperature and the leading causes of injury-related emergency department visits in North
Carolina in 2008-2013 using state-wide surveillance data from the North Carolina Disease Event
variations in the exposure-response patterns by injury intent and mechanism, as well as
modification by age and sex.
4.2.Methods
4.2.1Study Setting
This study examines associations between heat and injury-related emergency department
visits among residents of North Carolina, the 10th most populous US state in 2010136, during the
warm months (April through October) in the years 2008-2013. Seven of the 100 counties in
North Carolina had no weather stations during this period and were excluded from this study
(Alleghany, Camden, Catawba, Clay, Greene, Jones, Perquimans counties); these are counties
with relatively small populations and contain only 2.4% of the 2010 state population.
4.2.2Meteorological Data
Daily mean ambient temperature data were obtained from the NC Climate Retrieval and
Observations Network of the Southeast (NC CRONOS), a large meteorological database
developed and maintained by the NC State Climate Office. This system aggregates observed
values from over 300 weather stations throughout the state, and includes both automated and
non-automated stations. Automated stations record temperature observations on an hourly basis
year-round and also provide daily summary statistics for each midnight-to-midnight 24 hour
period. In addition to the automated stations, there is also an additional network of
non-automated Cooperative Observing Program (COOP) monitoring stations, maintained by a
network of volunteers and contractors organized by the National Weather Service, in areas of NC