RNA-PROTEIN CONDENSATION PATTERNS THE CYTOSOLIC LANDSCAPE OF A SYNCYTIUM
Erin Michelle Langdon
A thesis submitted to the faculty at the University of North Carolina at Chapel Hill in partial fulfillment of the requirements for the degree of Doctor of Philosophy in the department of
Biological Sciences in the Graduate School of Arts and Sciences.
Chapel Hill 2019
©2019
ABSTRACT
Erin Michelle Langdon: RNA-Protein Condensation Patterns the Cytosolic Landscape of a Syncytium
(Under the direction of Amy Gladfelter)
ACKNOWLEDGMENTS
The work presented herein would not have been possible without the support of many people. To Amy, for whose enthusiastic support and mentorship has been incredible. Her passion for science and curiosity is infectious, and I will be eternally grateful for her instillation of scientific curiosity and confidence in me. Time and again her confidence and encouragement pushed me to achieve success not only in the lab but also in life. Thank you for fostering an environment of creativity in the lab that has helped me develop my own scientific curiosity, and for also reminding me to look to nature.
To the scientific community at UNC, Dartmouth, and MBL. Without these collaborative research environments, my work would have not been achievable. I would especially like to thank members of my thesis committee for their guidance and input throughout the years.
I would like to thank members of the Gladfelter Lab, past and present, for their thoughtful discussions and support in reviewing and revising this body of work. I will miss all of our enlightening discussions about the meaning of everything, and I count myself lucky to have spent this adventure with all of you. Each of you are responsible for helping me grow into the scientist I am today, and for that, I am truly thankful.
TABLE OF CONTENTS
LIST OF FIGURES ...x
CHAPTER 1: INTRODUCTION ...1
Cytosolic organization of cellular RNAs and proteins ...1
mRNAs and RBPs localize to and promote the formation of liquid-like cell compartments ...2
mRNA influences the physical properties of RNP droplets ...5
RNA sequence contributes to the molecular identity of RNP droplets ...7
Cytosolic organization in the syncytial cytoplasm of Ashbya gossypii ...9
Concluding Remarks ...13
CHAPTER 2: MRNA STRUCTURE DETERMINES SPECIFICITY OF A POLYQ- DRIVEN PHASE SEPARATION ...15
Introduction ...15
Results and Discussion ...15
Materials and Methods ...25
Acknowledgments...48
Authorship...48
CHAPTER 3: POLY-Q DEPENDENT PHASE SEPARATIONS DRIVE SPATIAL HETEROGENEITY IN CYTOPLASMIC CROWDING ...50
Introduction ...50
Results ...52
Discussion ...60
CHAPTER 4: DISCUSSION AND FUTURE DIRECTIONS ...74
Brief Summary of Results ...74
How do cells control the specific assembly of RNP phase-separated droplets? ...75
Mechanisms and functional consequences of RNA-protein condensation ...76
Does liquid phase condensation play a functional role in translational regulation? ...78
Liquid phase condensation in patterning macromolecules in the cytosol...80
Final Thoughts ...83
APPENDIX: PROBING RNA STRUCTURE IN LIQUID-LIQUID PHASE SEPARATION USING SHAPE-MAP ...84
Introduction ...84
Materials ...85
Methods...87
Notes ...93
Outlook ...95
LIST OF FIGURES
Figure 1.1 - Multi-valent interactions between RNAs and RNA-binding proteins
promote liquid-liquid phase separation ... 4 Figure 2.1 - Cyclin and Polarity complexes are spatially and physically distinct
within the cell ... 16 Figure 2.2 - Polarity and cyclin complexes segregate in vitro ... 19 Figure 2.3 - RNA secondary structure determines specificity and identity of
Whi3-CLN3 droplets ... 21 Figure 2.4 - Whi3 binding alters RNA behavior... 23 Figure 2.S1 - Whi3, a polyQ-containing protein, forms LLPS droplets in vitro ... 38 Figure 2.S2 - CLN3 and BNI1 co-assemble when regions of complementarity between
the two RNAs are exposed through melting ... 38 Figure 2.S3 - CLN3 mRNA secondary structure is altered when the mRNA sequence is
scrambled or refolded ... 40 Figure 2.S4 - Regions of Complementarity between CLN3 and BNI1 ... 41 Figure 2.S5 - CLN3 mRNA secondary structure is altered with point mutations to
target stem loops ... 42 Figure 2.S6 - Regions of complementarity between BNI1 and SPA2... 43 Figure 2.S7 - Disruption of regions of complementarity interferes with coassembly
between two RNAs ... 44 Figure 2.S8 - Whi3 binding sites are located in highly structured region along
BNI1 mRNA... 45 Figure 2.S9 - The majority of Whi3 binding sites are located in highly structured region
along SPA2 mRNA ... 46 Figure 2.S10 - Whi3 binding is essential to induce dynamic fluctuations to its target
mRNAs, CLN3 and BNI1 ... 47 Figure 3.1 - Whi3 proteins interacts with its own transcript in vitro and in vivo. ... 54 Figure 3.2 - Effects of crowding on Whi3 condensation ... 57 Figure 3.3 - Heterogeneous crowding conditions in Ashbya is influenced by Whi3
CHAPTER 1:INTRODUCTION Cytosolic organization of cellular RNAs and proteins
Localization of mRNA also promotes the coordinated control of gene expression in both space and time, allowing especially large cells to accurately regulate translation in response to specific cues. For example, cells can use co-localized mRNAs to co-translate protein products that will act together or assemble (e.g. tubulin) (Cleveland et al., 1981). Having the mRNAs co-localized provides the cell with proteins in the same area, thus increasing efficiency of the assembly of complex, larger multimeric structures. Finally, many types of cells use RNA localization in their stress response pathways, halting translation of housekeeping proteins in order to divert resources to respond to the given stress. Altogether, there are many potential contexts where it is advantageous to control transcript position, as well as their encoded protein abundance and timing of production.
mRNAs and RBPs localize to and promote the formation of liquid-like cell compartments
properties, droplets can be selective and either retain or exclude specific molecular species, including different mRNAs.
Ribonucleoprotein (RNP) granules are membrane-less compartmentalized bodies that package mRNAs and proteins together to regulate the localization, translation, and degradation of messenger RNAs (Buchan and Parker, 2009). Recent research has shown that these granules form through concentration-dependent phase separation to sub-compartmentalize the nucleoplasm and cytosol (Brangwynne et al., 2009; Feric et al., 2016; Li et al., 2012; Saha et al., 2016; Zhang et al., 2015). Many such compartments have been discovered and shown to be involved in diverse cellular processes in eukaryotic cells and in some species of bacteria (Brangwynne et al., 2011; Feric and Brangwynne, 2013; Jiang et al., 2015; Lee et al., 2015; 2013; Monterroso et al., 2016; Rog et al., 2017; Shin and Brangwynne, 2017; Strom et al., 2017; Su et al., 2016). Control of condensation can restrict diffusion of cytosolic components to retain them in a particular region of the cell and is thought to, in some cases, promote and, in others, prevent biochemical reactions by sequestering components in the condensed state. Phase separation is a simple yet powerful mechanism to control the spatial localization and processing of molecules, without relying on the intensive construction and maintenance of membrane boundaries. Furthermore, as previously mentioned, post-translational modification and dynamic changes to specific mRNA and protein composition could rapidly control alterations of the material state of these assemblies. This potential for lability may be a critical intrinsic feature of biological condensates in promoting adaptive responses to fluctuating environments (Monahan et al., 2017; Riback et al., 2017).
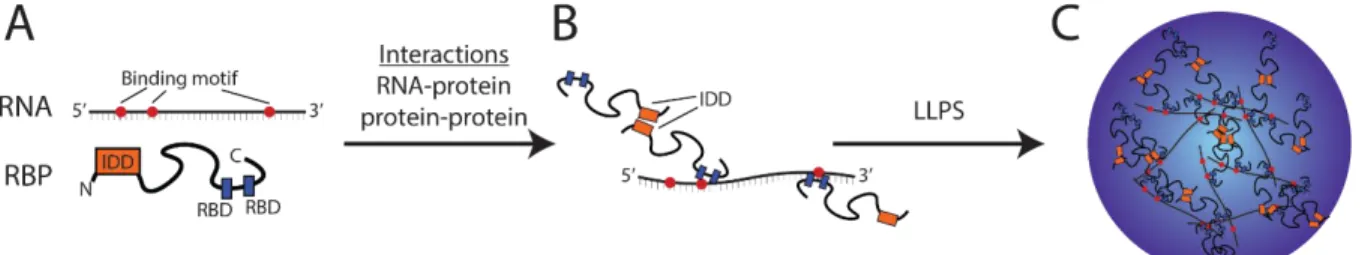
Frenkel, 2017; Wall, 1954). Increasing evidence suggests that liquid-like RNP granules can also form through weak, multivalent interactions between RNA-binding proteins and bound RNAs (Figure 1.1). Many RNA-binding proteins have intrinsically disordered domains (IDDs), as well as an RNA binding domain (RBD) and, in many cases, multiple RBDs. Multi-valency is contributed by several different kinds of interactions at both the protein and RNA level. IDDs come in many forms and frequently are low complexity sequences. It is thought that IDDs promote transient interactions including cation-pi, electrostatic, and hydrophobic interactions, linking proteins together into a dynamic network in which each protein has multiple points of potential interaction with other proteins (Brangwynne et al., 2015b; Harmon et al., 2017). The actual molecular grammar in RBP protein-protein interactions that gives specificity and ensures particular combination of RBPs interact is just beginning to be understood.
Another source of multi-valency comes from the RNA sequences. In cases where specific binding sites for an RBP on an RNA are known, they can be found in multiple copies interspersed across the sequence (Cereda et al., 2014; Falkenberg et al., 2017). Additionally, the same mRNA can harbor multiple binding sites for different RNA-binding proteins, providing a way to recruit different combinations of RBPs to the same RNP complex (Brangwynne et al., 2015a; Lin et al.,
Figure 1.1 Multi-valent interactions between RNAs and RNA-binding proteins promote liquid-liquid phase
separation. A. RNA molecules can contain multiple RNA-binding protein (RBP) binding motifs (red dots). These
2015; Molliex et al., 2015). In these situations, a given RNA has the potential to bind multiple RBPs and if an RBP has multiple RNA-binding motifs, an interconnected polymer network can readily emerge (Figure 1.1). The most common RBD is the RNA recognition motif (RRM), a highly structured domain consisting of approximately 90 amino acids with eight conserved aromatic residues that mediate binding through interaction with certain RNA bases (Maris et al., 2005). In other cases, mRNAs are bound via a series of glycine-arginine rich sequences (RGG boxes) along the RBP and it is extremely common for multiple RGG sequences to be clustered together in the primary sequence of an RBP, allowing for various multivalent interactions between the mRNA and RBP. Notably, the RGG sequence can also promote protein-protein interactions, providing yet another layer of multi-valency to promote phase separation (Thandapani et al., 2013). Thus, the combination of both RNA-binding motifs and IDDs on RBPs and RNA sequence features predict that phase separation could be an emergent property of these molecules combining together. It is likely that multivalent interactions at the level of both the proteins and RNAs are a fundamental first step to the self-assembly of most RNPs in cells.
mRNA influences the physical properties of RNP droplets
for the liquid-like state of the nucleolus (Weber and Brangwynne, 2015), and while RNA can lower the critical concentration needed for an RBP with IDDs to phase separate, high concentrations of mRNA can actually inhibit droplet formation (Burke et al., 2015; Zhang et al., 2015). High RNA concentration has been indicated to play a role in preventing the RBP FUS from forming assemblies in the nucleus of mammalian cells, suggesting that RNA can exert differential effects depending on local abundance (Maharana et al., 2018). Understanding how the local concentration of either total RNA or specific mRNAs controls the assembly and disassembly of liquid compartments is an area with much room for future study to fully understand the role of LLPS as both a cause and consequence of RNA subcellular localization.
yeast stress granules are more solid-like and P-bodies are more liquid-like. Given that RNP droplets can occupy a wide landscape of physical states, it will be critical to discern how the material states of RNP droplets influence the function of mRNAs within these structures.
High-resolution microscopy and in vitro reconstruction of RNP granules have shown that all share relatively similar spherical droplet-like shapes and dynamics consistent with LLPS, such as wetting, dripping, and fusion (Hyman et al., 2014). These common material properties arise despite the fact RNA droplets are formed from diverse molecular components and serve different functions. RNAs may control the physical properties of droplets either due to intrinsic features of the RNA polymer, such as length or structure, or by modulating the proteins that are co-assembled with RNAs. In fungi, different mRNA sequences are associated with different relative amounts of RNA-binding proteins incorporated into droplets (Langdon et al., 2018). Variability in the concentration of RBPs in droplets might emerge from different affinities of the RBPs for different mRNAs or different accessibility of the binding sites for proteins on the mRNAs. These differences in RBP concentration, in turn, could readily contribute to differential biophysical properties of droplets that house different mRNAs. The degree to which these variations in biophysical states arise directly from the features of the RNA polymer or from RNA-dependent differences in RBP recruitment remains to be understood.
RNA sequence contributes to the molecular identity of RNP droplets
RNA (Feric et al., 2016). Similarly, SGs are shown to have at least two coexisting material states, where more solid-like cores are surrounded by more fluid layers (Jain et al., 2016). In animals, where germline granules are large enough to resolve specific populations of RNAs, specific groups of mRNAs take residence in distinct zones within a granule, indicating that there can be sorting of specific mRNAs within a single droplet, as described in more detail below (Trcek et al., 2015). Thus, RNA has the potential to influence when and where condensation occurs, which components co-assemble, the emergent physical properties of droplets, and the substructures within droplets. However, many major outstanding questions remain a focus in this field. How is RNA regulated within liquid compartments? How are so many distinct RNA-based compartments formed and maintained as distinct entities when they share such similar physical properties? What rules govern the selective incorporation or exclusion of particular RNAs into liquid droplets?
It has long been appreciated that RNA can modulate the protein-binding behavior of RBPs through certain structural contexts, where it has been shown that proteins prefer to bind certain “zip codes” or secondary structures of RNAs ( Ferrandon et al., 1997), Taliaferro et al., 2016; Tamayo et al., 2017). The first example of this phenomenon was demonstrated in the Drosophila
embryo where formation of the anterior pole was shown to be driven by the localization of bicoid
mRNA, where it interacts with the Staufen protein to form RNP granules, delineating the morphogen gradient (Ferrandon et al., 1997). The interaction between bicoid and Staufen is mediated through the intermolecular dimerization of bicoid mRNA molecules to recruit Staufen, and the secondary structure of the bicoid 3’ UTR is necessary for this interaction. It has been shown in multiple studies that the 3’ UTR is important for localization of mRNAs to their correct places in a variety of cell types (Mayr, 2016). Structured illumination microscopy of RNA granules in
transcripts are not randomly organized in RNA granules. Interestingly, while proteins were found to be homogeneously positioned within granules, mRNAs, on the other hand, were found to be localized in homotypic clusters (Trcek et al., 2015). It is likely, in this instance, the mRNA molecules interact with one another in a sequence-specific manner to give rise to the clusters. Thus, RNA interactions are likely relevant for the sorting of specific mRNAs to diverse RNA-granules and RNA-RNA interactions may in fact be a central component of physiological RNP granule assembly.
Two recent studies have shown that mRNA itself can form phase separated droplets within the nucleus of mammalian cells, and this is dependent on the number of nucleotide repeat expansions that are able to form stable G-Quadruplex structures. These repeat expansions serve as scaffolds for multivalent RNA-RNA interactions that allow clusters of RNAs to transition in vitro
into a sol-gel, a state somewhere between solid and gel, and in cells into aggregates linked to neurological disease (Jain and Vale, 2017). In addition, stress granules contain cores of interacting mRNA and protein molecules (Jain et al., 2016; Wheeler et al., 2016) and, recently, it has been shown that these cores form through RNA-RNA interactions of non-translating mRNAs (Van Treek et al., 2018), potentially seeding the formation of RNP granules. These few examples are likely representatives of what will become a longer list of mRNA localization mechanisms dependent upon RNA-RNA interactions.
Cytosolic organization in the syncytial cytoplasm of Ashbya gossypii
among separate nuclei and coordinate growth over large areas. Examples of multinucleated, syncytial cells include filamentous fungi like Neurospora crassa and Ashbya gossypii, as well as mammalian skeletal muscle and placental syncytiotrophoblast cells. Syncytia can grow to be very large, on the order of centimeters, and can exhibit complex geometries, such as those characteristics of filamentous fungi. Therefore, cytosolic organization likely requires complex mechanisms to coordinate the various cellular functions present, and large, multinucleate cells like syncytia will be especially sensitive to defects in these processes. As seen in a number of syncytial organisms, nuclei behave independently from one another with respect to cell cycle (A. gossypii
and N. crassa), and transcription (skeletal muscle and placenta) (Roper et al. 2011, Serner et al. 1978, Bursztajn et al. 1989, Gladfelter et al. 2006, Fogarty et al. 2011). Independent nuclear behavior within a continuous cytoplasm is consistent with the spatial organization of cytosolic regulators, as they are not shared equally across all cytoplasmic regions. For cytosolic regulators such as mRNA and/or protein molecules, diffusion may be restricted, such that each individual nucleus will be exposed to these various signals only at the correct time.
critical for local control of two distinct cellular processes in a spatially and temporally restricted manner (Lee et al. 2013, 2015; Zhang et al., 2015, Langdon et al., 2018).
In A. gossypii, as well as many filamentous ascomycete fungi, nuclei maintain transcriptional autonomy and divide asynchronously despite sharing a common cytoplasm (Anderson et al., 2013; Dundon et al., 2016; Gladfelter et al., 2006; Lee et al., 2013). Asynchronous division requires that individual nuclei are insulated from one another, thus not impacting each other’s division cycle. To achieve this, cyclin transcripts are not free to diffuse as they are bound by the RNP Whi3. The formation of RNP droplets localizes mRNAs near their source nuclei and, we predict, locally regulates their translation (Lee et al., 2013). Two domains of Whi3 affect its ability to form phase separated droplets in vitro and heterogeneously localize its target mRNAs in the cytosol: the RNA recognition motif (RRM), responsible for binding RNA, and the polyQ tract, a region with an enrichment of glutamine residues (Lee et al., 2013; 2015; Zhang et al., 2015).
Concluding Remarks
As described above, eukaryotic cells can use liquid-like droplets to cluster mRNAs and proteins together, and it has become increasingly clear in recent years that mRNA localization is a mechanism cells use to compartmentalize their cytosol for the spatial and temporal control of diverse biological processes. This is especially evident in syncytia, where cellular communication must travel large distances and be coordinated between multiple genomes. In multinucleate fungi, biological condensates may prevent sharing of regulators among nuclei, but there are many questions in this field. How these cells and their individual nuclei employ phase separation to organize RNAs and proteins within the cytosol, in order to respond dynamically to the needs of the cell, are just now beginning to be understood. Further, it is unknown exactly how RNA sequences evolve to organize cytosol of different volumes, and how the function of RBPs capable of LLPS respond to changing cellular conditions. All of these are critical questions for the role of RNA mediated phase separation in cytosolic organization that can be studied in syncytia. The coexistence of two functionally distinct populations of RNP droplets makes Ashbya a powerful system to study how different mRNAs are sorted into distinct droplets and how cells control when and where condensation occurs.
and that intermolecular interactions between mRNAs can provide the nucleation event for RNA granule formation (Khong et al., 2017; Van Treek et al., 2018), but it is unclear which particular mRNAs, if any, are important for assembly. Purification of RNA granules from mammalian cells has also revealed that some RNA granules contain thousands of different mRNA molecules, and that mRNAs that translate proteins that are expressed at low levels are more likely targeted to granules (Rao and Parker, 2017), suggesting that there might be some selection of mRNAs based on the state of translation within the cell during a response to internal or external cues.
CHAPTER 2: MRNA STRUCTURE DETERMINES SPECIFICITY OF A POLYQ-DRIVEN PHASE SEPARATION
Introduction
Formation of non-membrane bound organelles through the condensation of macromolecules is a recently appreciated mechanism of intracellular organization. These liquid-like condensates form through liquid-liquid phase separation (LLPS) and are found in the cytoplasm and nucleus (Banani et al., 2017; Shin and Brangwynne, 2017). A fundamental unsolved problem is how liquid droplets recruit distinct constituents and retain independent identities. RNA can drive LLPS and modulates the material properties of droplets (Elbaum-Garfinkle et al., 2015; Lin et al., 2015; Zhang et al., 2015; 2017), but it is unknown if RNA controls the identity and maintenance of coexisting liquid compartments. Here we show mRNA secondary structure is required for droplet identity through directing interactions between mRNAs and RNA-binding proteins.
Results and Discussion
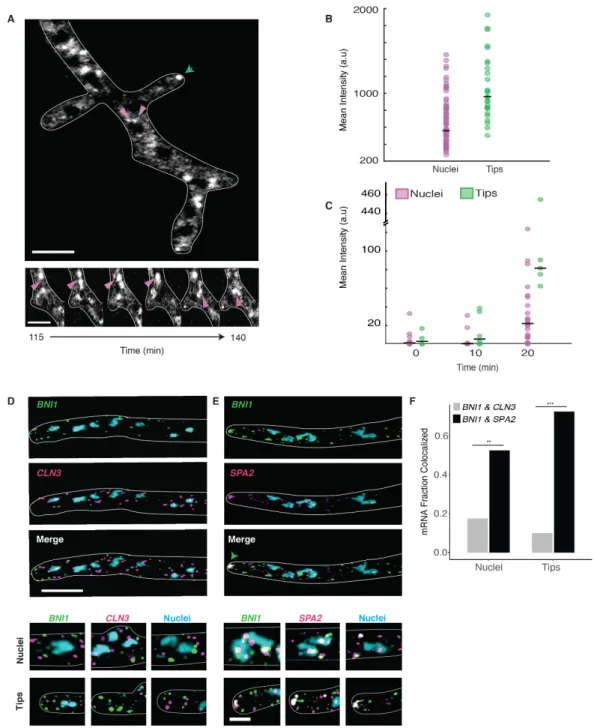
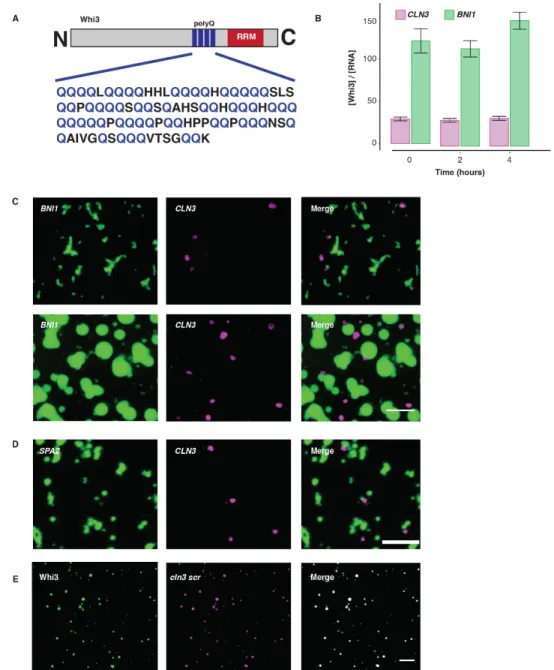
Figure 2.1 Cyclin and Polarity complexes are spatially and physically distinct within the cell.A. Top, Whi3 forms liquid droplets in Ashbya gossypii. Below, Whi3 droplets accumulate and fuse around nuclei. Green arrows denote polarity droplets. Pink arrows denote perinuclear droplets. Scale bars 5 µm. B. Mean intensity of Whi3-tomato is higher in tip droplets (green) than perinuclear droplets (pink). C. Rate of Whi3 incorporation is higher in tip compared to perinuclear droplets. D. smFISH images show BNI1 (green) and
CLN3 (pink) mRNAs are spatially distinct.Nuclei are in blue. Scale bar 5 µm. E. smFISH images show
BNI1 (green) mRNAs co-localize with polarity mRNA SPA2 (pink). Nuclei are in blue. The green arrow marks where the RNAs overlap at the tip. Inset scale bar 2 µm. F. BNI1 and SPA2 are significantly more co-localized than BNI1 and CLN3. p<0.001 for tips and p<0.01 for nuclei (Fisher’s Exact test). n= 40 nuclei
cyclin CLN3) or actin (e.g. the formin BNI1 and SPA2) (Zhang et al., 2015). Distinct types of Whi3 droplets form in Ashbya cells: perinuclear CLN3 droplets and BNI1 droplets at sites of polarized growth at cell tips ((Lee et al., 2013; 2015), Figure 2.1A). These two types of droplets have different Whi3 levels and Whi3 incorporation rates (Figure 2.1, B and C), suggesting they are structurally distinct.
The distinct droplet properties may depend on extrinsic features of the local cytosolic microenvironment or arise due to different droplet constituents. CLN3 and BNI1 mRNAs minimally co-localize in the cytoplasm by single molecule (sm) RNA F.I.S.H., although they were occasionally co-expressed by the same nucleus (Figure 2.1, D and F). The lack of co-localization suggests there are intrinsic, compositional differences between droplets. In contrast, mRNA of the polarity regulator SPA2, frequently co-localized with BNI1 mRNAs, especially at growth sites (Figure 2.1, E and F). Thus, mRNAs encoding functionally related proteins co-localize, while functionally unrelated mRNAs do not. How can distinct Whi3-binding mRNAs segregate to different droplets in a common cytoplasm?
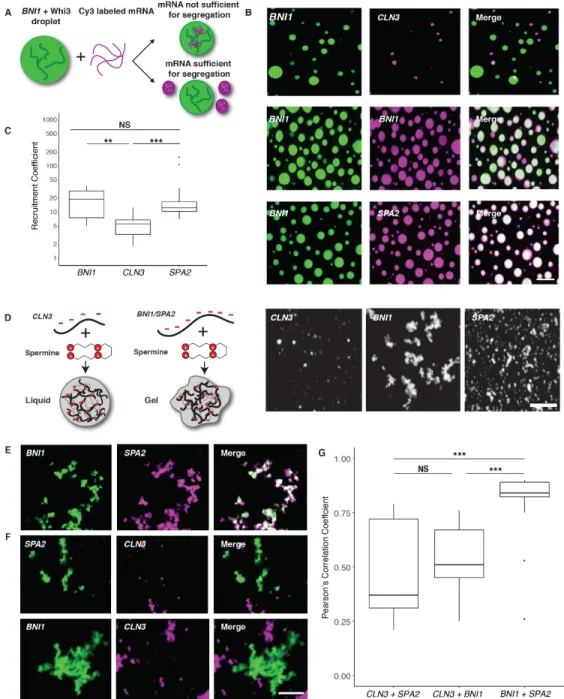
To address this question, we employed a reconstitution system to test if mRNA sequence was sufficient to generate droplet individuality (Figure 2.2A). In vitro, as in cells, droplets composed of BNI1 mRNA displayed higher Whi3 to RNA molar ratios than droplets made with
CLN3 mRNA (Figure 2.S1B). Remarkably, when CLN3 mRNA was added to Whi3 droplets made with BNI1 mRNA, CLN3 preferentially assembled into new droplets, rather than incorporating into BNI1 droplets (Figure 2.2, B and C, 2.S1C). In contrast, BNI1 mRNA readily incorporated into preformed droplets (Figure 2.2, B and C). Notably, SPA2 mRNA incorporated into BNI1
Thus, as in cells, cyclin and polarity mRNAs assemble into distinct and immiscible droplets in vitro, indicating droplet identity is encoded by the mRNA.
mRNA sequences could influence droplet identity by favoring homotypic or specific heterotypic interactions between RNA molecules. To test for specific RNA-RNA interactions, we used a protein-free system to induce electrostatic-mediated phase transitions of the mRNA (Jain and Vale, 2017), where all mRNAs were capable of homotypic assembly into liquid or gel-like droplets (Figure 2.2D). Strikingly, CLN3 mRNAs had minimal co-localization with BNI1 or SPA2
mRNAs, whereas BNI1 and SPA2 were significantly more co-localized (Figure 2.2 E–G). Thus, sequence-encoded features of the mRNA can underpin the assembly of distinct, immiscible structures.
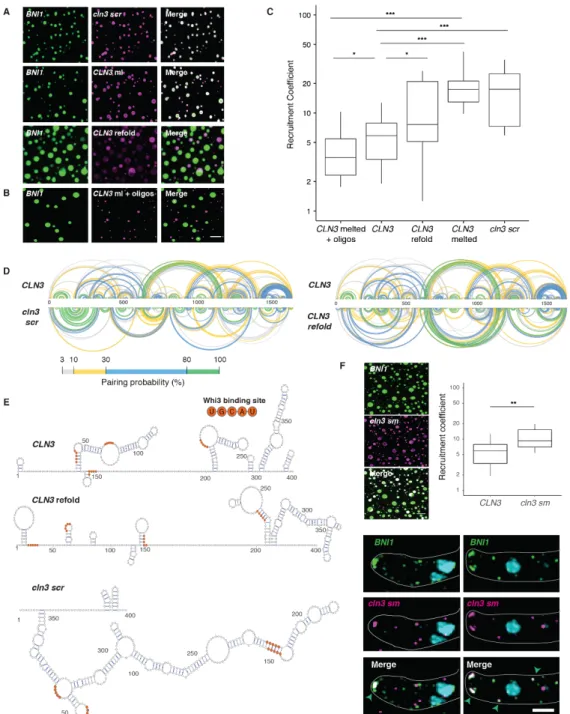
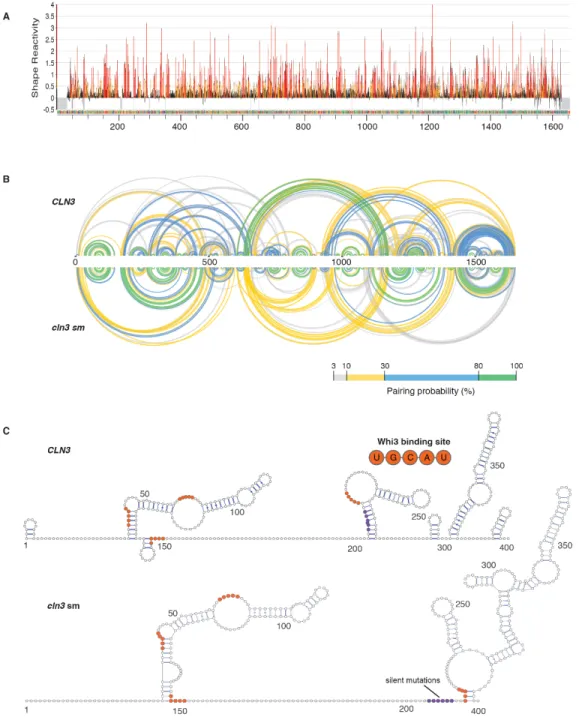
We next investigated which features of the mRNA sequence generate specificity. An mRNA with scrambled CLN3 coding sequence (cln3scr) with intact Whi3-binding sites formed Whi3 droplets (Figure 2.S1E), but no longer showed specificity (Figure 2.3, A and C). As the length, nucleotide composition, and Whi3 binding sites were identical, we hypothesized the secondary structure could promote specificity. CLN3 mRNA heated to 95 ºC to disrupt secondary structure also readily incorporated into Whi3-BNI1 droplets (Figure 2.3, A and C). Melted CLN3
mRNA that was slowly refolded (CLN3 refold) showed significantly less recruitment than melted, but more than native CLN3 (Figure 2.3A and C). Mixing between melted CLN3 and melted BNI1
Figure 2.2 Polarity and cyclin complexes segregate in vitro. A. Experimental schematic of in vitro droplet recruitment assay. B. CLN3 mRNA (pink) is not efficiently recruited but BNI1 or SPA2 mRNA (pink) are recruited into preformed Whi3-BNI1 droplets (green) based on fluorescence microscopy. Scale bar 10 µm. C. Recruitment coefficients of mRNA from B. Boxes indicate interquartile range, line is median and whiskers contain points within three times the interquartile range, and outliers are indicated with (•) marks. NS, not significant, p > 0.05; **, p <
0.01; ***, p < 0.001 (t test). n ≥500 droplets for N≥3 biological replicates. D. Cartoon schematic and representative images showing in vitro RNA-only droplet assay where CLN3, BNI1, and SPA2 mRNAs assemble into liquid or gel-like droplets. Scale bar 5 µm. E. Fluorescence microscopy images showing BNI1 RNA (green) colocalizes with SPA2
RNA (pink) in droplets. F. Fluorescence microscopy images showing CLN3 RNA (pink) does not colocalize with
SPA2 (green) and BNI1 (green) droplets. Scale bar 5 µm. G. Quantification of co-localization between BNI1 and SPA2,
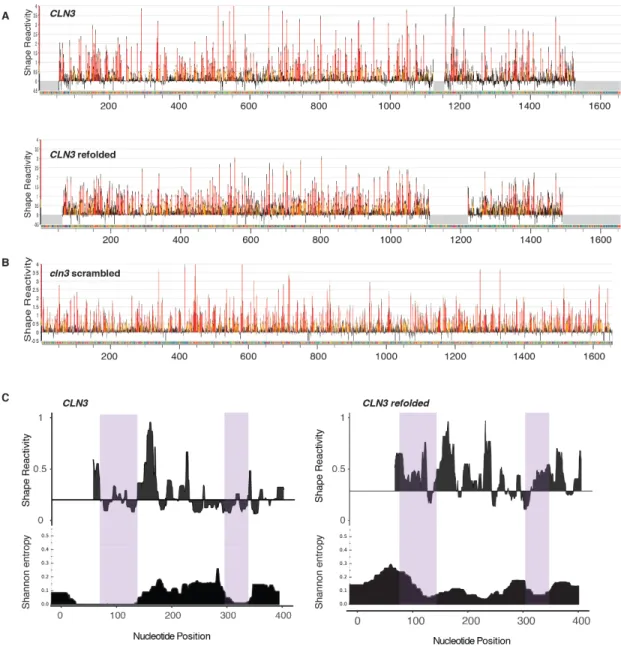
To identify what features of CLN3 mRNA secondary structure promote specificity, we performed SHAPE-MaP, which identifies highly flexible regions in RNA (Smola et al., 2015), to determine secondary structure changes, on native, refolded, and scrambled CLN3 mRNA (Figure 2.3D, 2.S3, A and B). The first 400 nucleotides in the CLN3 sequence exhibited especially low SHAPE reactivity (Figure 2.S3C, purple shaded regions), suggesting many paired nucleotides and a highly folded structure. Refolded CLN3 had a significant increase in SHAPE reactivity compared to native CLN3 (Figure 2.S3A, p <0.001, Wilcoxon rank sum test), indicating a transition to a more unstructured state (Fig 2.3, D and E). Melting and refolding thus allows the RNA to sample different conformations from those formed during transcription. As expected, cln3scr showed a different SHAPE profile with dramatically altered secondary structure (Figure 2.3 D and E, 2.3S3B).
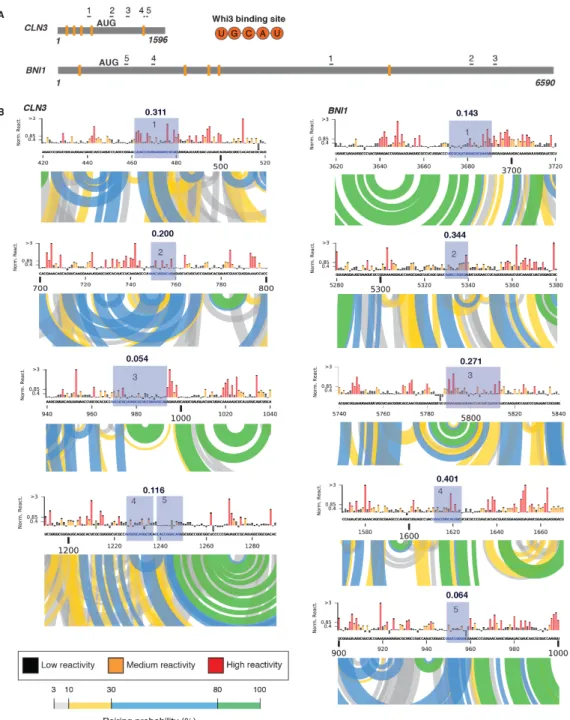
We hypothesized secondary structure influences mRNA sorting, as stem-loops may selectively display or mask sequences capable of hybridizing with other RNAs. CLN3 contains five complementary regions to BNI1 (Figure 2.S4A), most of which had low SHAPE reactivity and therefore were more structured (Figure 2.S4B), suggesting these regions are inaccessible for hybridizing with BNI1. We hypothesize these regions became available to pair with BNI1 when
CLN3 is melted, causing the structure-dependent loss of droplet specificity. To test this hypothesis, oligonucleotides (i.e., oligos) complementary to these regions were added to melted CLN3 and significantly decreased the co-assembly with BNI1, restoring the formation of distinct CLN3
Figure 2.3 RNA secondary structure determines specificity and identity of Whi3-CLN3 droplets. A.
Fluorescence microscopy images showing the recruitment of scrambled (cln3 scr), melted (CLN3 ml), and refolded
CLN3 (CLN3 refold) mRNA (pink) into preformed Whi3-BNI1 droplets (green). B. Fluorescence microscopy images showing the loss of recruitment of CLN3 ml when mixed with oligonucleotides targeting complementary sequences of CLN3 to BNI1. Scale bar 10 µm. C. Quantification of A and B. *, p<0.05; **, p<0.01; ***, p < 0.001 (t test). n≥500 droplets for N≥3 biological replicates. D. Base pairing probability from SHAPE-MaP of CLN3, cln3 scr, and CLN3 refold show differences in the secondary structure in CLN3. Arcs connect base pairs and are colored by probability. E. Secondary structure models from SHAPE-MaP for the first 400 nucleotides of CLN3, CLN3
refold, and cln3 scr. Whi3 binding sites are in orange. F. CLN3 structure mutant (cln3 sm) mRNA is significantly recruited to Whi3-BNI1 droplets in vitro and in vivo.**, p<0.01 (t test). Green arrows denote sites of co-localization between BNI1 mRNA (green) and cln3 sm mRNA (pink) by smFISH. Scale bar 10 µm for in vitro, 2 µm for in vivo.
We next asked if exposed complementarity explains co-assembly of BNI1 and SPA2 into the same droplets. Indeed, SHAPE-MaP analysis of BNI1 and SPA2 showed complementary regions between these co-localizing mRNAs having significantly higher SHAPE reactivity and less structure compared to the CLN3/BNI1 regions (Fig 2.S4 and 2.S6; p < 0.002, t test). Addition of complementary oligos to these regions disrupted co-localization in the presence of Whi3 and in RNA-only reactions (Figure 2.S7, A and B). We predicted that CLN3 may self-assemble and indeed cln3 codon, a CLN3 mutant whose codons have been randomized but Whi3 binding sites remain intact, does not co-localize with endogenous CLN3 mRNA in cells, further supporting RNA interactions in co-assembly of related RNAs (Fig 2.S7C). These data suggest RNA-RNA interactions based on intermolecular hybridization direct RNA-RNAs into the same or different droplets.
Does Whi3 protein influence the identity of droplets? The majority of Whi3 binding sites are exposed on stem loops in CLN3, BNI1, and SPA2 (Figure 2.3E, 2.S8 and 2.S9). Notably, refolding or scrambling the CLN3 sequence rearranges the presentation of Whi3 binding sites (Figure 2.3E). Therefore, RNA secondary structure may influence Whi3 binding and contribute to droplet composition and immiscibility in addition to RNA complexing. SHAPE-MaP of CLN3
Figure 2.4 Whi3 binding alters RNA behavior. A. Differences in SHAPE reactivities (ΔSHAPE) were calculated
by subtracting CLN3 SHAPE reactivities from CLN3+ Whi3 reactivities. Positive ΔSHAPE values indicate protection
from modification in the presence of Whi3 and negative ΔSHAPE reports enhanced reactivity in the absence of Whi3
protein. B. Base pairing probability compared between CLN3 and CLN3 with Whi3 shows rearrangements in CLN3
To examine the consequence of Whi3 binding to RNA, we used smFRET (Figure 2.4C) to measure the conformational dynamics of CLN3 and BNI1 mRNAs with and without Whi3 (Kim and Myong, 2016). In the absence of protein, CLN3 RNA showed high FRET values indicative of a compacted state, while BNI1 RNA showed lower FRET values, indicating a less compact state (Figure 2.4D, purple shaded regions). Upon addition of Whi3, CLN3 FRET values decreased, indicating more extended RNA conformations were induced, dependent on the ability of Whi3 to bind mRNA (Fig 2.S10, B and C). In contrast, bound to Whi3, BNI1 RNA showed a more substantial broadening of FRET values (Figure 2.4D), indicating Whi3-BNI1 complexes are more dynamic. Dwell-time analysis revealed Whi3-induced dynamics are three times faster for BNI1
than CLN3 (Figure 2.4E). Different mRNAs thus react differentially in their intramolecular fluctuations to the presence of Whi3, providing an additional mode of RNA droplet regulation.
These FRET studies suggest Whi3 binding alters the conformational dynamics of target RNAs. We speculate these differential dynamics help maintain droplet identities established by RNA-RNA interactions. Once RNA-RNA interactions are formed, Whi3 binding may reduce the ability of the RNA to resample many alternate RNA structures to maintain the identity. Additionally, the slower fluctuations of CLN3 bound to Whi3 may be one source of exclusion from the more rapidly fluctuating BNI1-Whi3 complexes in those droplets. Such dynamics may drive the droplet material properties reported previously (Zhang et al., 2015) and serve as barriers to homogenization.
the timing and location of how mRNA secondary structure influences selective uptake of cellular constituents into droplets. Protein binding to different RNAs can lead to varied dynamics of complexes, further distinguishing the physical properties of different droplets and promoting immiscibility of coexisting droplets (Figure 2.4F). Given the large number of distinct, RNA-based condensates in the cell, these mechanisms are likely broadly relevant to explain how droplets achieve and maintain individuality.
Materials and Methods
Plasmid and Strain Construction
To create pcln3sm::GEN; cln3∆::NAT1 construct, under the control of its own promoter, the entire plasmid AGB237 (pCLN3- GFP::GEN3, AMP) was amplified using primers Phusion polymerase (New England Biolabs) and AGO2308 (GGGCTGTTA
ATATCTCATACCCGTTGTGGTTTGCATATTATACACATATTCG) and AGO2309 (CGAATATGTGTATAATATGCAAACCACAACGGGTATGAGATATTAACAGCCC). This mutated a region 31 base pairs upstream of the ORF from AACACC to TTGTGG. The reaction was digested with DpnI (New England Biolabs). The 5’UTR, ORF, and 3’UTR were sequenced by Genewiz, confirming that TTGTGG was the only mutation. This plasmid was transformed into
To create the pcln3scr2; ∆l∆t, a geneblock containing the scrambled coding sequence for
CLN3 was ordered from GenScript and amplified with primers 5’
TAAACGAAGGCAAAGAGCTCGGTACCCGGGGACGTTCACTAATCTTAATACG 3’ and 5’GTGAAAAGTTCTTCTCCTTTACTCATCTCAGTACGCGGCCGCTCGAGAGATCTTGT AATTAATCCTGC 3’. AGB392, a plasmid containing GFP under the control of the S. cerevisiae HIS3 promoter, was cut with BamHI and SpeI restriction enzymes to linearize the plasmid. The
CLN3 scr2 amplified coding sequence was cloned into the cut AGB392 vector using NEBuilder HiFi DNA Assembly (New England Biolabs). Cloning was confirmed via sequencing (Genewiz) using 5’ TGGTTATGGCGCCCTCACAG 3’ and 5’ GCCCATTAACATCACCATCTAATTC 3’. This plasmid was transformed into WT A. gossypii (AG416) via electroporation and selection on AFM+G418 plates.
Cell culture and Imaging
highest intensity pixel. All image processing and analysis for in vivo experiments was carried out in either Fiji or MATLAB For Whi3-tomato measurements, N=2 independent experiments with n=4 cells, 73 perinuclear droplets and 27 tip droplets were measured and for Whi3-Halo, N=2 independent experiments n=7 cells, 40 perinuclear droplets and 15 tip droplets were measured.
Single molecule RNA F.I.S.H and Imaging
Analysis of mRNA fraction co-localized
An 8 X 10 ROI was generated at the tips of hyphae or around individual nuclei in merged images. Percent of co-localization was determined by counting the presence of overlapping signal from each of the individual mRNA channels. A total of 40 tips and nuclei were used for analysis and taken across at least 2 biological replicates. mRNAs inside the nucleus were counted and co-localization events inside the nucleus were counted as well.
Recombinant Protein Expression and Purification
Protein purification was performed as previously described (3). In brief, full length Whi3 or whi3-Y610-F653A was tagged with an N-terminal 6-Histidine tag and expressed in BL21 E. coli
(New England Biolabs). For labeled protein, full length Whi3 was tagged with a C-terminal GFP. Cells were lysed in lysis buffer (1.5M KCl, 20 mM Tris pH 8.0, 20 mM Imidazole pH 8, 1 mM DTT, 1 tablet of Roche protease inhibitor cocktail). The supernatant was incubated and passed over a Ni-NTA resin (Qiagen) in gravity columns. The resin was then washed with 10CV lysis buffer and protein was eluted with 6CV elution buffer (150 mM KCl, 20 mM Tris pH 8.0, 200 mM Imidazole pH 8.0,1 mM DTT). The fractions containing Whi3 protein were dialyzed into fresh droplet buffer (150 mM KCl, 20 mM Tris pH 8.0, 1 mM DTT) and measured with Bradford reagent. Aliquots of protein were flash frozen and stored at -80 ºC.
RNA Transcription
The T7 promoter 5’ TAATACGACTCACTATAGGG 3’ was cloned into the 5’ end of
UTP or cy5-UTP (GE Healthcare) was added into the transcription reaction. Transcribed RNAs were then treated with DNase, precipitated with LiCl, and washed with 85% ethanol before being re-suspended in TE buffer and stored at -80 ºC.
Droplet Assembly and Imaging
SPA2 was mixed with a 100 nM mixture of the 4 oligo nucleotides (Supplemental Table 2). This mixture was then incubated at 25 ºC for 10 min in a thermocycler before being added to BNI1
droplets and imaged. At least five independent imaging areas were analyzed for each condition for each replicate. Data shown are representative of three or more independent replicates, across at least two RNA and protein preparations.
RNA Spermine experiments and analysis
For RNA spermine experiments, 10 nM in vitro transcribed mRNAs were incubated for 4 hours in Spermine buffer (10 mM Spermine tetrahydrochloride (Sigma), 20 mM KCl, 10 mM MgCl2) as previously described (14) and then imaged on a custom spinning disk confocal
Correlation Coefficient between the two background-subtracted channels. The Wilcoxon Rank Sum Test was used to test for statistical significance between experimental conditions.
The DNA oligonucleotide sequences (IDT) used are as follows.
CLN3 to BNI1:
30 mer 461-479: 5’tcaaagTGCGCATCTCCACGGTAAGttccg 3’ 30 mer 748-758: 5’cagagcacaCAGACCAGTTAaggctcttga 3’
30 mer 969-992: 5’ctaTGAACTCGGAGAGCTCAGCGAGTCgga3’ 30 mer 1225-1248: 5’gcaCTGTCCGGTGCtGAGCCTGCACATggc 3’
SPA2 to BNI1: 30 mer 55-85: 5’ GGGTCGAGCTTagacctgggcgcaggcatt 3’30 mer 1266-1296: 5’ gtcgaaAGTGATGATATCAACAGaggatgg 3’
30 mer 4173-4203: 5’tcgggcTGCTTCTCCAGGATCATtggtgtc 3’ 30 mer 4294-4324: 5’ tcgcctTTTAATTTTGAGACTTCatcaggg 3’ 30 mer 10018-10048: 5’ tcgaatataAGCCGCACCGCCtcccactct 3’
Analysis of RNA Recruitment
We calculated a Recruitment Coefficient (RC) for RNAs added into preformed Whi3-BNI1
droplets which is defined by the following equation:
where RC is the recruitment coefficient, [RNA]PD is the concentration of added RNA (cy3) within
the preformed droplets, [RNA]O is the concentration of added RNA (cy3) outside the preformed
were split into preformed droplets (cy5) and added RNA (cy3). A mask was created on the preformed droplet channel after background subtraction. Droplets were identified using the 3D objects Counter plugin, with intensity threshold of 1480 for data acquired on the Yokogawa CSU-X and 100 for data acquired on the Nikon CSU-W1. This method was used to obtain the integrated density of the cy3 channel and the area of the preformed droplets. Average mean fluorescent intensity (MFI) of preformed droplets was then calculated as the sum of integrated density across the z-stack volume divided by sum of area across the z-stack volume. Then, per z-stack volume, inverse selection of preformed droplets is measured for integrated density and area. Average MFI outside preformed droplets calculated as above. MFI values are converted to dye concentration using linear fit of a concentration curve of cy3 dye (one for each instrument). RNA concentrations were obtained by normalizing the dye concentration by the average number of dye molecules incorporated into each different RNA. To calculate significance between different RNAs, unpaired t tests were performed on log-transformed RC values between experimental conditions in R version 3.4.
Analysis of Whi3 to RNA ratios
as the average Whi3 concentration divided by the average RNA concentration. The standard deviation of the ratio was calculated based on the following equation:
where Whi3 is the concentration of Whi3, RNA is the concentration of RNA, Var(x) is the variance of variable x, and Cov (x, y) is the covariance of variables x and y.
SHAPE-MaP experiments and Analysis
SHAPE-MaP was performed as previously described (15). In brief, 500 ng of in vitro
NNNNNGTCTGCATACCAAGGATCAGC 3’) and R1 (5’CCCTACACGACGCTCTTCCGATCTNNNNNCGGCTGGGACTGGAAGC 3’).
Libraries were purified using DNA beads (Agencourt) and sequencing libraries were pooled and then sequenced on an Illumina MiSeq instrument. SHAPE reactivity profiles were created by aligning the RNA reference sequence using ShapeMapper v 0.15 (http://.chem.unc.edu/rna/software.html). Default parameters were used and the folding module was not used. RNA structural modeling was created by Superfold with 1M7 reactivities under default parameters and deltaSHAPE was calculated and plotted using deltaSHAPE software (http://.chem.unc.edu/rna/software.html). RNA secondary structure arc plots were drawn with recently developed tools implemented in the Integrative Genomics Viewer (Smola et al., 2015).
Median read depths are reported in Table S1
RNA Modified read depth Untreated read depth
CLN3 88,775 31,645
CLN3 refold 15,989 15,380
cln3 scr 38,418 32,906
cln3 sm 101,590 98,472
BNI1 27,147 38,362
SPA2 20,936 9,314
CLN3 (amplicon) 233,978 219,741
CLN3 + WHI3 (amplicon) 37, 236 128,531
Single Molecule FRET experiments and Analysis.
A custom-built total internal reflection fluorescence (TIRF) microscope was used for all single molecule fluorescence assays. Lasers of different wavelengths were used to excite different fluorescent dyes. For FRET experiments involving Cy3 (donor) and Cy5 (acceptor) dyes, a solid state 532nm laser (75mW, Coherent CUBE) was used to excite the donor dye. For the counting of GFP photobleaching steps, a 488nm laser (50mW, Coherent Sapphire) was used. For FRET imaging, the emitted signals were separated by dichroic mirrors with a wavelength cutoff of 630nm to separate the Cy3 and Cy5 emissions. The signals were then detected by an EMCCD camera (iXon DU-897ECS0-#BV; Andor Technology). The camera was controlled via a custom C++ program, and single molecule traces extracted recorded data using IDL software. Single molecule traces were then displayed and analyzed using MATLAB and Origin software. All code can be found in the single molecule FRET (smFRET) package available at the Center for the Physics of Living Cells (https://cplc.illinois.edu/software/, Biophysics Department, University of Illinois at Urbana-Champaign).
RNA substrate prep
Single strand RNAs were ordered from Integrated DNA Technologies (Coralville, IA, USA) containing amino modifier at the labeling site. The RNAs were labeled using Cy3/Cy5 monofunctional NHS esters (GE Healthcare, Princeton, NJ, USA). Then, 10 nmol of amino modified oligonucleotides in 50 ml of ddH2O and 100 nmol of Cy3/Cy5 NHS ester dissolved in
DMSO was added and incubated with rotation overnight at room temperature in the dark. The labeled oligonucleotides were purified by ethanol precipitation.
truncated versions of CLN3 or BNI1 RNA. A Cy5-Cy3 FRET pair was placed at the junction and the 3’ end of the ssRNA, respectively (Figure 2.4C).
The RNA sequences used are as follows:
18mer for CLN3: 5’ – Biotin – UGG CGA CGG CAG CGA GGC – Cy5 – 3’
CLN3 RNA: 5’ – Cy3 – UAC CUG CAC GCG GUC GAG ACG UCU GCA UAC CAA GGA UCA GCC GCU UGC AUU AAA GGG GAC GAA CCG GGG C GCC UCG CUG CCG UCG CCA – 3’
18mer for BNI1: 5' – Biotin – ACC GCU GCC GUC GCU CCG – Cy5 – 3'
RNA: 5’ – Cy3 – AUA UUC UAC AUG AUU AUG AUG CAU UAG AGA AGG AAA ACG CCU ACU AUA AGU GUU UGA GAG UCC AUA UUC UAC AUG AU CGG AGC GAC GGC AGC GGU – 3’
RNA substrates were annealed by mixing the biotinylated and non-biotinylated oligonucleotides in a 1:2 molar ratio in T50 buffer (50mM NaCl, 10mM Tris-HCl (pH 8.0)). The final concentration of the mixture was 10uM. The mixture was then incubated at 95 °C for 2 minutes followed by slow cooling to room temperature to complete the annealing reaction in just under two hours. The annealed RNAs were diluted to 10nM single molecule stock concentration and stored at -20°C.
Whi3-RNA FRET experiment
Whi3 proteins were prepared as described above. Then, 0.5 to 5uM of Whi3 or whi3-Y610-F653A proteins in droplet buffer was added to immobilized RNA substrates, and 10-20 short movies (10 seconds) and 3-4 long movies (2 minutes) were then taken to monitor the Cy3 and Cy5 emission intensities over time. These are then analyzed to produce the FRET histograms and trajectories shown in Figure 2.4D.
Figure 2.S1 Whi3, a polyQ-containing protein, forms LLPS droplets in vitro. A. Cartoon schematic of Whi3 protein sequence, in A. gossypii, depicting the disordered (polyQ, blue) and RNA binding domains (RRM, red). B.
Whi3-BNI1 droplets (green) incorporate more Whi3 protein over time in vitro compared to Whi3-CLN3 droplets
Figure 2.S2 CLN3 and BNI1 co-assemble when regions of complementarity between the two RNAs are
exposed through melting. A. Fluorescence microscopy images and recruitment coefficients show CLN3 mRNA
(5 nM, pink) is modestly recruited into preformed Whi3 droplets made with melted BNI1 (8 µM Whi3, 5 nM BNI1, green) unless complement regions of CLN3 are also exposed through melting (CLN3 ml). In contrast, recruitment of CLN3ml is lost when the mRNA is mixed with oligos targeting the sequence on CLN3 with complementarity to
BNI1 mRNA (CLN3 ml + oligos). Outliers are indicated with (•) marks. *, p < 0.05; **, p < 0.01; ***, p < 0.001
(unpaired t test). n≥500 droplets for N≥3 biological replicates. B. Fluorescence microscopy images and quantification (Pearson’s correlation coefficient) show CLN3 (10 nM, pink) RNA only droplets colocalize with
Figure 2.S3 CLN3 mRNA secondary structure is altered when the mRNA sequence isscrambled or refolded. A. SHAPE reactivity profiles for CLN3 and CLN3 refolded. High values indicate unstructured regions or many possible structures, while low values suggest a single well-defined structure. Data are mean ± SD B.
SHAPE reactivity profiles for cln3 scr indicates it has a completely different secondary structure than CLN3
native sequence. Data are mean ± SD. C. SHAPE reactivity and Shannon entropy values for the first 400 nucleotides of the RNAsshown as the median reactivity smoothed over a 19-nt sliding window relative to the globalmedian. Reactivity values for CLN3 in this region are significantly lower than reactivity values for CLN3
refolded (median of 0.19 vs 0.32 respectively; Wilcoxon rank sum test, p = 0.001), suggesting that the CLN3
Figure 2.S6Regions of complementarity between BNI1 and SPA2. A. Cartoon schematic of BNI1 and SPA2
Figure 2.S7 Disruption of regions of complementarity interferes with coassembly between two RNAs. A.
Fluorescence microscopy images and quantification show SPA2 mRNA incubated with oligos to target the complement nucleotide regions of BNI1 (5 nM, pink) is less recruited into preformed Whi3-BNI1 droplets (8 µM Whi3, 5 nM BNI1, green) compared to native SPA2 alone. The line at the center of the box indicates the median value, and boxes indicate interquartile range. Whiskers contain data points within 3 times the interquartile range, and outliers are indicated with (•) marks. *, p < 0.05 (unpaired t test). Scale bar is 10 µm. n≥500 droplets for N≥ 3 biological
replicates. B. Fluorescence microscopy images and quantification (Pearson’s correlation coefficient) showing SPA2
Figure 2.S8 Whi3 binding sites are located in highly structured region along BNI1 mRNA. A.
Figure 2.S9 The majority of Whi3 binding sites are located in highly structured region along SPA2
mRNA. A. Cartoon schematic of SPA2 RNA depicting the location of the eleven Whi3 binding sites
Figure 2.S10 Whi3 binding is essential to induce dynamic fluctuations to its target mRNAs, CLN3
and BNI1. A. Shape reactivity profiles for CLN3 and CLN3 in the presence of Whi3 protein. High values indicate unstructured regions and many possible structures, while low values suggest a single well-defined structure. The four Whi3 binding sites (WBS) are shaded in purple and show the differences in SHAPE reactivity along CLN3 in the presence or absence of Whi3. Data are mean ± SD. B. FRET histograms show RNA only (gray) or addition of Whi3 (green) or a Whi3 RNA binding mutant (whi3-Y610-F653A, orange).
Acknowledgments
We thank the Gladfelter, Weeks, and Laederach labs for critical discussions, Drs Griffin, Moseley, Lew, Peifer, and Higgs for critically reading the manuscript, the HHMI HCIA at the Marine Biological Laboratory for intellectual community, and Timothy Straub for useful data analysis discussions. This work was supported by NIH GM R01-GM081506, the HHMI Faculty Scholars program, R35 GM122532, ACS 130845-RSG-17-114-01-RMC, NIH 1DP2 GM105453, and NIH R01 GM115631.
All work presented in this chapter was performed and analyzed by Erin M. Langdon with the exception of:
• Single molecule FRET experiments were performed and analyzed by Yupeng Qiu
and Amirhossein Ghanbari Niaki
• cln3 smAshbya strain was created by John M. Crutchley • cln3 codonAshbya strain was created by Jean A. Smith
• Halo strains were imaged and analyzed by Grace A. McLaughlin and
Whi3-tomato images were provided by Therese M. Gerbich and analyzed by Grace A. McLaughlin
Authorship
Erin M. Langdon1, Yupeng Qiu4, Amirhossein Ghanbari Niaki4, Grace A. McLaughlin1, Chase
Weidmann2, Therese M. Gerbich1, Jean A. Smith1, John M. Crutchley1, Christina M. Termini5,
Kevin M. Weeks2, Sua Myong4, and Amy S. Gladfelter1,3*
1Department of Biology, 2Department of Chemistry, University of North Carolina, Chapel Hill, NC
3Marine Biological Laboratory, Woods Hole, MA 02543
4Department of Biophysics, Johns Hopkins University, Baltimore, MD 21218
5Division of Hematology/Oncology, Department of Medicine, University of California,
CHAPTER 3:POLY-Q DEPENDENT PHASE SEPARATIONS DRIVE SPATIAL HETEROGENEITY IN CYTOPLASMIC CROWDING
Introduction
To maintain proper function and survive in any given environment, cells must somehow organize their cytoplasm. This is especially complex in syncytial cells, where difficulties include cell size, cell shape, and diverse functions coexisting within each individual cell. Syncytial cells must coordinate growth and nutrient use over large volumes, as well as regulate gene expression across their many genomes in their individual nuclei (Gladfelter et al., 2006; Roper et al., 2011). Thus, cells likely employ sophisticated mechanisms of cytosolic organization to coordinate their various cellular functions. Further, the large, multinucleate growth strategy of syncytial cells makes them more sensitive to defects in these complex processes. Syncytial cells are relevant across a wide range of biological contexts, from crop science to human health–infectious diseases, tumors, placenta function, and muscle development, thus understanding their biology would have a wide range of implications.
RNA and proteins molecules (Banani et al., 2017; Shin and Brangwynne, 2017). These biological condensates are increasingly observed in diverse fields including cell division, morphogenesis & development, chromatin compaction, signaling networks, and, overwhelmingly, neurodegenerative disease (Banjade and Rosen, 2014; Brangwynne et al., 2009; Lee et al., 2013; Patel et al., 2015; Rog et al., 2017; Strom et al., 2017). Macromolecular crowding has been shown to play a role in driving and modulating phase separation in vitro (Woodruff et al., 2017); however, the physiological events that regulate crowding within the cell and what effects crowding has on phase separation in vivo have remained unclear.
has an impact on cytosolic crowding within the cell and local crowding and we propose that phase separation of RNAs and proteins act synergistically to regulate droplet position and cytosolic heterogeneity.
Results
We noticed that WHI3 transcripts have five predicted Whi3 binding sites (Figure 3.1A), suggesting that like other RNA-binding proteins, Whi3 may be able to bind and regulate its own transcript. Indeed, the WHI3 RNA drives Whi3 protein condensation in vitro (Figure 3.1B) at
physiological salt and protein concentrations, as has been shown for other RNA targets of Whi3. A mutant form of the WHI3 mRNA, whi3-5m, that lacks these binding sites does not promote Whi3 protein to phase separate (Figure 3.1C) indicating that Whi3-WHI3 de-mixing is mediated by specific protein-RNA interactions. Thus, Whi3 phase-separates with its own mRNA raising the possibility that this is relevant for Whi3 function in cells.
employed on these data to determine if the transcripts are quantitatively more enriched near nuclei compared to a randomization of mRNAs throughout the cell (Dundon et al., 2016).
We next asked if there are phenotypic consequences of Whi3 not being able to bind and position its own transcript. When cells express whi3-5m as the sole copy of Whi3, the nuclear cycle becomes significantly more synchronous and cell polarity is altered (Figure 3.1G, unpublished data from Therese M. Gerbich). These are two phenotypes associated with Whi3 loss of function related to mis-regulation of cyclin and polarity transcripts (Lee et al., 2013; 2015). Notably, in the whi3-5m mutant background, the protein is completely wild-type in amino acid sequence yet Ashbya cells expressing this RNA mutant show substantial phenotypic defects. Additionally, while wild-type encoded Whi3 droplets are found concentrated around nuclei and at sites of polarized growth (Langdon et al., 2018; Lee et al., 2013; 2015; Zhang et al., 2015), the
whi3-5m encoded protein formed fewer detectable droplets in both areas of the cell, consistent with
the loss of function phenotype (unpublished data, TMG). Thus, expressing the Whi3 protein from a transcript that is unable to bind to Whi3 protein, leads to the loss of Whi3 protein to undergo phase separation and the mis-regulation of the cell cycle and cell polarity, indicating that this interaction is physiologically relevant.
What is the function of Whi3 condensing with and positioning its own transcripts? We hypothesized that potentially the Whi3-WHI3 condensates may support nucleation/assembly of droplets containing cyclin or polarity-factor mRNAs. If this is a direct effect, we predicted that
suggests that Whi3-WHI3 droplets are somehow indirectly impacting the ability of Whi3 to condense efficiently with other targets.
To assess if Whi3-WHI3 droplets had an effect on promoting Whi3-CLN3 phase separation, we assembled Whi3-CLN3 droplets in the presence of preformed Whi3-WHI3 droplets in vitro.
Interestingly, preformed Whi3-WHI3 droplets drive significantly more Whi3 protein into
Whi3-CLN3 droplets compared to Whi3-CLN3 droplets formed in the presence of preformed
Whi3-CLN3 droplets (Figure 3.2C). This increase in protein uptake is comparable to that seen in
Whi3-CLN3 droplets nucleated in the presence of an external molecular crowder, PEG-8000 (Figure 3.2C). This raises the possibility that Whi3-WHI3 droplets may indirectly facilitate phase separation of Whi3 with other targets such as CLN3 through local crowding.
In support of a role for crowding in Whi3-CLN3 condensation, crowding is required for Whi3 condensation in vitro under conditions that mimic intracellular cytoplasmic streaming (Figure 3.2D), an important physiological factor in many filamentous fungi, including Ashbya. Additionally, when Whi3 phase separation occurs in the presence of flow or an external crowder such as yeast extract (Figure 3.2E), droplets scale to the size seen in Ashbya, suggesting that cytoplasmic flow and crowding are additional features of the cytoplasm that influence the dynamics of Whi3 condensation. Given all of these data together, we hypothesize that Whi3 phase separation that is driven by condensation with its own mRNA, which is highly abundant in the cell, may promote local physical conditions that promote Whi3 condensing with less abundant targets such as cyclins and formin encoding mRNAs.
Figure 3.2 Effects of crowding on Whi3 condensation. A. Two-color smFISH of CLN3 (pink) with
particles, “GEMs” that are ~20 nm or ~40 nm in size, spherical and self-assembling (Delarue et al., 2018). We used the diffusivity of GEMs as a measurement for the state of the cytosol as their motion can inform the “crowdedness” of the local environment relevant to the length-scale of a GEM (Figure 3.3A). To assess how the diffusivity of GEMs is spatially patterned, we implemented a new tracking algorithm that uses convolutional neural networks that employ machine learning methods to accurately measure particle localization from 3D image data. This analysis pipeline called Neural Net Tracker (NNT) allows the extraction of spatiotemporal information of diffusivity in the context of cell architecture (Newby et al., 2018).
Although there is an average global diffusivity of 0.07 µm2/s, we found that diffusion of
the GEMs particles varied widely in time and space in the same hypha, suggesting the existence of heterogeneous crowding throughout the cell (Figure 3.3B). Strikingly, although every cell tracked exhibited this heterogenous diffusivity pattern, we noticed that the majority of cells contained a number of low diffusivity zones that clustered around nuclei and hyphal tips (Figure 3.3C). Interestingly, these zones correlate with the pattern of Whi3 phase separation. Do low diffusivity zones around nuclei and tips arise due to local condensation of Whi3 protein and its target mRNAs into droplets?
It is possible that Whi3 droplets could reduce the volume the GEMs can occupy and diffuse into. Therefore, GEMS diffusion becomes limited to the cytosolic volume outside these exclusionary territories. To test this hypothesis, we expressed GEMs in the whi3∆polyQ mutant. Upon ablation of Whi3 phase separation, the low diffusivity zones homogenized and the diffusivity of the cytosol increased to 0.13 µm2/s (Figure 3.3D,E), suggesting that the diminishment of Whi3
droplets reduces the formation of low diffusivity zones within the cells. Further, the whi3-5m
Figure 3.3 Heterogeneous crowding conditions in Ashbya is influenced by Whi3 condensation. A.
GEMs are expressed in Ashbya and tracking their movement over time can generate a map of the diffusivity of the cytosol. B. Histogram displaying the average diffusivity of Ashbyahyphae (n≈100). C. Area of low diffusivity correlate with position of Whi3 condensation near nuclei and at growing tips in Ashbya. D.
Representative images of diffusivity in wild type (top), whi3-5m mutant (middle), and whi3 ∆polyQ mutant (bottom) Ashbya hyphae. E. Average diffusivities of wild type Whi3 (black), whi3-5m (dark gray), and whi3 ∆polyQ (light gray) indicate that diffusivity is increased in both mutants. F. Quantitative phase microscopy data indicates that the dry mass density of wild type Ashbya is greater than both whi3-5m and whi3∆polyQ
However, this increase in GEMs diffusion is not as dramatic of an increase as whi3∆polyQ, likely due to Whi3 forming droplets with other partners in the wbs-5m mutant, but in whi3∆polyQ, Whi3 condensation is completely reduced.
As Whi3 condensation dynamics appears to correlate with molecular crowding, we hypothesized that it may serve as a global sensor of cell growth–that is, Whi3 may somehow act in detecting and/or regulating the amount and general cellular concentration of cytosolic factors related to growth. To test the hypothesis that Whi3 condensation functions as a cellular sensor of cell growth, we performed quantitative phase microscopy on wild type, whi3-5m, and whi3∆polyQ Ashbya strains in order to quantify and compare the dry mass of the cells. In agreement with this hypothesis, we observed a slight, but statistically significant (Wilcoxon rank-sum tests, p-values < 2x10-16) decrease in the intracellular density in both whi3-5m and whi3∆polyQ compared to wild
type cells (Figure 3.3F), indicating that cells lacking the ability for Whi3 protein to phase separate with either WHI3 or all Whi3 target mRNAs do in fact have slightly less dry mass per given unit volume, in support of the idea that the cell uses Whi3 phase separation as part of its growth regulation.
Discussion
these sites of low diffusivity in Ashbya. But, what is the cellular advantage for Whi3 autoregulating its own condensation?
One potential advantage of Whi3 autoregulation is a mechanism to tune the cytosol to regulate molecular crowding. Thus, Whi3’s ability to phase separate with not only its own mRNA, but also others, could lead to favorable changes in the cytosol to increase molecular crowding and further promote Whi3 phase separation. Previous work has shown that Whi3-CLN3 droplets incorporate significantly less Whi3 protein than other Whi3 targets (Langdon et al., 2018). Interestingly, both WHI3 and CLN3 mRNAs appear enriched around nuclei, so it is possible that Whi3 autoregulation could allow for the precise positioning of Whi3-WHI3 droplets to promote local crowding, especially around nuclei, improving the conditions for low affinity interactions between Whi3 and its other target mRNAs. Further, molecular crowding affects many other cellular functions, including general cell growth. One theoretical study has suggested that there is an optimal cellular concentration of macromolecules that cells actively regulate, balancing the need for both efficient biosynthesis and crowding (van den Berg et al., 2017), and empirical evidence from E. coli supports this hypothesis, where the number of ribosomes during steady-state growth is constant across a range of temperatures (Farewell and Neidhardt, 1998). From our study, we observed a decrease in cellular density upon ablation of Whi3 phase separation, by either whi 3-5m or whi3∆polyQ mutants. Thus, in Ashbya, it appears that one part of this balancing act may be regulated through Whi3 condensation, though it remains to be seen what other mechanisms Ashbya
employs to maintain proper molecular crowding and regulate cellular growth.
transcriptional products are not randomly distributed throughout the cell, but instead localized to specific regions within the cell. This provides a mechanism for establishing cytosolic territories or “neighborhoods”, where local translation can spatiotemporally regulate certain cellular processes. As microscopy-based assays for visualizing translation in live cells have not been fully optimized for fungal cells, it remains to be seen whether Whi3 phase-separated droplets inhibit or enhance the translation of its target transcripts. Previous work in our lab has revealed a strong association between proteins that are involved in translational processes and Whi3 (Changwhan Lee, Nadine S. Anderson, Amy S. Gladfelter, unpublished data), and we have observed translation of Cln3 protein within Whi3 droplets in vitro (Figure 3.4). Additionally, ribosome positioning in Ashbya
appears to be clustered at hyphal tips, further supporting the possibility of the cell employing local translation of certain proteins (Michael Khli Thesis, University of Basel, 2007). One can imagine the scenario where the local production of Whi3 protein leads to the formation of more Whi3 droplets with its target mRNAs, increasing local crowding. This increase could, in turn, lead to further Whi3 droplet condensation, and thus more local translation and crowding, creating a positive feedback loop.
For example, previous studies with GEMs revealed that ribosome concentration regulates the diffusion of large particles and controls phase separation in yeast and mammalian cells (Delarue et al., 2018). Further, recent super resolution microscopy studies in Escherichia coli has demonstrated that the cytoplasm has highly variable local concentrations, where macromolecular crowding plays a central role in establishing heterogeneous spatial distribution of mRNA that leads to large variability in protein production (Norred et al., 2018).
Future experimental studies will likely reveal the underlying molecular and biophysical mechanisms driving cytoplasmic organization and homeostasis, in addition to identifying other possible cytoplasmic factors that influence these phenomena (e.g., pH and ATP concentration), that may aid in our further understanding of the molecular and biophysical mechanisms driving these intricate, yet critical cellular processes.
Figure 3.4 In vitro translation of Cln3 protein from Whi3-CLN3 condensates. A. Fluorescent micrographs