UC Berkeley Previously Published Works
Title
Muon flux measurements at the davis campus of the sanford underground research
facility with the MAJORANA DEMONSTRATOR veto system
Permalink
https://escholarship.org/uc/item/6db9f3tm
Journal
Astroparticle Physics, 93
ISSN
0927-6505
Authors
Abgrall, N
Aguayo, E
Avignone, FT
et al.
Publication Date
2017-07-01
DOI
10.1016/j.astropartphys.2017.01.013
Peer reviewed
eScholarship.org
Powered by the California Digital Library
ContentslistsavailableatScienceDirect
Astroparticle
Physics
journalhomepage:www.elsevier.com/locate/astropartphys
Muon
flux
measurements
at
the
davis
campus
of
the
sanford
underground
research
facility
with
the
majorana
demonstrator
veto
system
N.
Abgrall
a,
E.
Aguayo
b,
F.T.
Avignone
III
c,d,
A.S.
Barabash
e,
F.E.
Bertrand
d,
A.W.
Bradley
a,
V.
Brudanin
f,
M.
Busch
g,h,
M.
Buuck
i,
D.
Byram
j,
A.S.
Caldwell
k,
Y-D.
Chan
a,
C.D.
Christofferson
k,
P.-H.
Chu
l,
C.
Cuesta
i,
J.A.
Detwiler
i,
C.
Dunagan
k,
Yu.
Efremenko
m,∗,
H.
Ejiri
n,
S.R.
Elliott
l,
A.
Galindo-Uribarri
d,
T.
Gilliss
o,h,
G.K.
Giovanetti
o,h,
J.
Goett
l,
M.P.
Green
p,d,h,
J.
Gruszko
i,
I.S.
Guinn
i,
V.E.
Guiseppe
c,
R.
Henning
o,h,
E.W.
Hoppe
b,
S.
Howard
k,
M.A.
Howe
o,h,
B.R.
Jasinski
j,
K.J.
Keeter
q,
M.F.
Kidd
r,
S.I.
Konovalov
e,
R.T.
Kouzes
b,
B.D.
LaFerriere
b,
J.
Leon
i,
A.M.
Lopez
m,
J.
MacMullin
o,h,
R.D.
Martin
j,u,
R.
Massarczyk
l,
S.J.
Meijer
o,h,
S.
Mertens
a,
J.L.
Orrell
b,
C.
O’Shaughnessy
o,h,
N.R.
Overman
b,
A.W.P.
Poon
a,
D.C.
Radford
d,
J.
Rager
o,h,
K.
Rielage
l,
R.G.H.
Robertson
i,
E.
Romero-Romero
m,d,
M.C.
Ronquest
l,
C.
Schmitt
a,
B.
Shanks
o,h,
M.
Shirchenko
f,
N.
Snyder
j,
A.M.
Suriano
k,
D.
Tedeschi
c,
J.E.
Trimble
o,h,
R.L.
Varner
d,
S.
Vasilyev
f,
K.
Vetter
a,s,
K.
Vorren
o,h,
B.R.
White
d,
J.F.
Wilkerson
o,h,d,
C.
Wiseman
c,
W.
Xu
l,t,
E.
Yakushev
f,
C.-H.
Yu
d,
V.
Yumatov
e,
I.
Zhitnikov
f,
(The
Majorana
Collaboration)
aNuclearScienceDivision,LawrenceBerkeleyNationalLaboratory,Berkeley,CA,USA bPacificNorthwestNationalLaboratory,Richland,WA,USA
cDepartmentofPhysicsandAstronomy,UniversityofSouthCarolina,Columbia,SC,USA dOakRidgeNationalLaboratory,OakRidge,TN,USA
eNationalResearchCenter“KurchatovInstitute” InstituteforTheoreticalandExperimentalPhysics,Moscow,Russia fJointInstituteforNuclearResearch,Dubna,Russia
gDepartmentofPhysics,DukeUniversity,Durham,NC,USA hTriangleUniversitiesNuclearLaboratory,Durham,NC,USA
iCenterforExperimentalNuclearPhysicsandAstrophysics,andDepartmentofPhysics,UniversityofWashington,Seattle,WA,USA jDepartmentofPhysics,UniversityofSouthDakota,Vermillion,SD,USA
kSouthDakotaSchoolofMinesandTechnology,RapidCity,SD,USA lLosAlamosNationalLaboratory,LosAlamos,NM,USA
mDepartmentofPhysicsandAstronomy,UniversityofTennessee,Knoxville,TN,USA
nResearchCenterforNuclearPhysicsandDepartmentofPhysics,OsakaUniversity,Ibaraki,Osaka,Japan oDepartmentofPhysicsandAstronomy,UniversityofNorthCarolina,ChapelHill,NC,USA
pDepartmentofPhysics,NorthCarolinaStateUniversity,Raleigh,NC,USA qDepartmentofPhysics,BlackHillsStateUniversity,Spearfish,SD,USA rTennesseeTechUniversity,Cookeville,TN,USA
sDepartmentofNuclearEngineering,UniversityofCalifornia,Berkeley,CA94720,US tDepartmentofPhysics,UniversityofSouthDakota,Vermillion,SD,USA
uDepartmentofPhysics,EngineeringPhysicsandAstronomy,Queen’sUniversity,Kingston,Canada
∗ Correspondingauthor.
E-mailaddress:[email protected](Yu.Efremenko).
http://dx.doi.org/10.1016/j.astropartphys.2017.01.013
a
r
t
i
c
l
e
i
n
f
o
Articlehistory:
Received26February2016 Revised12December2016 Accepted3January2017 Availableonline16February2017
Keywords:
Cosmic Ray Flux
a
b
s
t
r
a
c
t
WereportthefirstmeasurementofthetotalmuonfluxundergroundattheDavisCampusoftheSanford UndergroundResearchFacilityatthe4850 ftlevel.MeasurementswereperformedusingtheMajorana Demonstratormuon vetosystemarrangedintwo differentconfigurations.Themeasuredtotalfluxis
(5.31±0.17)×10−9 μ/s/cm2 .
© 2017ElsevierB.V.Allrightsreserved.
1. Introduction
The DavisCampusattheSanford UndergroundResearch Facil-ity(SURF)[1],locatedintheformerHomestakegoldmine,is sit-uated ata depthof4850 ftnearthecityofLead, SD,USA.SURF hasbecomeaprimesiteforlowbackgroundscienceintheUnited States since theinauguration ofits DavisCampus in 2012. Accu-rate characterization of the muon flux and average rock density is important for understanding cosmic-ray-induced backgrounds not only inexisting experimentspresently deployedat SURF, but also for future projects. A previous measurement of the vertical muon flux at the 4850-ft level has been reported [2], and the total muon flux was measured for the 800- and 2000-ft levels
[3]atSURF.Thetotalmuonfluxatthe4850-ftlevelwascalculated to be
(
4.4±0.1)
×10−9μ
/s/cm2 [4]. In this article,we presenta first measurementofthetotal muonflux atthe4850-ft levelus-ingtheMajoranaDemonstratormuonvetosystem.Wecompare
ourmeasurementtopreviouswork,andtoourownsimulationof muon transportfromthesurfacetotheexperimentusing geolog-ical measurements ofthe average rockdensityofthe SURF over-burden.
TheMajorana Demonstratorisanarray ofenriched and
nat-ural high-purity germanium (HPGe) detectors that are used to searchforthezeroneutrinodouble-beta(
ββ
(0ν
))decayofthe iso-tope76Ge.Thedetailsoftheexperiment’sdesignaregiveninRef.[5]andonlykeyaspectsrequiredforthisresultarediscussedhere. ThespecificgoalsoftheMajoranaDemonstratorareto:
1. Demonstrateapathforwardtoachievingabackgroundrateat orbelow1count/(ROI-t-y)inthe4-keVregionofinterest(ROI) around the 2039-keV Q-value for76Ge
ββ
(0ν
) decay. This is required for tonne-scale germanium-based searches that will probetheinverted-orderingneutrino-massparameterspacefor theeffectiveMajorananeutrinomassinββ
(0ν
)decay. 2. Showtechnicalandengineeringscalabilitytowardatonne-scaleinstrument.
3. Perform searches for additional physics beyond the Standard Model,suchasdarkmatterandaxions.
The Majorana Collaboration has designed a modular
instru-ment composed of two cryostats built from ultra-pure electro-formedcopper,witheachcryostatcapableofhousingover20 kg ofHPGe detectors.The Majorana Demonstratorcontains30 kg
of detectorsfabricated fromGematerial enriched to 88%in 76Ge and another 15 kg fabricated from natural Ge (7.8% 76Ge). The modularapproachallows ustoassemble andoptimizeeach cryo-stat independently,providinga fastdeployment withminimal ef-fectonalready-operationaldetectors.
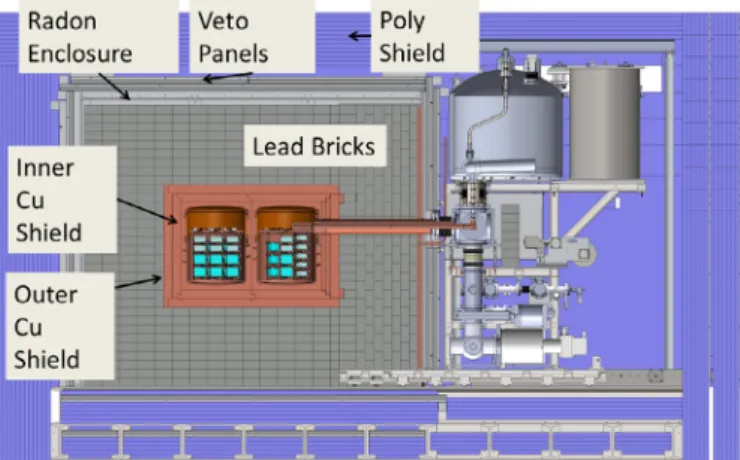
Startingfromtheinnermostcavity,thecryostatsaresurrounded by a compactgraded shield composed ofan inner layer of elec-troformedcopper,alayerofcommerciallysourcedC10100copper, high-purity lead, an active muon veto, borated polyethylene, and
purepolyethyleneshielding.Thecryostats,copper,andlead shield-ingareenclosedinaradonexclusionboxandrestonanover-floor table that has openings for the active muon veto and polyethy-lene shielding panels situatedbelow the detector. The entire ex-perimentislocatedina cleanroomatthe4850 ftlevelofSURF. Ahigh-levelsummaryofshieldcomponentsisshowninFig.1.
Alargefractionoftheplasticscintillatorpanelscomprisingthe activemuon-vetosystemwereoperatedindifferentconfigurations attheexperimentalsiteduringGedetectorconstructionsand com-missioning.Weusedtheresultingdatatomeasurethetotalmuon fluxattheDavisCampusatSURFforthefirsttime.
2. TheMAJORANA DEMONSTRATOR muonvetosystem
TheMajoranaDemonstratormuonvetosystemwasdesigned
to completely enclose the passive copper and lead shield within twolayersofscintillatingpanelswhileminimizinggaps.Eachlayer is composed of 2.54-cm-thick EJ-204B scintillating acrylic sheets encapsulatedwithinAl cladding.Thesedetectorpanelshave vari-ousshapesanddimensionsresultinginatotal areaof ∼ 37 m2.
TheDemonstratorusesatotalof32vetopanels,includingtwelve
thatresidewithinopeningsoftheoverfloortable intwo orthogo-nalorientations.The datapresentedinthispaperisbasedonthe operationoftwoconfigurations,onewith12vetopanelsrequiring two-foldcoincidence,andonewith14vetopanelsrequiring three-foldcoincidence.Thearrangementofthevetopanelsusedforeach configurationisshowninFig.2.Moredetailsoneachconfiguration aregiveninSections3and4below.
Lightfromeachindividualpanelwasreadoutbyasingle 1.27-cm photomultiplier tube (PMT) with wavelength shifting fibers embedded into grooves machined in the scintillator. The panel components were optimized to provide high light output, good lightcollectionuniformity,andexcellentmuon-detectionefficiency
Fig. 2. LayoutsoftheMajoranaDemonstratorvetopanelsusedinthisstudy.Thelayoutontheleftshowsthetwo-foldcoincidencearrangement,andontherightisthe three-foldcoincidencearrangement.Muonselectionrequireahitinatleastonepanelineachlayer.Forthethree-foldcoincidencearrangementmassiveleadshieldingwas presentbetweenthetoplayerandtheupperofthebottomtwolayersasshowninFig.1.Thebottomlayersresidewithinasteelsupportover-floortable,whichisnot shown.AllotherDemonstratorcomponentsarealsosuppressedinthisview.
(
D > 99.9%) [6]. The details of the data acquisition system for
thevetosystemwere giveninRef.[5].Performanceofeachpanel isconstantlymonitoredwithLightEmittingDiodes(LED) embed-dedin the scintillator. Reconstructed LED events were also used tomeasurethelivetime ofthesystem. TheLEDsare pulsedata frequencyknownwithaprecisionof0.1%.
In a deep underground laboratory the muon flux is low, but
γ
rays fromthe experimentalapparatusandthe laboratory envi-ronmentare significant. As described in [6], the useof the rela-tively thin2.54-cm scintillator panels presents certain challenges forseparatingmuonsfromγ
rays andrandomγ
-raycoincidences attheSURFdepth.Themostprobablemuon-energydeposition in theveto panels is∼ 5 MeV, which islow enough that the high energy tail of theγ
-ray energy distribution can potentially en-croachupon themuon peak, potentiallyoverwhelming themuon contributiontothe spectrum.The designandconstruction ofthe vetopanelsachievedgoodlightcollectionandensuredthattheμ
peakremainedwell-separatedfromtheγ
-raytailfortwo-foldor higher-multiplicitycoincidences,evenatthelowmuonfluxofthe DavisCampus.3. Two-foldcoincidencemeasurement
For thefirst configurationwe used thetwelve narrowbottom panelsarrangedinsixpairs.Priortoinstallationintotheirfinal lo-cation,six panels,each with dimensionsof 32 × 182 cm2, were placedparallelto andontopofan additionalsixpanelswith di-mensions32×223cm2.Weselectedeventswherebothatopand bottom panel simultaneously generated a signal above 1.8 MeV. Inthistwo-foldcoincidenceconfiguration,thelivetimeis1536h (5.53 × 10⁶ s) betweenDecember 19, 2013 andMarch 11, 2014. Thesumofenergydepositsinthetwo panelsisshowninFig.3. Fromthefigure, onecan seethatthe tailfromthe
γ
rays makes itdifficulttopreciselymeasurethemuonfluxfromthis configura-tion.Data werefit bycombinationof anexponential tail approx-imatingtheγ
background(blue line), anda Landaudistribution formuons(redline).Thecharacterizationoftheγ
backgroundtail withan exponential functionis justified throughan independent fittoaccidentaltwo-foldcoincidencesbetweenthebottompanels. Theextractednumberofmuonspassingthrough systemis912 ± 43.We note that becausethe pairs ofpanels were adjacent,this configurationissensitivetothetotalmuonfluxbutnotthemuon angulardistribution.The individual data runswere 8hours andthe spread in the numberofdetectedeventsperrunfollowsPoissonstatistics.Allsix detectorpairshavesimilarmuonratesthatagreewithinstatistical fluctuations.
Sum energy of pairs, MeV
0 5 10 15 20 25 30
Counts / 0.39 MeV
0 10 20 30 40 50 60 70 80 90 100
Fig. 3. Theenergydepositionofselectedeventsforthetwo-foldcoincidence con-figuration(blacksolidhistogram).Thehorizontalscaleisthesummedenergy depo-sitionofthepairedpanels.Thetailfromtheenergydepositionoftheγ rays(blue dashedcurve)isfittedwithanexponentialdistribution.Thesignalfrommuonsis fittedbyaLandaudistribution(reddottedline).Thetotalfitisgivenbythesolid greencurve.Themostprobablesummedenergydepositvalueis10.7± 0.2MeV. (Forinterpretationofthereferencestocolorinthisfigurelegend,thereaderis re-ferredtothewebversionofthisarticle.)
4. Three-foldcoincidencemeasurement
Forthesecondconfigurationweusedthevetopanelsplacedin their planned final arrangement. Inthis configuration, data were selected for three-fold coincidences. Two of these signals came from each of the two layers of twelve panels (arrangedin their final sixby sixorthogonal configurationinthe over-floor,as indi-catedinFig. 2),andthethird signal camefromone oftwo large panelsmountedon thetopoftheexperiment’spassive shielding. A 1.6-mtall lead shield is situated betweenthe top and bottom panels witha small central cavity ofdimensions of (90 × 50 × 60cm3).Thetoppanelsarelocatedsidebysideandtheir dimen-sionsareeach84×211cm2.
un-E, MeV
0 2 4 6 8 10 12
Counts/0.5 MeV
0 10 20 30 40 50
E, MeV
0 2 4 6 8 10 12
Counts/0.5 MeV
0 10 20 30 40 50
Fig. 4. Energydistributionsinthetwolargetoplargepanelsforthesecond con-figurationduringathree-foldcoincidence,showingaclearmuonsignal.Theleft figureshowsdatafromtheupperleftpanelincoincidencewithbottompanelsand ontherightisdatafromtheupperrightpanelincoincidencewithbottompanels. Thesolidlineissimulation,whichhasmuchlargerstatistics.
Fig. 5. Thealtitudeinmofthesurfacedirectlyabovetheundergroundlaboratory, whichislocatedattheoriginoftheplotatanaltitudeof119 m.GeographicNorth isdirectedtowardsthetopofthefigure.Sourceforthisplotisfrom[11].
certainties.The run-to-runeventvariationsagreedwithinPoisson fluctuations.
5. Muonsimulationsandresults
To estimate the total muon flux we must estimate the effec-tive cross-sectional area ofourdetector configurationsrelative to themuonangulardistributionattheDavisCampus.Sincethetwo configurations have qualitatively different response to the muon angulardistribution,thedifferencebetweentheextractedflux val-uesprovides across-check onthesensitivitytothe detailsofthe assumed angulardistribution.To modelthe muon angular distri-butionandtheresponseofeachconfigurationtoit,wesimulated muonspropagatingfromthesurfacethroughtherocktotheDavis Campus, and then through the Majorana Demonstrator
labora-toryandthedetectors.
To understand muon propagation to the experimental site at 4850 ftbelowthesurfaceweperformeddetailedsimulationswith Geant4[7,8],version 4.96p04,usingtheQGSP_BIC_HPphysicslist withmuon-nuclearprocessesturnedon.Asurfacemapofthearea, 10 kminradius,surroundingthelaboratorywasimplementedin Geant4withagranularityof77x100 m,seeFig.5.Thislarge sim-ulated area allows entry angles between 0 and 78 degrees rela-tive tothe verticalaxisformuonsentering theunderground lab-oratory.Muonswithenergies between5 GeVand500TeVusing parametrizationfrom[9]weregeneratedrandomlyona100 km2 plane atan altitudeof 2500 m usingthe surfacemuon flux
en-ergyandangulardistributionfromRef.[10],andtheirpropagation throughtherockwasrecorded.
For the detector response component of the simulations we used both the GEANT3 package [12] in addition to Geant4 to check for consistency. We used energy andangular distributions ofmuonsenteringourlaboratoryfromthemuonpropagation sim-ulations inorderto determinethe effectivearea (A eff) formuons detectedinbothcoincidenceconfigurations.Wegenerated271,000 muonsoveranareaof10×10m2,whichismuchlargerthanthat ofthevetoarray.Thissurfaceatwhichthemuon pathswere ini-tiatedwassituated1 mabove therockceilingofthe laboratory, 2mabove theupperpanels.Thesemuonswere thenpropagated throughthe laboratory,andeventsin whichmorethan 1MeV is depositedin a panel by eitherthe muon orits secondarieswere recorded.AlldetailsoftheDemonstratorshieldingwereincluded
inthesimulationmodel.
For the two-fold-coincidence configuration simulation, 8779 muonswererecorded,resultinginaneffectivearea(A eff)of3.24 × 104 cm2. For the three-fold-coincidenceconfiguration simulation, 2876muonsweredetectedresultingin A eff =1.15×104 cm2.
Themuonflux(F )(Eq.(1))iscalculatedusing A eff,thenumber ofmuonsobserved(N obs),andthelivetimeT ofeachconfiguration.
The statisticaluncertainties are large enough that the systematic uncertaintiesarenegligible.
F = Nobs
Aeff
T
(1)
The coincidence detectrion efficiency
is taken to be > 99.7% basedonthesingle-panelefficiency(
D)measured in[6].Forthe
first configuration with two-fold coincidence, the reconstructed flux was found to be
(
5.09±0.24)
×10−9μ
/s/cm2. Forthe sec-ond configuration with three-fold coincidence, the reconstructed muonfluxwasfoundtobe(
5.54±0.23)
×10−9μ
/s/cm2.Although there were fewer muons registered for the second configuration, thestatisticalaccuracy issimilar tothe firstconfiguration dueto theabsenceoftherandomcoincidencebackgroundfromγ
rays.It shouldalsobe notedthatdatawere takenwiththe first configu-rationwhen themuon flux wasnearits annualminimum, while thesecond configurationdata were taken nearthe annual maxi-mumflux.The4-5%levelannualvariationofthemuon fluxison thesameorderasourpresentstatisticalsensitivity,andwillbethe subjectoffuturestudy.Combiningresultsfrombothmeasurementsgivesatotalmuon fluxof
(
5.31±0.17)
×10−9μ
/s/cm2,takento be anaverage over theseasonalvariation.Thesetworesultsderivefromtwovery dif-ferentgeometriesandangularacceptances.Withagreementbetter thanonesigma,weconcludethatthestatisticaluncertainty domi-nates.1
2
3
4
5
6
0
20
40
60
80
100
120
Bottom parallel + Top left (data) Top left (MC) Top right (data) Top right (MC)
Number
of
events
Panel number
Fig. 6. Eventrateforthecoincidencebetweenthebottom6panelsandtheupper2 panelsforthethree-foldcoincidenceconfiguration.Thesimulationpredictionsare shownaslinesanddataaredisplayedwithstatisticalerrorbars.
6. Discussion
Our measured total flux is somewhat larger than the calcula-tioninRef.[4],althoughthetwoagreeatthe2-
σ
level.Reference[4]approximatedtheSURFoverburdenwithaflatsurfaceprofile. An early measurement [2] of the vertical muon flux resulted in a value of
(
4.91±0.06)
×10−9μ
/s/cm2/sr.This measurement employed large water Cherenkovtanks (200 × 200 × 120 cm3) stackedin3 layers.Events consistingofcoincidentsignalswithin 3tanksina vertical-pathtrajectory corresponding toan effective zenith angle < 18 degrees were selected for analysis. To com-pare our estimate for the total muon flux and that of Ref. [2], we integrate our total flux within an 18-degree cone. We calcu-lateaverticalmuonfluxof(
4.42±0.15stat.)
×10−9μ
/s/cm2/sr us-ing our own muon model where the stated uncertainty is only thestatisticaluncertaintyfromourtotalflux measurement. How-ever, the vertical flux extracted from other muon models based on our measured total flux predict different values of(
4.16± 0.12stat.)
×10−9μ
/s/cm2/sr usingRef. [13]and(
5.05±0.16stat.
)
× 10−9μ
/s/cm2/sr using a muon angular distribution [14] derived from the MUSIC package [15]. The spread in the extracted ver-ticalfluxes is a result of differences in the angular distributions nearsmall zenith angle and is indicative of a systematic uncer-taintyintheoverburdenmodelandinthesimulations.Takingthe standard deviationof the three asan estimate of the systematic uncertainty, we calculate the vertical flux to be(
4.4±0.7syst.)
× 10−9μ
/s/cm2/sr.Thetotalmuonflux,ontheotherhand,is insen-sitive to the choice of angular distribution model – the system-aticuncertaintyinthetotalfluxextractedusingthethreedifferent angulardistributions isnegligiblerelative tothe statistical uncer-tainty.We wouldliketo note twothings, however,incomparing our extractedverticalfluxrelativetotheverticalfluxmeasurementof Ref.[2].First,thequoteduncertaintiesinRef.[2]areentirely statis-ticalandnosystematicuncertaintywasestimated.Wewereunable toobtainfromtheauthorsadditionaldetailsabouttheRef.[2] ge-ometryand thresholds inorder to simulatetheir apparatus with thedifferent muon flux angularprofiles. Second, while the mea-surementof[2]wasperformedatthesameundergroundlevel,the separate location ofthe two experiments beneaththe sharp sur-faceprofileresultsinslightlydifferentoverburdensandazimuthal muonfluxdistributions.Nonetheless, whenincludingthe system-aticuncertaintyinthemuonmodelsduetodifferingrockdensity andangulardistribution,ourcalculatedverticalmuonfluxis con-sistentwithRef.[2].
Tostudythe effectofrockdensityfurther,thetotal simulated muonfluxattheDavisCampuswasevaluatedoverarangeofrock
Fig. 7. Thepredictedmuonfluxat4850 ftbasedontheGeant4simulation de-scribedinthetextforseveralvaluesoftheaveragerockdensity.Thedashed(red) curveisanexponentialfittothosesimulateddatapoints.Thetotalsimulation un-certaintiesareindicatedbytheerrorbarsandarecorrelatedbetweenneighboring points.Thehorizontal(gray)shadedregionrepresentsourmeasurementconfidence intervalwiththecentralvalueindicatedbytheblackline.Thevertical(green)band showsrockdensityrangefromgeologicalstudies.(Forinterpretationofthe refer-encestocolorinthisfigurelegend,thereaderisreferredtothewebversionofthis article.)
densities. The simulatedflux has to be normalized to the muon fluxatthe surface,so experimentaldatais usedtoderive a scal-ing factor. A surface muon flux [10] of 2.0±0.2
μ
/s/cm2 is used asreference.Theuncertaintiesinthisvaluetake intoaccountthe uncertainty in altitude as well as possible seasonal variations of theatmospherictemperatureresultingina variationofthemuon flux[16,17].Thedependanceofrockdensityonthetotalflux can beseeninFig.7.Wefindthatarockdensityof2.89±0.06g/cm3 yieldsatotalmuonfluxconsistentwithourmeasurement.This re-sultagreesverywellwithgeologicalstudiesatSURFthatfoundan averagerockdensityof2.86±0.11 g/cm3[18](takingthenominal 4%uncertainty)basedoncone45degreesfromvertical.7. Conclusion
We report for the first time a measurement of the total flux of muons at the SURF Davis Campus. This flux is necessary for presentandfutureexperimentstoassesscosmic-rayinduced back-groundsat thisunderground location.A measured total flux per-mits such an assessment with less interpretation than would be requiredto incorporate effectsof therock density,surface topol-ogy,andmuonangulardistribution. Previousmeasurementswere done at the800 and 2000 ftlevels [3]. The measured flux was foundtobeingoodagreementwiththatpredictedin[4]andwith our ownsimulations using a rockdensitysimilar to values mea-sured in geological studies. A comparison of our result with an oldermeasurement oftheverticalflux [2]isconsistent when in-cludingasystematicuncertaintyonthemuonangulardistribution neededtoconvertourtotalfluxintoaverticalflux.TheMajorana
Demonstratorvetosystemisoperatingintheunderground
envi-ronmentandidentifiesmuonsasexpected.
Acknowledgments
ThismaterialisbaseduponworksupportedbytheU.S. Depart-ment ofEnergy,OfficeofScience,Office ofNuclearPhysicsunder Award Numbers DE-AC02-05CH11231, DE-AC52-06NA25396, DE-FG02-97ER41041, DE-FG02-97ER41033, DE-FG02-97ER41042, DE-SC0012612, DE-FG02-10ER41715, DE-SC0010254, and DE-FG02-97ER41020. We acknowledge support from the Particle Astro-physics Program and Nuclear Physics Program of the National Science Foundation through grant numbers PHY-0919270, PHY-1003940, 0855314,PHY-1202950, MRI 0923142and 1003399.We acknowledge support from the Russian Foundationfor Basic Re-search,grantNo.15-02-02919.Weacknowledgethesupportofthe U.S. Department of Energy through the LANL/LDRD Program. We thank our hosts and colleagues at the Sanford Underground Re-searchFacilityfortheirsupport.
References
[1] J.Heise,The sanfordundergroundresearchfacility athomestake, AIPConf. Proc.1604(2014)331.(PreprintarXiv:1401.0861).
[2] M.L.Cherry,etal.,Phys.Rev.D27(1983)1444.
[3] F.E.Gray,C.Ruybal,J.Totushek,D.-M.Mei,K.Thomas,C.Zhang, Nucl.Instrum. Meth.A638(2011)63.(PreprintarXiv:1007.1921).
[4] D.-M.Mei,A.Hime,Muon-inducedbackgroundstudyforunderground labora-tories,Phys.Rev.D73(2006)053004.(Preprintastro-ph/0512125).
[5]N. Abgrall, et al., The majorana demonstrator neutrinoless double-beta decay experiment, Adv. High Energy Phys. 2014 (2014) 365432. (Preprint arXiv:1308.1633).
[6]W.Bugg,Yu.Efremenko,S.Vasilyev,Largeplasticscintillatorpanelswithwls fiberreadout;optimizationofcomponents,Nucl.Instrum.Meth.A758(2014) 91.(Preprint arXiv:1312.0997).
[7]J.Allison,etal.,Geant4developmentsandapplications,IEEETrans.Nucl.Sci. 53(2006)270.
[8]S.Agostinelli,etal.,Geant4:asimulationtoolkit,Nucl.Instrum.andMeth.A 506(3)(2003)250.
[9]M.Guan,M.-C.Chu,J.Cao,K.-B.Luk,C.Yang(2015).(PreprintarXiv:1509.06176 [hep-ex]).
[10]P.Hansen,P.Carlson,E.Mocchiutti,S.J.Sciutto,M.Boezio,Fluxofatmospheric muons:comparisonbetweenairessimulationsandcaprice98data,Phys.Rev. D68(2003)103001.
[11]URLhttp://www2.jpl.nasa.gov/srtm/.
[12]R.Brun,etal.,1978,(CERN-DD-78-2).URLhttps://cds.cern.ch/record/118715. [13]C. Zhang,(privatecommunication,).Evaluating NeutronBackgrounds inDark
MatterSearches,draft10,(accessedApril28,2015).URLhttp://tinyurl.com/ hzhg4dm.
[14]V.A.Kudryavtsev,2016,(privatecommunication).
[15]V.A. Kudryavtsev, Muon simulation codes music and musun for under-ground physics, Comput. Phys. Commun. 180 (2008) 339–356. (Preprint arXiv:0810.4635[physics.comp-ph]).
[16]A.N.Dmitrieva,R.P.Kokoulin,A.A.Petrukhin,D.A.Timashkov, Correctionsfor temperatureeffectforground-basedmuonhodoscopes,Astropart.Phys.34(6) (2011)401.
[17]G.Bellini,etal.,JCAP08(2013)049.