ESSAYS ON CLIMATE CHANGE MITIGATION, BUILDING ENERGY EFFICIENCY, AND URBAN FORM
Chaosu Li
A dissertation submitted to the faculty at the University of North Carolina at Chapel Hill in partial fulfillment of the requirements for the degree of Doctor of Philosophy in the Department of City and
Regional Planning in the College of Arts and Sciences.
Chapel Hill 2018
ABSTRACT
Chaosu Li: Essays on climate change mitigation, building energy efficiency, and urban form
(Under the direction of Yan Song)
This dissertation includes three self-contained and interrelated papers on climate
change mitigation, building energy efficiency, and urban form.
Paper 1: Urban form and household electricity consumption: a multilevel study
While urban form affects building energy consumption, the pathways, direction
and magnitude of the effect are disputed in the literature. This paper uses a unique dataset
to examine the effect of urban form on residential electricity consumption in Ningbo,
China. Using survey and utility bill data of 534 households in 46 neighborhoods in the
city, I model the electricity use of households using a multi-level regression model. I find
that neighborhood street configuration and tree shade are important in controlling
residential electricity consumption and, consequently, greenhouse gas emissions. The
results suggest that seasonality and dwelling type condition the effect of neighborhood
densities on electricity consumption. Neighborhood density is associated with household
electricity consumption in summer months, while there is no such association in the
winter months. As neighborhood density increases, households in slab and tower
apartments in dense urban neighborhoods consume more electricity in summer months,
neighborhood density is negatively associated with electricity consumption for
single-family houses, suggesting that the effect of neighborhood density is different for different
types of dwelling units.
Paper 2: Explaining spatial variations in residential energy usage intensity in Chicago: the
role of urban form and geomorphometry
Understanding the spatial pattern of energy consumption within buildings is
essential to urban energy planning and management. In this study, I explore the spatial
complexity of residential energy usage intensity, with a focus on urban form and the
geomorphometry attributes of urban ventilation, solar insolation, and vegetation. I use
building energy use data in Chicago at a Census tract level and merge information from
various datasets including parcel attributes, three-dimensional data geometry, aerial
imagery, and Census. Using spatial regression models, I find that while vegetation has
more local impact on energy intensity, urban porosity and roughness length have
consistent spillover effects on building electricity usage intensity in Chicago.
Additionally, these relationships are seasonally varied: while vegetation, ventilation, and
insolation affect electricity usage in summer, they have no impact on the winter gas
consumption. The results highlight the importance of spatially explicit policies and clear
urban design and form frameworks for reducing urban energy consumption and
mitigating climate change.
Paper 3: Government response to climate change in China: a study of first-generation
In this paper, I provide an overview of the first-generation local and regional
climate change plans in China by scrutinizing planning documents of 16 cities, four
autonomous regions, and 22 provinces. I develop and apply an evaluation protocol to
understand goals, process, and strategies in these plans. The results indicate that
provincial and local plans include numerous policies and strategies, yet some important
types of local policies, such as land use and urban form, are not well identified in the
plans. The results also indicate that current climate change planning in China is
characterized by the “top-down” approach, in which the central governmental incentives
play a vital role in shaping provincial and municipal plans. In addition, most plans have
the following issues: vague definition of what characterizes a low carbon city/region,
deficiency in the quality of GHG inventory and reduction targets, inadequate stakeholder
engagement, and weak horizontal coordination. Finally, I offer recommendations to
ACKNOWLEDGEMENTS
This dissertation would not have been possible without the continuous and
unfaltering support of my advisor, Dr. Yan Song. The critiques and suggestions I
received from dissertation committee members, Dr. Nikhil Kaza, Dr. Catherine Zimmer,
Dr. Bill Lester, and Dr. Danielle Spurlock, have substantially improved my dissertation
and would benefit my future academic career. I am also indebted to my cohorts and
friends at UNC, who kindly offered me their support and encouragement throughout my
PhD journey.
A portion of this dissertation was supported by the World Bank through the
research project entitled Urban Scale Building Energy Efficiency and Renewable Energy
(ID: P130786). I would like to thank Hong Hu, Yihua Lu, and Chenming Wu from the
Ningbo Planning & Design Institute and Dr. Liyan Ren for their help with local data
collection.
Lastly, I would like to express my deepest gratitude to my parents. Without your
TABLE OF CONTENTS
LIST OF FIGURES ... x
LIST OF TABLES ... xi
LIST OF ABBREVIATIONS ... xii
CHAPTER 1: INTRODUCTION ... 1
1.1. Statement of the problem ... 1
1.2. Research questions ... 3
1.2.1. Paper one ... 4
1.2.2. Paper two ... 4
1.2.3. Paper three ... 5
REFERENCES ... 6
CHAPTER 2. URBAN FORM AND HOUSEHOLD ELECTRICITY CONSUMPTION: A MULTILEVEL STUDY ... 8
2.1. Introduction ... 8
2.2. Literature review and research questions ... 10
2.3. Methods ... 13
2.3.1. Description of the survey ... 13
2.3.2. Urban form measures ... 18
2.3.3. Model specification ... 20
2.3.4. Descriptive statistics ... 23
2.4. Results ... 26
2.5. Discussion ... 31
2.6. Conclusions ... 33
REFERENCES ... 35
3.1. Introduction ... 39
3.2. Prior research ... 40
3.3. Data and methods ... 44
3.3.1. EUI data ... 44
3.3.2. Urban form and geomorphometry measures ... 45
3.3.3. Variable coding, descriptive statistics, and spatial patterns ... 47
3.3.4. Model specification ... 54
3.4. Findings ... 56
3.5. Discussion ... 62
3.6. Conclusions ... 65
REFERENCES ... 66
CHAPTER 4. GOVERNMENT RESPONSE TO CLIMATE CHANGE IN CHINA: A STUDY OF FIRST-GENERATION PROVINCIAL AND MUNICIPAL PLANS ... 69
4.1. Introduction ... 69
4.2. A review of climate change planning and plan evaluation research ... 72
4.3. Research approach ... 74
4.3.1. Site selection ... 74
4.3.2. Content analysis ... 75
4.4. Findings ... 79
4.4.1. Plan content and process ... 79
4.4.2. Policy and strategies ... 82
4.5. Discussion: existing issues and challenges ... 90
4.6. Conclusions ... 97
REFERENCES ... 99
CHAPTER 5: CONCLUSION AND FUTURE RESEARCH ... 103
5.1. Summary ... 103
5.2. Policy Implications ... 105
5.3. Limitations and future research ... 108
REFERENCES ... 111
APPENDIX 2: GENERAL DESCRIPTION OF TYPICAL
PROVINCIAL PLANS REVIEWED ...115 APPENDIX 3: GENERAL DESCRIPTION OF
LIST OF FIGURES
Fig. 1 Images of the six communities across Ningbo used in this study,
accessed December 10, 2015. Photograph: Baidu Map. ... 17
Fig. 2 Pictures of the different dwelling types included in this study. ... 19
Fig. 3 Spatial patterns of (a) Average annual electricity usage intensity, (b) Average summer electricity usage intensity, (c) Average winter gas usage intensity, (d) Population density,(e) Building orientation, (f) Annual insolation per building volume, (g) Annual vegetation index (NDVI), (h)
Urban porosity, (i) Urban roughness length by census tract in Chicago ... 52
Fig. 4 Provinces and cities with climate change plans reviewed in this
study ... 75
Fig. 5 Distribution of total number of policies by subcategory in provincial
plans ... 82
Fig. 6 Distribution of total number of policies by subcategory in municipal
plans ... 83
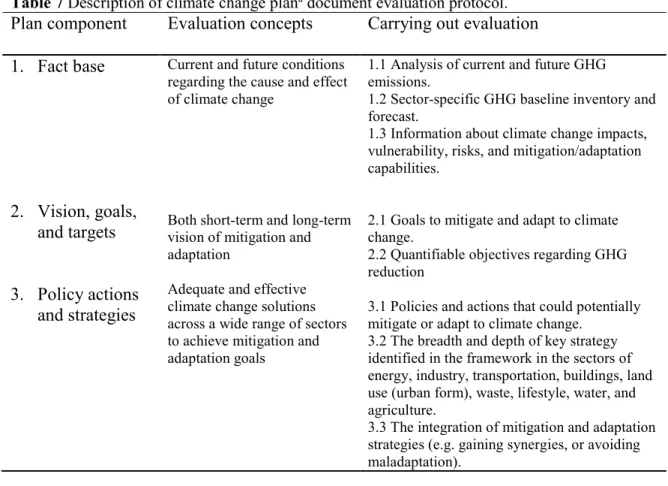
Fig. 7 Framework and breadth of policy actions and strategies (energy,
industry, and transportation) ... 84
Fig. 8 Framework and breadth of policy actions and strategies (building,
carbon sink, land use/urban form, lifestyle/behavior, and waste) ... 85
Fig. 9 Framework and breadth of policy actions and strategies (water and
LIST OF TABLES
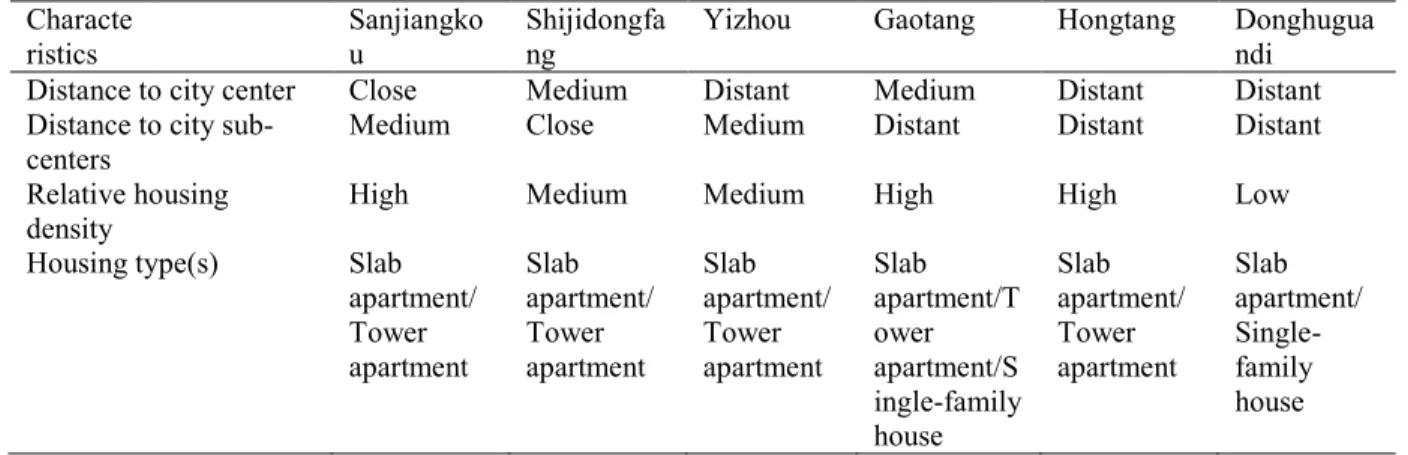
Table 1 Key characteristics of the six communities. ... 17
Table 2 Analysis of intraclass correlation. ... 21
Table 3 Descriptive statistics (N=534). ... 25
Table 4 Annual and seasonal multilevel regression results. ... 27
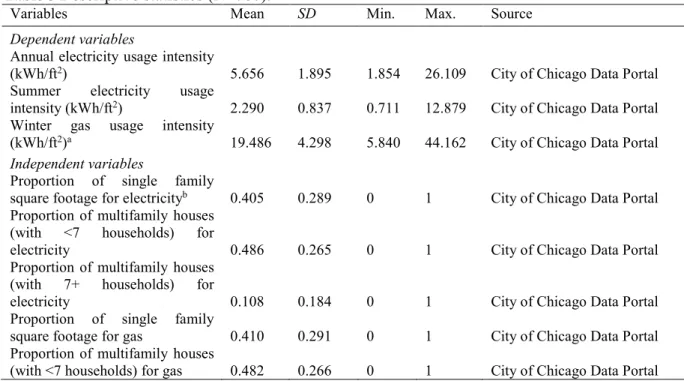
Table 5 Descriptive statistics (N=780). ... 48
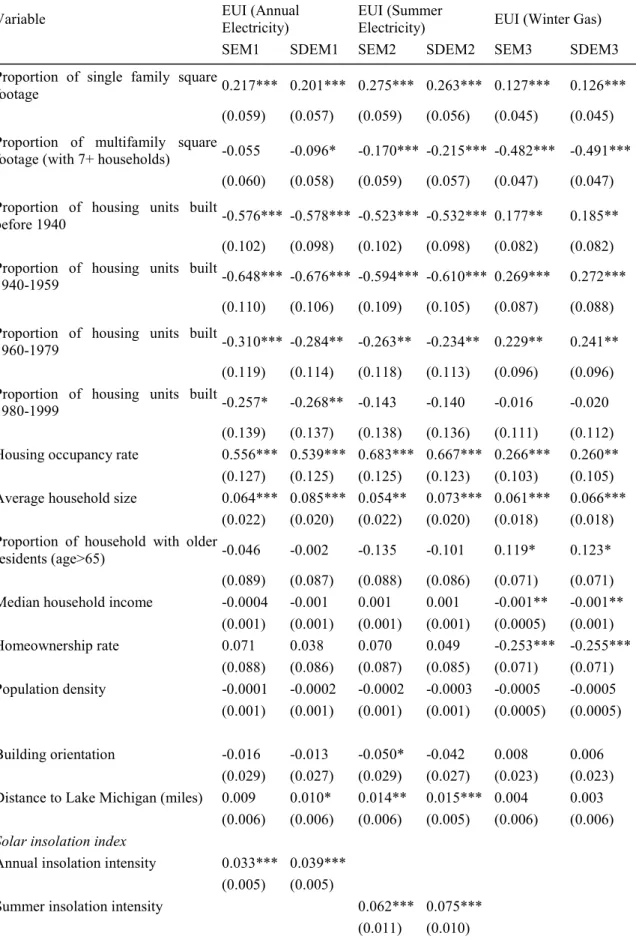
Table 6 Annual and seasonal spatial regression results. ... 57
LIST OF ABBREVIATIONS
DEM Digital Elevation Model
EIA Energy Information Administration
EUI Energy Usage Intensity
GHG Greenhouse Gas
GIS Geographic Information System
ICLEI Local Governments for Sustainability
IPCC Intergovernmental Panel on Climate Change
NDRC National Development and Reform Commission
NDVI Normalized Difference Vegetation Index
OLS Ordinary Least Square
SDEM Spatial Durbin Error Model
SEM Spatial Error Model
U.S. United States
CHAPTER 1: INTRODUCTION
1.1.Statement of the problem
Climate change is considered as one of the most complex challenges in the 21st century,
especially in the field of planning (Donaghy 2007; Wheeler, 2008; Blanco et al. 2009). Urban areas are both significant contributors of greenhouse gas (GHG) emissions and where innovation
and policy action take place (Satterthwaite 2008; Kennedy et al. 2009). Urban energy use significantly contributes to climate change: the Intergovernmental Panel on Climate Change
(IPCC) report shows that urban areas consume between 67% and 76% of global energy and
generate about three quarters of global carbon emissions (IPCC 2013).
Urban form is increasingly being recognized for the potential role in increasing energy
efficiency and mitigating climate change: the most recent IPCC report also identifies urban form
and spatial planning, the 2D and 3D relationships between the physical urban settlements and
land use patterns, as one of the key determinants of a city’s energy consumption, and
consequently, its greenhouse gas (GHG) emissions (Güneralp et al. 2017; IPCC 2013). Additionally, urban form could significantly affects both direct (operational) and indirect
(embodied) energy consumption (Rickwood, Glazebrook, and Searle 2008; Güneralp et al. 2017). Thus, a comprehensive understanding of the relationship between urban form and energy
efficiency should be the key constituent of climate change mitigation. Nevertheless, urban
energy consumption cut across sectors and disciplines, which complicates relative exploration on
It is well established that energy use in buildings is one of the largest energy consuming
sectors and the major sources of greenhouse gas (GHG) emissions from cities, and most of the
emissions are from building operations (Roaf, Norman, MacLean, and Kennedy 2006;
Perez-Lombard, Ortiz and Pout 2008; Swan and Ugursal 2009). In developed countries, energy
consumption in buildings has exceeded other major sectors such as industrial use and
transportation (Pe´rez-Lombard, Ortiz, and Pout 2008). For instance, in the United States, 40
percent of total energy is consumed in residential and commercial buildings (21 percent for
residential and 19 percent for commercial); the building sector has become the largest energy
consumption sector (EIA 2015).
Previous studies on building energy consumption by planning scholars mainly focus on
the effects of occupant behavior, adoption of energy-efficient technologies (e.g., Andrews and
Krogmann 2009), and specific city-level policies on building energy efficiency, such as
benchmarking policy (e.g., Hsu 2014). Analysis of the relationship between energy consumption
in buildings and urban form has not received enough attention until recent years. It is widely
believed that physical urban form affect urban transport energy consumption(Anderson, Pavlos,
and Eric 1996; Banister, Watson, and Wood 1997; Gorman and Dajani 1973; Mindali, Raveh,
and Salomon 2004), and there are numerous studies on the relationship between urban form and
transport energy use(Anderson, Pavlos, and Eric 1996; Banister, Watson, and Wood 1997;
Camagni, Cristina, and Rigamonti 2002; Ewing and Cervero 2001; Gorman and Dajani 1973;
Mindali, Raveh, and Salomon 2004). Nevertheless, there have been relatively limited studies on
the relationship between urban form and operational energy use in buildings. It is important to
evaluate how various urban form elements affect building energy consumption (Ko 2013; Wilson
blurred picture of how urban density and various urban form elements affects building energy
consumption: the pathways, direction and magnitude of the effect are disputed in the literature
(Li, Song, and Kaza 2018).
Meanwhile, cities have been increasingly recognized as major sites for climate change
response (Kousky and Schneider 2003; Betsill and Bulkeley 2007; Dhakal and Betsill 2007;
Donaghy 2007; Ruth and Coelho 2007; Pamlin et al. 2009; While et al. 2010). A growing number of subnational governments have recognized that global climate change has an essential
local and regional dimension. Some international programs, such as the Cities for Climate
Protection (CCP) Campaign that encourages local government emission reductions, are vibrant
examples of this trend (Betsill 2001; Kousky and Schneider 2003; Lindseth 2004; Lutsey 2008;
Wheeler 2008; Anguelovski and Carmin 2011). Although there has been burgeoning literature
offering theory and practical guidance on local climate change mitigation(Bulkeley and Betsill
2005; Bulkeley and Betsill 2013; Bulkeley et al. 2010; Millard-Ball 2013; Kousky and Schneider 2003; Millard-Ball 2012) , scant attention has been paid to evaluating existing plans to shed light
on to what extent policies and strategies has incorporated in to planning documents. In effect, it
is important to evaluate existing climate change plans to advance our understanding of local
climate change planning process and identifying current issues and challenges. In addition, there
is limited empirical understanding of whether urban form and land use policies have been
incorporated into current climate change plans.
1.2.Research questions
This dissertation includes three self-contained and interrelated papers on climate change
been published in the journal Energy and Buildings, examines the effect of neighborhood density on household residential electricity consumption (Li, Song, and Kaza 2018). The second paper
(Chapter 3), which will be submitted to Planning Education and Research, explores the spatial complexity of residential energy (including electricity and natural gas) usage intensity, with a
focus on urban ventilation, solar insolation, and vegetation and the associated spatial spillover
effects. The third paper, a proportion of which has been published in the journal of
Environmental Planning and Management, evaluates the first-generation provincial and
municipal climate change plans in China, and examines which policy categories and key
strategies are prioritized and whether the urban form and land use subcategory is well identified
in the plans (Li and Song 2016). The research questions for each paper are listed as follows:
1.2.1. Paper one
1) Is there a relationship between urban form (especially neighborhood density) and residential
energy consumption after controlling for differences in demographic, socioeconomic, behavioral,
and property-related characteristics at the household level?
2) Are the effects of urban form on residential energy consumption consistent across seasons?
How do these effects differ between the summer and the winter?
3) Does neighborhood density affect residential energy consumption differently for households
located in different dwelling units?
1.2.2. Paper two
1) Do urban ventilation, solar insolation, and vegetation affect residential energy usage intensity?
2) Do urban ventilation and vegetation have spillover effects on residential energy usage
intensity?
1.2.3. Paper three
1) What are the main planning interventions taken by Chinese cities and provinces to respond to
climate change? What are the main issues with the first-generation subnational climate change
plans?
2) Which policy categories and key strategies are prioritized in provincial and municipal climate
REFERENCES
Anderson, W P, S K Pavlos, and J M Eric. 1996. “Urban Form , Energy and the Environm : A Review of Issues , Evidence and Policy.” Urban Studies 33(1): 7–35.
Andrews, C.J. and U. Krogmann. 2009. “Technology diffusion and energy intensity in US commercial buildings.” Energy Policy 37(2): 541–553.
Anguelovski, I., and J. Carmin. 2011. “Something Borrowed, Everything New: Innovation and Institutionalization in Urban Climate Governance.” Current Opinion in Environmental Sustainability 3 (3): 169–175.
Banister, D, S Watson, and C Wood. 1997. “Sustainable Cities: Transport, Energy, and Urban Form.” Environment and Planning B-Planning & Design 24 (1): 125–143.
Blanco, H., M. Alberti, R. Olshansky, S. Chang, S. M. Wheeler, J. Randolph, J. B. London, et al. 2009. “Shaken, Shrinking, Hot, Impoverished and Informal: Emerging Research Agendas in Planning.” Progress in Planning 72 (4): 195–250.
Bulkeley, H., and M. Betsill. 2005. “Rethinking Sustainable Cities: Multilevel Governance and the ‘Urban’ Politics of Climate Change.” Environmental Politics 14 (1): 42–63.
Bulkeley, H., and M. M. Betsill. 2013. “Revisiting the Urban Politics of Climate Change.” Environmental Politics 22 (1): 136–154.
Camagni, R, M. Cristina, and P. Rigamonti. 2002. “Urban Mobility and Urban Form: The Social and Environmental Costs of Different Patterns of Urban Expansion.” Ecological economics 40: 199– 216.
Ewing, R., and R. Cervero. 2001. “Travel and the Built Environment: A Synthesis.” Transportation Research Record 1780: 87–114.
Gorman, G., and J. Dajani. 1973. “Energy, Urban Form and Transportation Policy.” Transportation Research 8 (4–5): 267–276.
Güneralp, B., Y. Zhou, D. Ürge-Vorsatz, M. Gupta, S. Yu, P. L. Patel, M. Fragkias, X. Li, and K. C. Seto. 2017. “Global Scenarios of Urban Density and Its Impacts on Building Energy Use through 2050.” Proceedings of the National Academy of Sciences 114 (34): 8945–8950.
Hsu, D., 2014. “Improving energy benchmarking with self-reported data.” Building Research & Information, 42(5): 641-656.
IPCC. 2013. “IPCC Fifth Assessment Report (AR5).” IPCC, 10-12.
Kennedy, C., J. Steinberger, B. Gasson, Y. Hansen, T. Hillman, M. Havranek, D. Pataki, A. Phdungsilp, A. Ramaswami, and G. V. Mendez. 2009. “Greenhouse Gas Emissions from Global Cities.” Environmental Science & Technology 43 (19): 7297–7302.
Ko, Y, and J. D. Radke. 2014. “The Effect of Urban Form and Residential Cooling Energy Use in Sacramento, California.” Environment and Planning B: Planning and Design 41 (4): 573–593. Kousky, C., and S. H. Schneider. 2003. “Global Climate Policy: Will Cities Lead the Way?” Climate
Policy 3 (4): 359–372.
Lee, S., and B. Lee. 2014. “The Influence of Urban Form on GHG Emissions in the U.S. Household Sector.” Energy Policy 68: 534–549.
Li, C., Y. Song, and N. Kaza. 2018. “Urban Form and Household Electricity Consumption: A Multilevel Study.” Energy and Buildings 158, 181–193.
Li, C., and Y. Song. 2015. “Government Response to Climate Change in China: A Study of Provincial and Municipal Plans.” Journal of Environmental Planning and Management 59(9), 1679–1710. Millard-Ball, A. 2012. “Do City Climate Plans Reduce Emissions?” Journal of Urban Economics 71 (3):
289–311.
Millard-Ball, A. 2013. “The Limits to Planning Causal Impacts of City Climate Action Plans.” Journal of Planning Education and Research 33 (1): 5–19.
Mindali, O., A. Raveh, and I. Salomon. 2004. “Urban Density and Energy Consumption: A New Look at Old Statistics.” Transportation Research Part A: Policy and Practice 38 (2): 143–162.
Rickwood, P., G. Glazebrook, and G. Searle. 2008. “Urban Structure and Energy-a Review.” Urban Policy and Research 26 (1): 57–81.
Satterthwaite, D. 2008. “Cities’ Contribution to Global Warming: Notes on the Allocation of Greenhouse Gas Emissions.” Environment and Urbanization 20 (2): 539–549.
Silva, M., V. Oliveira, and V. Leal. 2017. “Urban Form and Energy Demand.” Journal of Planning Literature. doi:10.1177/0885412217706900.
Wheeler, S. 2008. “State and Municipal Climate Change Plans: The First Generation.” Journal of the American Planning Association 74 (4): 481–496.
CHAPTER 2. URBAN FORM AND HOUSEHOLD ELECTRICITY CONSUMPTION: A MULTILEVEL STUDY
2.1.Introduction
Urban form and land use patterns significantly influence a city’s energy consumption
and, consequently, its GHG emissions. It is widely believed that physical urban form affects
urban transportation energy consumption (Anderson, Pavlos, and Eric 1996; Banister, Watson,
and Wood 1997; Gorman and Dajani 1973; Mindali, Raveh, and Salomon 2004), and there are
numerous studies on the relationship between urban form and transportation energy use
(Anderson, Pavlos, and Eric 1996; Banister, Watson, and Wood 1997; Camagni, Cristina, and
Rigamonti 2002; Ewing and Cervero 2001; Gorman and Dajani 1973; Mindali, Raveh, and
Salomon 2004). Energy use in buildings is one of the major sources of greenhouse gas (GHG)
emissions from cities, and most of these emissions are from building operations (Norman et al. 2006; Perez-Lombard 2008; Swan and Ugursal 2009). However, there have been a relatively
limited number of studies on the relationship between urban form and operational energy use in
buildings. A comprehensive understanding of the relationship between urban form and energy
use is key to formulating climate change mitigation policies at a city level. Therefore, it is
important to evaluate how various elements of urban form affect building energy consumption
(Ko and Radke 2014; Wilson 2013; Ko 2013; Lee and Lee 2014). The pathways, direction and
magnitude of the effects of urban form on building energy consumption are disputed in current
literature (Silva, Oliveira, and Leal 2017). Furthermore, most of these studies are limited to cities
in Europe and the Americas. Few studies to date have assessed the roles of physical development
such as fast-growing megacities in Asia, where urban form policies might play a more important
role in promoting building energy efficiency.
In China, residential sector is the second largest energy-consuming sector after Industry
and consumes about 13% of the total energy consumption1 (National Bureau of Statistics of
China 2015). Together with the unprecedented scope of urbanization in recent decades,
residential energy consumption in China has increased enormously: the growth rate in residential
electricity demand has reached an annual average of 11.9% (National Bureau of Statistics of
China 2015). Since this growth shows no signs of abatement, it is crucial to know how changes
to physical development patterns and modifications to urban built environment can contribute to
lowering residential energy consumption. However, existing studies on residential energy
consumption in China have largely focused on occupants’ socio-economic status and behavior,
price deregulation, policy effectiveness, as well as technical measures to improve energy
efficiency (Chen, Wang, and Steemers 2013; Zheng et al. 2014; Zhao, Li, and Ma 2012; Ouyang
et al. 2011).
The purpose of this paper is to explore the effects of urban form on residential energy
consumption, in the contexts of urban environments in China, so as to shed light on the role of
urban form on residential energy efficiency. I first review current literature debate concerning
urban form and building energy consumption and justify the research questions. I then present
our research design, data collection and analysis methods, including the household survey, urban
form measures, and model specification. I then present the results for the study area in Ningbo
1According to National Bureau of Statistics of China, energy consumption from the transportation sector
city and set these in the context of existing literature. I discuss directions for future research and
conclude with policy implications.
2.2.Literature review and research questions
Urban density, a measure that is central to physical planning, was long considered
important driver for building energy consumption (Silva, Oliveira, and Leal 2017). Early
expositions of this relationship suggested that urban development patterns with higher physical
density are associated with higher urban temperatures and heat island effect (Giridharan,
Ganesan, and Lau 2004; B. Chun and Guldmann 2014), which could in turn increase cooling
loads in buildings (Taha 1997). In recent years, the relationship between urban form and energy
consumption has enjoyed a resurgence of interest (Wilson 2013). However, there has been
disagreement among literature concerning pathways, direction and magnitude of the effects of
urban form (especially urban density) on building energy consumption. Ewing and Rong (2008)
posit three possible pathways through which urban form impacts residential energy consumption:
energy loss through electric transmission and distribution, increased energy demand associated
with the urban heat island effect, and energy consumption variance through size and type of
housing stocks. The complicated stepped analysis and the conclusions of this study are still under
debate, as Randolph (2008) argues that urban form is still an excessively blunt tool without
sufficient empirical evidence and Ewing and Rong fails to consider the dynamic aspects of
markets or consumer behavior in their study. More recently, Lee and Lee (2014) examined the
effects of urban form on households’ carbon dioxide emissions in the 125 largest urban areas in
the United States and found that doubling population-weighted density can reduce residential
energy consumption by 35%; this supports the idea that smart growth polices and compact urban
limitation of this study is that the authors only evaluated macro urban form measures at the
city-level, which leaves out micro-level urban dimensions such as neighborhoods.
Interestingly, Wilson (2013) used a sample of single-family detached homes in Illinois
(United States) to explore how density and other urban form indicators affect residential
electricity consumption. The most notable finding from this study is the negative relationship
between density (dwelling units per acre) at the subdivision level and summer household
electricity consumption, which is consistent with a nuanced argument that low-density residential
development with large lawn areas may contribute radiant heat energy that increases the surface
heat island effect (Stone and Rodgers 2001; Stone and Norman 2006). By using the national
Residential Electricity Consumption Survey (RECS) data in the United States, Kaza (2010) did
not find any impact of self-reported neighborhood density on household energy use; this
contradicts the argument that compact neighborhoods are more energy efficient with regard to
electricity consumption (Wilson 2013). In addition, by using a sample mostly composed of
single-family houses from Sacramento, California (United States), at the land parcel level, Ko
and Radke (2014) did not find that physical density had a significant effect on summer
residential cooling energy consumption, which again contradicts Wilson's results (Wilson 2013).
The authors found that other urban form features such as east–west street orientation, higher
green space density, and larger vegetation on the east, south, and west sides of dwelling units
have significant effects in reducing cooling energy use in summer months.
In addition to the above empirical studies, there are also no consensus in studies that
use simulation methods: By using a digital elevation model of London, Steemers (2003) found
that increasing urban density leads to increased energy consumption in office buildings across
increasing urban density on building heat-energy consumption. Instead, this study found that
heat-energy efficiency of buildings can be achieved through high urban densities or taller
buildings that allow lower densities at the neighborhood scale. Based on six typical
neighborhood types in Shanghai, China, a recent study by Yang and Zhang (2016) indicates that
higher density leads to higher energy performance of buildings in the neighborhoods. Their
simulation results can hardly be confirmed with the actual electricity bill data since quantifying
more complicated interrelationships should consider local socioeconomic context. Interestingly,
by using samples in Portland and Atlanta (United States), Quan and Yang(2014) found that
building energy consumption decreased as the floor area ratio increased until it reached a certain
point, beyond which the energy-urban density relationship reversed.
In summary, both empirical and simulation studies to date provide an unclear picture
of how urban form, especially physical density at the neighborhood-level, affects energy
consumption. One potential factor that leads to the differences between the simulation and
empirical results is that, most simulation studies merely modeled the relationship between
physical density and building energy consumption on an annual basis; the relationship might be
totally different if it is modeled on a seasonal basis. Additionally, most existing empirical studies
on urban density and residential energy consumption were conducted within the geographical
contexts of the United States and Europe, and focus heavily on single-family houses in
low-density urban environments. It is far from clear whether similar patterns will hold true in other
geographical and cultural contexts such as dense residential neighborhoods in Asian mega-cities.
Therefore, our study aims to provide more empirical evidence of how different urban forms,
particularly density at the micro-scale, affect residential energy consumption in a geographical
detailed empirical understanding of how urban form characteristics shape residential energy
consumption for different seasons, and for different types of dwelling units located in different
neighborhoods by answering the following questions:
1) Is there a relationship between urban form (especially neighborhood density) and residential
energy consumption after controlling for differences in demographic, socioeconomic, behavioral,
and property-related characteristics at the household level?
2) Are the effects of urban form on residential energy consumption consistent across seasons?
How do these effects differ between the summer and the winter?
3) Does neighborhood density affect residential energy consumption differently for households
located in different dwelling units?
2.3.Methods
2.3.1. Description of the survey
In order to probe the research questions of this study in detail, I conducted a household survey
in Ningbo, a sub-provincial city located along the eastern coast of China. Ningbo is a typical city
in the Yangtze River Delta Metropolitan Region, which is situated in China’s “hot summer and
cold winter” climate zone. The total population within the built-up area of Ningbo is 2.182
million, with a residential density in the city center of 10,399 people per square kilometer. I
selected Ningbo mainly because its residential urban form is representative of development in
other cities in Yangtze River Delta Metropolitan Region, which is the largest metropolitan area
in China. Additionally, I have got pre-permission from the Ningbo Electric Power Bureau to
access the residents’ utility bills for this study. The typical types of residential building in
Ningbo include slab apartment homes, tower apartment homes, and single-family houses, which
The household survey instrument used in this study (Appendix 1) was developed based on
previous studies (Holden and Norland 2005; Chen, Wang, and Steemers 2013; Wilson 2013), as
well as the U.S. Residential Energy Consumption Survey; these surveys are designed to capture
the important demographic, socioeconomic, behavioral, and property-related explanatory
variables for household electricity consumption. In the survey, I required our participants to
provide us the identification numbers for their electricity meters. Participants agreed to
participate in our survey and let us access their utility bills from the Ningbo Electric Power
Bureau and use this information for our study before our survey started. The survey is composed
of four parts. The first part of the survey was completed by the surveyors and is composed of
basic questions about participants, including addresses, floor levels2, dwelling types, and the
electricity meter identification number of the households. The second part of the survey deals
with building ages, the area of the dwelling units, and households’ estimates of their monthly
utility bills. Information about home heating equipment was also gathered in this section. The
third part of the survey primarily comprised of questions about the demographic and
socio-economic status of the participating households, including the ages of family members and
household incomes. A survey of major household appliances3 was also completed during this
part of the survey and used to calculate the home appliance index4 in the regression model. The
2 Since floor level (e.g., differences between first floor, intermediate floor, and top floor) could be a
potential factor affecting the household’s insulation and its exposure to external temperature (Ferhat and Boutrahi 2014), I included it in our survey and classified each household’s floor level into four categories: first floor, middle floor (floor level 2-8), high floor (floor level >8), and top floor.
3 Following Chen et al. (2013), the term “major household appliances” refers to electricity-intensive
appliances in Chinese homes, including air-conditioners, fridges, washing machines, water heaters, computers, and televisions.
4 I calculated the electricity conservation index for each housing unit based on the information that I
final section of the survey includes seven questions to learn about electricity conservation actions
used within the households as well as other micro-level urban form characteristics, such as
whether their households have tree shade and whether their neighborhoods are adjacent to water
bodies.
Initially, I conducted a priori sample size estimation to determine how many observations
are needed for this study5. By setting a desired statistical power level of 0.95, I calculated the
minimum sample sizes for different effect sizes of 0.05 (small), 0.15 (medium), and 0.35 (large).
Our required sample size ranged from 105 to 634 observations. By referring to previous studies
(Holden and Norland 2005; J. Chen, Wang, and Steemers 2013; Wilson 2013), I targeted 560
households as our desired sample size to ensure a relatively large sample.
5I used the methods recommended by Faul et al. (2009) to conduct the power analysis for multiple
Fig. 1 Images of the six communities across Ningbo used in this study, accessed December 10, 2015. Photograph: Baidu Map.
Our sampling strategies are as follows: First, I selected six different “typical” communities
(Fig.1) across Ningbo in different locations (Table 1). I then used a random drawing to select 560
households within these communities based on addresses gathered from the Ningbo Planning
Institute. The selected households are located in 46 residential neighborhoods6 with various
building stocks, densities, and urban form features. After the samples were selected, I hired a
survey company to do households surveys. I paid the surveying company 120 RMB for each
survey. To ensure survey quality, every surveyor was required to attend a half-day training
lecture. During the training process, one of our questionnaire designers discussed each question
with all surveyors. Each surveyor received intensive training on sampling strategy and interview
skills.
Table 1 Key characteristics of the six communities.
A pilot survey of 20 households was conducted in June 2015 to reveal any possible
misinterpretations of survey questions, ambiguity in response categories, or other issues. The
6 Residential neighborhood in this study refers to “juzhuzutuan”, which is the primary unit in residential
areas in China. It is often maintained by a single property management company and composed of homogenous residential buildings.
Characte ristics Sanjiangko u Shijidongfa ng
Yizhou Gaotang Hongtang Donghugua ndi Distance to city center Close Medium Distant Medium Distant Distant Distance to city
sub-centers Relative housing density Medium High Close Medium Medium Medium Distant High Distant High Distant Low
survey instrument was slightly revised based on the responses from our pilot survey. The formal
survey was conducted during July 2015. After that, monthly electricity data in the most recent
year for each household was collected from the Ningbo Electric Power Bureau. After validity
checks on both the electricity data and the survey results, 534 total observations in 46 different
neighborhoods remained in our final sample.
2.3.2. Urban form measures
Urban form measures in this study are derived both at the housing unit- and
neighborhood-levels. At the housing unit-level, the type of dwelling in which the household is located is
deemed as an important micro-level urban form factor. Numerous previous studies indicate that
dwelling type can have a major effect on household energy consumption, as single-family units
tend to consume more energy than multi-family units (IPART 2011; Kaza 2010; Min,
Hausfather, and Lin 2010).In the context of Chinese cities, primary dwelling types include slab
and tower apartments located in high-density neighborhoods. Thus, in this study, three binary
variables were included to capture if a housing unit is in a single-family house, a slab apartment,
or a tower apartment (Fig.2). Similar to Wilson (2013), our household survey includes a question
Fig. 2 Pictures of the different dwelling types included in this study.
Neighborhood-level urban form measures were primarily calculated from GIS datasets
provided by the Ningbo Planning Bureau. In this study, our metric for measuring neighborhood
density is floor area ratio, which is calculated by dividing the total floor area of all the buildings
within a residential neighborhood by the total area of the residential neighborhood.7 A higher
floor area ratio indicates a denser urban neighborhood. I chose floor area ratio as the indicator to
measure urban density because local governments in China use it as a standard in urban planning
codes to regulate residential development, making this metric policy-relevant. The second
7In this study, I initially envisioned utilizing three neighborhood density measures: floor area ratio,
neighborhood-level urban form measure is street configuration, which has been identified as
another important factor in influencing household energy consumption since the ideal east-west
orientation of a street will result in more south-facing buildings in a neighborhood (Erley and
Jaffe 1979; Robinette 1983; Shishegar 2013; Ko 2013; Ko and Radke 2014). To measure street
configuration, I initially determined the major axis of streets using street network GIS data. I
then calculated the orientation angle for each street in the major axis. If more than 80% of the
streets in the major axis are within five degrees of the ideal east-west orientation, the street
configuration variable for the neighborhood was coded as 1; otherwise, it was coded as 0. The
last neighborhood urban form measure, also coded as a binary variable, indicates whether a
neighborhood is adjacent to natural water bodies (e.g., rivers, lakes). This variable was primarily
derived from the household survey and confirmed with Google Earth images.
2.3.3. Model specification
Multilevel regression was used in this study since it is designated to analyze hierarchically
clustered data. It is also known as a hierarchical linear model or linear mixed model, which deals
with the within-group dependency issues whilst estimating ecological effects (Steenbergen and
Jones 2002; Raudenbush and Bryk 2002; Ballas and Tranmer 2012). Furthermore, the multilevel
specification also models spatial autocorrelation by capturing spatial structure in the data (Orford
2000).
The decision whether to use a hierarchical linear model is based on both statistical and
theoretical criteria. The general statistical guideline for checking the need to use a hierarchical
linear model is based on the calculation of intraclass correlation which, in this case, gives an
neighborhood effects (Steenbergen and Jones 2002; Raudenbush and Bryk 2002; Ballas and
Tranmer 2012). The model to estimate intraclass correlation is as follows:
Household level:
Y
ij=
β
0j+
γ
ijγ
ij~ N(0,
σ2)
Neighborhood level:
β
0j=
γ
00+
η
0jη
0j~ N(0,
τ02)
Where Yij is the natural log of the electricity consumption in the ith household of the jth
neighborhoods, and γij is the household-level residual. γ00 is the overall mean of household
electricity consumption across neighborhood, and
η
0j is the neighborhood-level residual. Thus,τ02 is the measure of variation of household electricity consumption at the neighborhood level,
while σ2 is the measure of variation of household electricity consumption at the neighborhood
level. Further, the intraclass correlation is calculated as the proportion of variation at the
neighborhood level:
ρ
= τ02/(σ2+ τ0
2)Table 2 Analysis of intraclass correlation.
Dependent variable Neighborhoods (N=46)
group variation
variation correlation
Annual electricity usage (logged) 0.1412 0.2564 0.3550 0.0000 Summer electricity usage (logged) 0.1302 0.2441 0.3479 0.0000 Winter electricity usage (logged) 0.1710 0.3706 0.3157 0.0000
According to the results presented in Table 2, the intraclass correlations for annual, summer,
and winter electricity consumption are 35.50%, 34.79%, and 31.57%, respectively; all of these
results are statistically significant. This indicates that a moderate proportion of variance in
electricity usage can be attributed to differences between neighborhoods. Additionally, existing
studies have already identified neighborhood urban form as having a significant impact on
household energy consumption (Wilson 2013; Ko and Radke 2014). Therefore, utilizing a
hierarchical linear regression is an appropriate method to estimate the effects of urban form on
household electricity consumption. After other explanatory variables at both household and
neighborhood levels are added, the model becomes:
Household level:
Y
ij=β
0j+β
1jX
ij+β
2jZ
ij+γ
ijNeighborhood level:
β
0j=γ
00+γ
01Wj +η
0jβ
1j=γ
10+η
1jβ
2j=γ
20+η
2jWhere, Yij is the natural log of the electricity consumption in the ith household of the jth
neighborhood. Xij denotes household-level urban form variables, which includes binary variables
for tower apartments and single-family houses, and whether the household has tree shade. Zij
denotes household-level demographic, socioeconomic, property, and behavioral variables,
apartments/houses, floor levels, ages of apartments/houses, an appliance index, and an electricity
conservation index. Wj are neighborhood-level urban form indicators of the jth neighborhood,
including floor area ratios, street configurations, and adjacencies to water bodies.
In the third stage, our analysis was expanded to include cross-level interactions. Since I
hypothesize that neighborhood density would have different effects for households located in
different types of dwelling units, Denj×Typijwas added into the model to test the hypothesized
interaction between neighborhood density and dwelling type. Here Denj denotes the floor area ratio of the jth neighborhood, while Typijincludes two binary variables which indicate if the ith
household of the jth neighborhood is located in a tower apartment or a single-family house.
Thus, after the cross-level interaction term was added, the model becomes:
Household level:
Y
ij=β
0j+β
1jX
ij+β
2jZ
ij+γ
ijNeighborhood level:
β
0j=γ
00+ γ
01Wj + γ
02Denj×Typij+η
0jβ
1j=γ
10+η
1jβ
2j=γ
20+η
2j2.3.4. Descriptive statistics
Table 3 provides descriptive statistics for the measures used in the multilevel model. Annual
electricity usage refers to annual household electricity usage from October 2014 to September
2015, in the unit of kWh. Summers and winters in Ningbo both last four months, with summer
months including June, July, August, and September, and winter months including December,
household electricity data from June 2015 to September 2015; accordingly, winter electricity
consumption was derived from the electricity data from December 2014 to March 2015. Annual
household electricity usage ranged from 466 kWh to 39,117 kWh, with 2,882.03 kWh as the
mean and 2,717.21kWh as the standard deviation. Not surprisingly, the annual, summer, and
winter usages are all right-skewed, so I transferred them to natural log form. According to the
descriptive statistics, the dominant housing type is slab apartment, which accounts for 74% of
our sample, followed by tower apartments (20%) and single-family houses (6%).
Since residential electricity in Ningbo is solely provided by the Ningbo Electric Power
Bureau with a consistent pricing scheme across neighborhoods, I did not consider energy price as
a factor that causes variations in household electricity consumption. Because electricity price is
not included in our model, it is crucial to include household income in our residential energy
consumption model (Romanos 1978; Wilson 2013); this data is derived from the household
survey8. Additionally, according to our survey results, 98.6% of households use air-conditioners
and (or) electric heaters as their primary home heating equipment(s) during winter, thus
electricity is the primary home heating fuel for the households I surveyed in Ningbo9.
8 The low-, medium-, and high-income categories were derived from 2015 municipal income data from
the Ningbo Bureau of Statistics. The low-income category is defined as monthly per capita income less than 3000 RMB, while the high-income category is defined as monthly per capita income greater than 8000 RMB. Other incomes are included in the medium-income category.
9 China's heating system is very different from other countries in the world. In the 1950s, the central
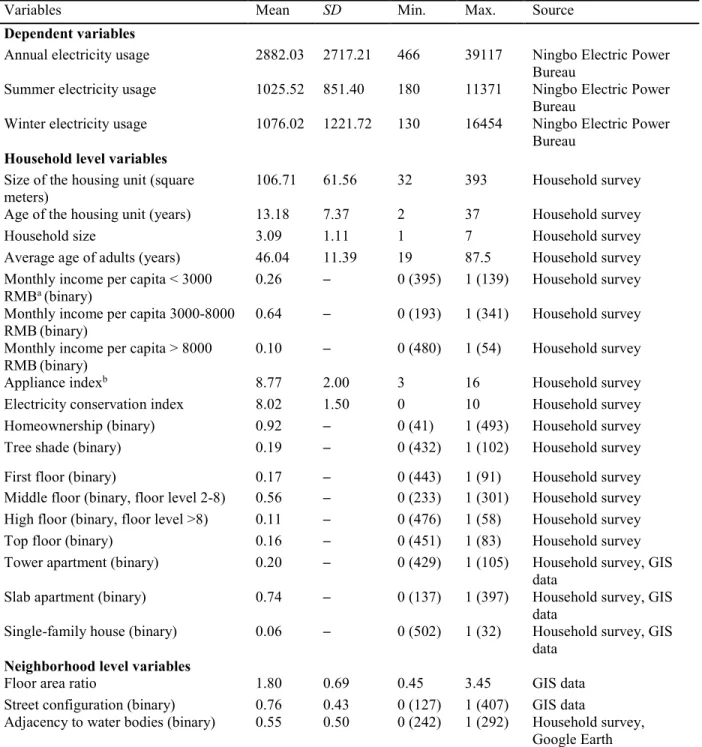
Table 3 Descriptive statistics (N=534).
Notes: a RMB is the basic unit of official currency in China.
bAppliance index is the count of the electricity intensive appliances in the housing unit.
cElectricity conservation index is a measure of common electricity conservation actions taken by the housing unit.
Variables Mean SD Min. Max. Source
Dependent variables
Annual electricity usage 2882.03 2717.21 466 39117 Ningbo Electric Power Bureau
Summer electricity usage 1025.52 851.40 180 11371 Ningbo Electric Power Bureau
Winter electricity usage 1076.02 1221.72 130 16454 Ningbo Electric Power Bureau
Household level variables Size of the housing unit (square meters)
106.71 61.56 32 393 Household survey
Age of the housing unit (years) 13.18 7.37 2 37 Household survey Household size 3.09 1.11 1 7 Household survey Average age of adults (years) 46.04 11.39 19 87.5 Household survey Monthly income per capita < 3000
RMBa (binary)
0.26 — 0 (395) 1 (139) Household survey
Monthly income per capita 3000-8000 RMB(binary)
0.64 — 0 (193) 1 (341) Household survey
Monthly income per capita > 8000 RMB(binary)
0.10 — 0 (480) 1 (54) Household survey
Appliance indexb 8.77 2.00 3 16 Household survey Electricity conservation index 8.02 1.50 0 10 Household survey Homeownership (binary) 0.92 — 0 (41) 1 (493) Household survey
Tree shade (binary) 0.19 — 0 (432) 1 (102) Household survey
First floor (binary) 0.17 — 0 (443) 1 (91) Household survey
Middle floor (binary, floor level 2-8) 0.56 — 0 (233) 1 (301) Household survey
High floor (binary, floor level >8) 0.11 — 0 (476) 1 (58) Household survey
Top floor (binary) 0.16 — 0 (451) 1 (83) Household survey
Tower apartment (binary) 0.20 — 0 (429) 1 (105) Household survey, GIS
data
Slab apartment (binary) 0.74 — 0 (137) 1 (397) Household survey, GIS
data
Single-family house (binary) 0.06 — 0 (502) 1 (32) Household survey, GIS
data Neighborhood level variables
Floor area ratio 1.80 0.69 0.45 3.45 GIS data Street configuration (binary) 0.76 0.43 0 (127) 1 (407) GIS data
2.4.Results
Multilevel regression results for annual, summer, and winter electricity consumption are
presented in Table 4. In each case, base models (Annual Model 1, Summer Model 1, and Winter
Model 1) only include household-level variables; Annual Model 2, Summer Model 2, and Winter
Model 2 include both household-level variables and neighborhood urban form metrics as
explanatory variables. Based on the chi-square values of the summer and winter electricity
consumption models, the summer electricity consumption models generally have more
explanatory power than the winter models. For the annual models, after the neighborhood urban
form metrics were added, the chi-square value increases from 314.15 to 401.46, which is quite
significant with 3 degrees of freedom. Similar patterns can be found in summer and winter
models: the addition of neighborhood urban form metrics can cause increases to chi-square
values of 92.78 and 54.57 respectively, which are both significant with 3 degrees of freedom.
Overall, the addition of neighborhood urban form metrics can significantly improve model fit for
annual and seasonal electricity consumption models.
Annual Model 3, Summer Model 3, and Winter Model 3 are the extension models with the
interaction terms of neighborhood density and dwelling type added. In Summer Model 3, after
the interaction terms are added, the chi-square values increase from 419.83 to 436.30, which is
significant with 2 degrees of freedom. However, the addition of the same interaction terms would
not improve the overall model fit for either annual or winter models, since the increase of the
2
7
Table 4 Annual and seasonal multilevel regression results.
Variable Annual
Model 1 Annual Model 2 Annual Model 3 Summer Model 1 Summer Model 2 Summer Model3 Winter Model 1 Winter Model 2 Winter Model 3 Household level variables
Ln(Size of the apartment/h ouse) 0.3207*** (0.0813) 0.3032*** (0.0810) 0.3047*** (0.0810) 0.3220*** (0.0782) 0.3053*** (0.0777) 0.3059*** (0.0719) 0.3625*** (0.1002) 0.3458*** (0.1013) 0.3476*** (0.1014)
Age of the apartment/h ouse -0.0003 (0.0042) -0.0002 (0.0038) -0.0008 (0.0039) 0.0018 (0.0040) 0.0015 (0.0036) 0.0009 (0.0037) -0.0042 (0.0051) -0.0038 (0.0048) -0.0044 (0.0049) Household size 0.1062*** (0.0191) 0.0980*** (0.0190) 0.0970*** (0.0191) 0.0992*** (0.0184) 0.0909*** (0.0183) 0.0891*** (0.0182) 0.1175*** (0.0237) 0.1087*** (0.0236) 0.1079*** (0.0236) Average age of adults -0.0049*** (0.0019) -0.0052*** (0.0018) -0.0054*** (0.0018) -0.0058*** (0.0018) -0.0061*** (0.0018) -0.0064*** (0.0018) -0.0049** (0.0023) -0.0053** (0.0023) -0.0054** (0.0023) Income per capita < 3000 RMB -0.1826*** (0.0552) -0.1766*** (0.0542) -0.1826*** (0.0552) -0.1573*** (0.0533) -0.1440*** (0.0521) -0.1480*** (0.0518) -0.2109*** (0.0683) -0.2076*** (0.0676) -0.2090*** (0.0675) Income per capita > 8000 RMB 0.1196 (0.0798) 0.1406 (0.0786) 0.1208 (0.0807) 0.1201 (0.0771) 0.1376 (0.0757) 0.0964 (0.0775) 0.1071 (0.0989) 0.1337 (0.0979) 0.1193 (0.1007) Appliance index 0.0387*** (0.0141) 0.0496*** (0.0135) 0.0496*** (0.0135) 0.0417*** (0.0123) 0.0521*** (0.0130) 0.0524*** (0.0130) 0.0362** (0.0166) 0.0468*** (0.0169) 0.0467*** (0.0169) Electricity conservation index -0.0273* (0.0136) -0.0243* (0.0138) -0.0241* (0.0139) -0.0205 (0.0136) -0.0184 (0.0133) -0.0165 (0.0134) -0.0371** (0.0174) -0.0332* (0.0172) -0.0334* (0.0174) Homeowner ship -0.0482 (0.0818) -0.0920 (0.0802) -0.0883 (0.0804) -0.0553 (0.0789) -0.0938 (0.0772) -0.0912 (0.0770) -0.0224 (0.1012) -0.0681 (0.1000) -0.0642 (0.1003) Tree shade -0.1719***
(0.0687) -0.1829*** (0.0667) -0.1796*** (0.0677) -0.1723*** (0.0661) -0.1837*** (0.0638) -0.1754*** (0.0638) -0.1785*** (0.0847) -0.1994** (0.0836) -0.1976** (0.0837)
First floor 0.0997* (0.0543) 0.0924* (0.0539) 0.0938* (0.0538) 0.0140* (0.0525) 0.0079 (0.0519) 0.0098 (0.0517) 0.1817*** (0.0673) 0.1736** (0.0670) 0.1748*** (0.0670) High floor (floor level >8) -0.0278 (0.0811) -0.0323 (0.0797) -0.0268 (0.0809) -0.0112 (0.0783) -0.0151 (0.0767) -0.0127 (0.0775) -0.0520 (0.1004) -0.0539 (0.0994) -0.0475 (0.1009)
2 8 Tower apartment 0.0018 (0.0689) 0.00247 (0.0645) 0.0817 (0.0689) -0.0429 (0.0662) -0.0314 (0.0618) -0.0249 (0.1646) -0.0525 (0.0848) 0.0769 (0.0808) 0.1470 (0.2186) Single-family house 0.6648*** (0.1544) 0.6601** (0.1446) 1.3054** (0.6161) 0.6017*** (0.1486) 0.6041*** (0.1383) 1.8725*** (0.5862) 0.7132*** (0.1902) 0.7006*** (0.1811) 1.1854 (0.7718) Neighborhood level variables
Floor area ratio 0.0707 (0.0461) 0.0806* (0.0489) 0.0914*** (0.0436) 0.0999** (0.0456) 0.0358 (0.0583) 0.0461 (0.0619) Street configuratio n -0.2519*** (0.0586) -0.2411*** (0.0590) -0.2445*** (0.0553) -0.2244*** (0.0548) -0.2591*** (0.0742) -0.2508*** (0.0750) Adjacency to water bodies -0.0307 (0.0554) -0.0307 (0.0556) -0.0219 (0.0524) -0.0172 (0.0519) -0.0624 (0.0699) -0.06373 (0.0750) Cross-level interactions Floor area ratio×Tower apartment -0.0332 (0.0921) -0.0052 (0.0873) -0.0404 (0.1157) Floor area ratio×Single -family house -0.8224 (0.7731) -1.6275** (0.7369) -0.6114 (0.9675)
Intercept 6.1286*** (0.3803) 6.2439*** (0.3957) 6.2249*** (0.3955) 5.0927*** (0.3661) 5.1643*** (0.3796) 5.1386*** (0.3771) 4.949*** (0.4690) 5.1463*** (0.4947) 5.1290*** (0.4949)
Wald Chi2 314.15*** 401.46*** 405.56*** 327.05*** 419.83*** 436.30*** 247.49*** 302.06*** 303.76***
Log likelihood
-333.52 -324.93 -324.31 -314.94 -305.23 -302.81 -447.99 -442.17 -441.91
Degree of freedom
16 19 21 16 19 21 16 19 21
Groups 46 46 46 46 46 46 46 46 46
The regression results reveal the effects of neighborhood urban form variables on
residential electricity consumption. When other important covariates have been controlled for,
floor area ratio, which measures the physical density of residential neighborhoods, does not
appear to have a significant effect on annual electricity consumption (p>0.1 in Annual Model 2).
However, the positive effect becomes significant when I modeled the effect of floor area ratio on
summer electricity consumption (p<0.01). This is consistent with what might be expected in the
context of an exacerbated heat island effect in the summer. Additionally, the regression results of
Winter Model 2 show no statistically significant association between neighborhood density and
winter electricity consumption, which is consistent with the results from an existing study by
Wilson (Wilson 2013). As was previously stated, I also hypothesized that neighborhood density
has different effects on households located in different types of dwelling units. In Summer
Model 3, I find evidence of a significant negative interaction between floor area ratio and the
single-family house binary variable. Interestingly, when this interaction is accounted for, the
effect of neighborhood density on summer electricity use becomes negative and significant,
which indicates higher densities can somehow reduce electricity consumption for families in
single-family houses; this statistically significant negative effect of neighborhood density on
electricity consumption for single-family homes only exists in summer months.
Street configuration has a significant effect on annual, summer, and winter electricity
usage, which is consistent with existing studies and theories indicating that east-west street
orientation is more energy efficient since it results in more south-facing buildings with greater
passive solar gains (Erley and Jaffe 1979; Robinette 1983; Shishegar 2013; Ko 2013; Ko and
Radke 2014). Additionally, based on our regression results, there exists no statistically
consumption in the households, as the adjacency variable is not significant in any of these
models; this is consistent with Ko & Radke’s results (Ko and Radke 2014).
Among household-level urban form variables, tree shading appears to have a statistically
significant impact on household electricity consumption. When controlled for other variables,
homes with tree shading are associated with lower electricity consumption in summer months;
this effect is also significant in winter month, most likely because trees located near housing
units block winds during the winter, thus reducing indoor heating energy consumption. Dwelling
type is a statistically significant predictor of household electricity consumption, as our regression
results for annual, summer, and winter electricity consumption all indicate that homes located in
single-family houses are likely to consume more electricity than homes located in slab
apartments. Our results also indicate that, while other important covariates are controlled for,
there are no statistically significant differences in electricity consumption between homes located
in tower apartments and slab apartments.
In addition to urban form variables, the size of the apartments/houses, household sizes,
average ages of adults, income levels, and the number of household electricity-intensive
appliances are also significant predictors of household electricity consumption, which is
consistent with existing theory. Our results also suggest that the size of apartments/houses and
household sizes are dominant factors influencing household electricity consumption, which is
similar to existing findings in different geographic contexts (Esmaeilimoakher et al. 2016; Wilson 2013). In contrast, ages of apartments/houses and homeownership do not exhibit a
significant association with annual, summer, or winter electricity consumption, as is indicated in
our regression results. Interestingly, our results indicate that low-income households with
in the medium income category, which is statistically significant and consistent in both winter
and summer months. However, there are no significant differences in electricity consumption
between the households in the high-income category with monthly per capita incomes greater
than 8000 RMB and those in the medium-income category. Additionally, there are no
statistically significant differences in electricity consumption among households located on
middle floors (floor level 2-8), those on high floors (floor level >8), or those on the top floor.
However, I do find evidence that households on the first floor may consume more electricity,
especially in winter months, which might result from limited solar access in winter months.
2.5.Discussion
The results of this study suggest clear effects of neighborhood-level urban form,
especially physical density measured by floor area ratio, on household electricity consumption. It
is interesting to note that the effect of neighborhood density on energy consumption may be
completely different in different seasons and (or) for households located in different types of
dwelling units. Our multi-level regression results suggest a positive relationship between density
(floor area ratio) at the neighborhood-level and summer electricity consumption, which supports
the theory that denser built environments significantly contribute to the heat island effect
(Giridharan, Ganesan, and Lau 2004; B Chun and Guldmann 2014; Tran et al. 2017). However, the significant positive effect of density only exists for households located in slab and tower
apartments, which makes sense because slab and tower apartment are located in dense urban
neighborhoods. Thus, increasing physical density can exacerbate the heat island effect in these
neighborhoods, which in turn increases household cooling energy demands in the summer. On
the other hand, when it comes to single-family houses, the effect of physical density on
with the results of previous studies in the United States which are composed of single-family
houses (Stone and Norman 2006; Wilson 2013). Based on these studies, the hypothesized link
between density and electricity consumption is explained through a different mechanism in
low-density neighborhoods with single-family houses: Stone and Norman (Stone and Norman 2006)
claim that urban residential development with lower densities contribute more surface energy to
the formation of the heat island effect than higher density residential developments, since larger
lawns associated with low-density residential development are a significant contributor to
surface heating. Additionally, higher physical densities also contribute to more mutual shading
between buildings, which is a very important factor during the summer in terms of reducing
household energy consumption for single-family houses (Laura et al. 2012; Shaviv and Yezioro 1997). It is also worthwhile to note that I did not find any significant effect of neighborhood
density on household electricity consumption during winter months, which is consistent with the
results of Wilson’s study (Wilson 2013), even though electricity is the primary source for heating
homes in Ningbo. This might stems from the possible trade-offs of density effects of building
cooling energy demands: on the one hand, neighborhood with higher density has been associated
with lower thermal losses in winter months (Ewing and Rong 2008), which can in turn reduce
the heating loads in buildings; on the other hand, denser neighborhoods also suffer from less
solar gains in winter months.
According to our regression results, building age does not significantly influence
residential household electricity consumption; this result might stem from most of the
households I surveyed living in apartments that were built after China’s housing reform; since
that time, there have been very limited differences in insulation across new buildings.
located in slab and tower apartments, which are the two dominant dwelling types in Chinese
cities; the effect of dwelling types on residential electricity consumption is lower compared to
the findings of previous studies. These findings may indicate that, because of unique features
associated with building age and dwelling type in Chinese cities, the effects of building
characteristics on residential energy consumption might be less noticeable in China, comparing
with findings from previous studies in other countries.
Furthermore, in contrast with existing research, the average age of adults is found to have
a negative relationship with household electricity consumption. This finding is consistent with
more nuanced results from studies about occupant electricity consumption behavior in Chinese
cities, which reveal that older occupants exhibit a more frugal behavior than their younger
counterparts (Chen, Wang, and Steemers 2013).
2.6.Conclusions
This study uses a unique dataset to examine the impact of urban form on residential
electricity consumption in Ningbo, China. The results suggest a clear role of urban form metrics
in affecting residential electricity consumption. In our sample mainly composed of apartment
homes, neighborhood density is positively associated household electricity consumption in
summer, while controlling for other important demographic, socioeconomic, behavior, and
property covariates. An important finding of this study is that, the effects of neighborhood
density on residential electricity are different in different seasons, and (or) for households located
in different types of buildings: neighborhood density could significant influence household
electricity consumption in summer, while I do not find any linkages between neighborhood
in high-density neighborhoods, there exists a positive relationship between neighborhood density
and electricity consumption in summer, since increasing physical density would cause
exacerbated heat island effect in these neighborhoods. However, for single-family houses located
in low-density neighborhoods, increasing neighborhood density could significantly reduce
residential electricity consumption in summer, which is associated with less exposed surface,
reduced surface heating, and more mutual shading. Therefore, the urban form effects on
residential consumption should be distinctly considered for different seasons, and for different
types of housing stock and neighborhoods. In terms of controlling residential energy
consumption through the lens of urban form, heat island mitigation strategies might be very
important for Chinese residential neighborhoods in summer, which are mainly composed of slab
and tower apartments, with dense urban form. In addition, this study also reiterates the
importance of neighborhood street configuration (building orientation), tree shade in controlling
residential electricity consumption, and by extension, greenhouse gas emissions. The results of
this study could also help urban planners and policy makers to think more critically about