Abstract
Microtubules (MTs) are essential for numerous cellular processes. MTs impact cell
shape, serve as intra-cellular transport tracks, and form the mitotic spindle.
Microtubule-associated proteins (MAPs) modulate MTs to afford differing MT dynamics and ultra-structure.
The TACC proteins, a highly conserved MAP family, localize to the MT plus-end and to
centrosomes where they affect MT dynamics and interact with other MAPs to modulate their
MT-regulating potency. We focus on the interplay between TACC and the MT polymerase,
XMAP215. To elucidate TACC’s mechanisms of centrosome-localization and
XMAP215-recuitment in cells, we used Drosophila S2 cells as a model cell system. We used truncational
analysis of Drosophila TACC (DTACC) in order to identify regions of DTACC that localize to
the centrosome and to MT plus-ends using fluorescence microscopy. These results suggest the
determinants of DTACC that confer in vivo Msps (Drosophila XMAP215) binding and are
Introduction
The cytoskeleton provides structural support and allows for cellular motility, intracellular
transport, and chromosomal segregation in eukaryotic cells. The three main components of the
cytoskeleton are actin filaments, intermediate filaments, and microtubules (MTs). This study
focuses on MTs, which establish cell polarity for directed migration, create pathways for
intracellular transport, and form the bipolar spindle during cell division. During interphase, MTs
make up the vast network responsible for cellular structure and intracellular transport. At the
onset of mitosis, however, the MT network is restructured to form the characteristic bipolar
spindle necessary for chromosome separation and cell division. The bipolar spindle is a
three-dimensional ovular structure formed by MTs radiating from two centrosomes at opposite ends of
the cell (as discussed in Tuszynski et al., 1997). Centrosomes are composed of a nine-fold
symmetric centriole surrounded by a coat of proteins known as the pericentriolar material
(PCM). PCM proteins nucleate and regulate MT dynamics; however, the mechanisms by which
these events are regulated remain poorly understood (as discussed in Glover, et al., 1993). One
protein family in particular, the TACC (transforming acidic coiled coil) family, has been shown
to localize to centrosomes where is has been shown to affect MT density. Thus, it has been
Figure I1
1
100aa 1064 1308
DTACC (D. melanogaster)
TAC-1 (C. elegans)
hTACC3 (H. sapiens)
XTACC3 (X. laevis)
Alp7 (S. pombe)
TACC Domain
Aurora A consensus site SPD repeats
SPAZ motif
hypothesized to play a role in MT nucleation and/or stability at the centrosome. Despite the
discovery of the TACC family over fifteen years ago, there is little structural or mechanistic
information on how the TACC family interacts with or regulates MTs.
The TACC protein family is conserved across a wide variety of eukaryotic organisms
including C. elegans, D. melanogaster, X. laevis, and H. sapiens (as discussed in Peset and
Vernos, 2008) (Figure I1). In humans, there are three TACC homologues: TACC1, TACC2, and
TACC3. Human TACC3 was first observed via its over-expression in malignant tumors (Still et
al., 1999). Every TACC homolog shares a highly conserved 200-amino acid domain at its
C-terminus, which is predicted to form a coiled-coil. This coiled-coil domain has been shown to
confer localization to the centrosome and is thought to contribute to the stability of the spindle
(Gergely et al., 2000). Furthermore, the coiled-coil domain of TACC family of proteins has been
shown to interact with the C-terminal region of the XMAP215 family (Xenopus
microtubule-associated protein, 215 kDa). The XMAP215 family is a well-studied MT plus-end localizing
protein family that increases both the polymerization and depolymerization rates of MTs
(Shirasu-Hiza et al., 2003). Just as the TACC and XMAP215 families are conserved across
evolution, so too is the TACC-XMAP215 interaction. XTACC3 and XMAP215 function
together in X. laevis to attach MTs to the centrosome (Albee and Wiese, 2008). In C. elegans,
TAC-1 (TACC family) and ZYG-9 (XMAP215 family) function together to promote MT
polymerization and stabilize each other(Bellanger and Gönczy, 2003). In humans, TACC3 and
ch-TOG (XMAP215 family), along with other protein factors, form complexes that stabilize
kinetochore MTs during mitosis (Booth et al., 2011).
Just as the cooperation of the XMAP215 and TACC families to regulate MTs is
the conserved interaction of large regions of each protein, current literature suggests that the
specific TACC and XMAP215 residues that afford this interaction differ greatly between species
(Hood et al., 2013; Thakur et al., 2014; Mortuza et al., 2014). This lack of “agreement” of the
TACC-XMAP215 interacting regions remains one of the most poorly understood aspects of the
TACC family. Thus, I set out to resolve this discrepancy in the field. To further understand the
interaction of these two proteins, I chose to work with the Drosophila homologue of the TACC
family (DTACC), as the specific residues of DTACC that interact with the Drosophila
XMAP215 homologue, Minispindles (Msps), have not been elucidated.
DTACC is known to localize to the centrosome during mitosis (Gergely et al., 2000), and
our lab has observed DTACC localization to MT plus-ends when expressed in vivo (Figure S1).
DTACC is necessary for proper Drosophila embryonic development, as DTACC mutant
embryos exhibit abnormal spindles, shorter MTs, and chromosome missegregation (Raff et al.,
2002). Mutant DTACC cellular phenotypes suggest that DTACC stabilizes the bipolar spindle at
the centrosome, although the mechanism for this stabilization remains unknown.
In order to resolve discrepancies in the field of how the TACC family interacts with the
XMAP215 family and how this interaction in turn regulates MTs, I sought to understand the
specifics of how DTACC binds Msps.
Since the evolutionarily conserved TACC domain sequence interacts with Msps in vivo,
it follows that the TACC domain should have a conserved structural motif that affords its
Msps-interaction function. Despite the lack of any definitive DTACC tertiary structure, secondary
structure software predicts the TACC domain forms a coiled-coil. Previous research in the Slep
lab using truncational analysis of DTACC’s coiled-coil domain identified a minimal region of
when expressed in cell culture (Figure S2). This localization was shown to be Msps-dependent
(Figure S1). In order to elucidate the specific residues involved in the DTACC-Msps interaction,
I designed a set of experiments that mutated specific residues in this DTACC region, and I then
assayed for the ability of the mutant proteins to interact with Msps.
Secondary structure predictions suggest that the TACC domain forms a coiled-coil,
which is a highly α-helical superstructure. Hydrophobic residues on the inner surfaces of these α
-helices typically mediate coiled-coil formation, while hydrophilic residues on the
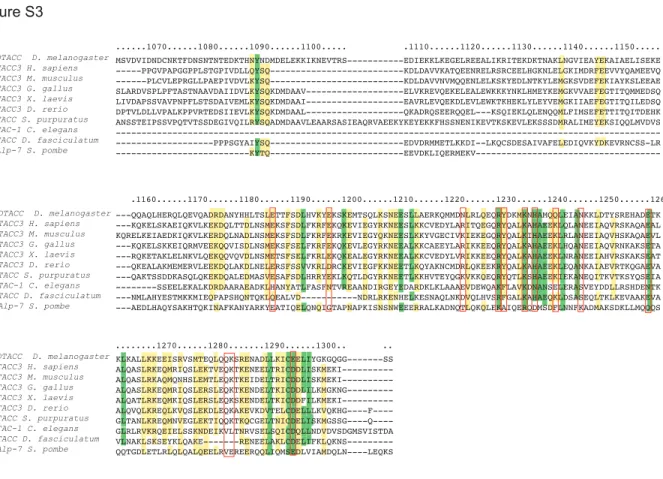
solvent-exposed helical surfaces can confer binding to other cellular factors. Using secondary structure
prediction software and sequence-homology alignments between DTACC and its homologues, I
identified a set of highly conserved, charged residues throughout the TACC domain (Figure S3).
I hypothesize that these charged residues create a charge-specific binding surface on the TACC
domain coiled-coil, which mediates the DTACC-Msps interaction. To test these hypotheses, I
have used a combination of cell biological, biochemical, and structural techniques that have
further characterized DTACC’s structure and its interaction with Msps. The results of these
experiments have enabled me to determine specific residues and regions on DTACC that confer
localization to MT plus-ends and to centrosomes. Thus, I have added to the field an additional set
of TACC/XMAP215 data to further characterize the interaction between these two families.
Materials and Methods
A. Cloning and Expression
I amplified dtacc fragments (residues 1064-1304, 1092-1304, 1119-1304, 1135-1304,
1158-1304, 1177-1304) using PCR, restriction digested the PCR fragments, and ligated each
protease-cleavable poly-histidine (poly-his) tag. In addition to pET-28 b, I also ligated dtacc 1064-1304
cDNA into pENTR/D-TOPO (Life Technologies), an E. coli entry vector and then transferred
the insertion to pDEST 15, a bacterial destination vector with a glutathione S-transferase (GST)
tag. I amplified and purified each construct using XL1B E. coli cells and a standard Miniprep
protocol before confirming the correct insertion of each dtacc cDNA using sequence analysis.
I transformed DTACC plasmids into BL21 DE3 (pLysS) E. coli cells and grew the cells
in 6 L of selective lysogeny broth (LB) at 37 ºC until the cells reached an optical density of
0.600-0.800 at a wavelength of 600.0 nm. I induced the cells with 10 mM Isopropyl β
-D-1-thiogalactopyranoside (IPTG) and shook for 24 hours at 18 ºC before harvesting the cells. I
centrifuged the cells at 3,500 rpm for 10 minutes at 4 ºC and resuspended the bacterial pellet in
150 mL of Ni2+-NTA Buffer A (25 mM Tris pH 8.0, 300 mM NaCl, 10 mM Imidazole, 0.1%
2-Mercaptoethanol). I resuspended the GST bacterial pellet in GST Buffer A (25 mM Tris pH 8.0,
300 mM NaCl, 0.1% 2-Mercaptoethanol (βME)). I treated the resuspended pellet with 1.0 mM
PMSF protease inhibitor and lysed each growth of cells using three cycles of sonication. I
centrifuged the lysate at 15,000 rpm at 4 ºC for 45 minutes before extracting the supernatant. To
test for expression and solubility of the novel DTACC protein constructs, I took 1.0-mL samples
of each DTACC bacterial growth at each of the four steps in the DTACC expression process:
pre-IPTG-induction, post-IPTG-induction, post-centrifugation pellet (insoluble fraction), and
post-centrifugation supernatant (soluble fraction). I separated the samples using sodium dodecyl
sulfate polyacrylamide gel electrophoresis (SDS-PAGE) at 200 V for 40 minutes to confirm
B. Protein Purification
For the expressed DTACC-poly-his constructs, I loaded the centrifugation supernatant for
each poly-his-tagged construct onto separate Ni2+-NTA columns (Qiagen). I washed off unbound
sample with 250 mL Ni2+-NTA Buffer A, and eluted the proteins with a fractionated, linear
imidazole gradient (10-150 mM). I identified protein-containing fractions with SDS-PAGE
before cleaving the poly-his tag from the fractionated proteins using a PreScission protease. I
dialyzed out excess imidazole and poly-his into 3 L of Ni2+-NTA Buffer A for 18 hours at 4 ºC. I
passed each cleaved DTACC construct through another Ni2+-NTA column to separate the
cleaved proteins from uncleaved protein, remaining poly-his, and PreScission protease. I
concentrated the Ni2+-NTA-purified DTACC constructs with multiple 20-minute centrifugation
steps at 4,000 rpm in an appropriate size-exclusion column (10-30 kDa). I transferred and
concentrated each DTACC construct into protein storage buffer (130 mM NaCl, 10 mM HEPES
pH 8.0) to concentrations of 5-10 mg/mL.
For the purification of DTACC 1064-1304-GST, I mixed the centrifugation supernatant
with GST-coated beads in GST Buffer A, and incubated the bead slurry on a rotator for 18 hours
at 4 ºC to allow sufficient binding. I loaded the bead slurry into a flow column and washed the
beads with 600 mL GST Buffer A. I batch eluted the DTACC-GST with 50 mL of fresh GST
Buffer B (25 mM Tris pH 8.0, 25 mM reduced glutathione, 300 mM NaCl, 0.1% βME). I
concentrated DTACC-GST to 5 mg/mL in protein storage buffer. For control pull-down
experiments involving DTACC-GST, I also expressed and purified GST alone (according to the
C. Circular Dichroism
I performed circular dichroism (CD) with the assistance of Rebecca Adikes, Amy
Howard, and Dr. Ashutosh Tripathy (UNC-CH MAC-IN-FAC) using a Chirascan Plus Steady
State CD spectrophotometer. I diluted the protein concentration to 0.1-0.5 mg/mL for the CD
scan and temperature ramps. We took background scans at 20 ºC with and without CD buffer (10
mM NaPO4 pH 7.5, 30 mM NaF) from wavelengths of 185-260 nm with a step size of 0.5 nm, a
1-nm bandwidth, and 1.25 s per point. We took sample scans with the same parameters. For each
sample, we took CD over a 20-94 ºC temperature ramp at 208 and 222 nm wavelengths. The
protein samples on which we performed CD were DTACC 1177-1304 and 1064-1176 (both
purified beforehand by Rebecca Adikes).
D. GST Pull Down Assays
I resuspended Glutathione magnetic beads (Pierce) and aliquoted 50 µL of the bead slurry
(12.5 µL of pure beads) into separate microcentrifuge tubes. I magnetically separated the beads
from the supernatant before removing the supernatant. I washed the beads with three rounds of
300 µL GST bead wash buffer (125 mM Tris pH 8.0, 150 mM NaCl, 0.1% βME). I resuspended
the beads and added purified DTACC 1064-1304-GST fusion protein to a final concentration of
10 ng of protein per 1 µL of beads to a final total volume of 300 µL. I incubated the beads on a
nutator for 18 hours at 4 ºC before washing three times. I saved each supernatant sample before
boiling them with SDS-PAGE loading dye. I added Msps C-terminal fragments (purified by
Rebecca Adikes) to the resuspended bead slurry for a final DTACC:Msps molar ratio of 1:1 and
a final volume of 300 µL. I incubated and washed the beads according the same protocol above. I
then boiled the beads with 100 µL of 1X SDS-PAGE loading dye before analyzing the
E. Protein Crystallization
I performed all crystallization assays using the hanging-drop method at 4 ºC. The trays,
well solutions, and glass cover slides were pre-cooled to 4 ºC before introducing protein. I
thawed DTACC 1064-1304 at ~5 mg/mL on ice (0 ºC) and further concentrated to ~10 mg/mL
using multiple 20-minute centrifugation steps at 4 ºC. I then performed an aggregate-clearing
spin at 50,000 rpm at 4 ºC for 10 minutes. I immediately used the cleared protein to make crystal
drops with a v/v ratio of 1:1, 2:2, or 1:3 protein to crystallization solution. I made control drops
using the same ratio of protein storage buffer and crystallization solution. Trays were incubated
for at least 24 hours at 4 ºC before observations of ~10 minutes at 23 ºC. The broad-screen well
solutions used were HR2-126 PEG-Ion Screen or HR2-110 Crystal Screen (Hampton Research).
All other solutions used the following ranges of conditions: 10-40% 2-propanol, 0.1-0.2 M
sodium cacodylate pH 5.0-7.0, and 0.10-0.30 M sodium citrate.
F. Mutation Design and Cloning
I selected 14 evolutionarily conserved, charged residues in DTACC 1177-1308 using
sequence alignments and secondary structure predictions. To test the importance of the 14
charged TACC domain residues in Msps binding, I designed missense mutations to these
residues that either ablated or reversed the conserved charge. I generated 14 mutant constructs
within DTACC 1177-1308 using QuikChange (QC) reactions with primers containing the
desired mutations. The 14 mutations cloned were as follows: E1186K, E1197K, N1223E,
R1230E, Y1231A, Y1231F, K1235A, K1235E, H1237E, Q1241E, N1246E, E1259K,
QK1283-4AE, E1296K. For further analysis, I also selected and cloned seven of these mutations into
dtacc 1064-1308, which were as follows: R1230E, Y1231F, K1235E, K1235A, N1246E,
that contains a metallothionein promoter and a C-terminal green-fluorescent protein (GFP) tag.
After QC, I treated the DNA with Dpn1 for one hour and transformed into XL1B E. coli cells
using a standard transformation protocol. I amplified and purified the plasmids using a standard
Miniprep protocol.
G. Cell Culture/Imaging
For the DTACC mutations, I treated Drosophila S2 cells daily with 2 µL of RNA that
targets the N-terminus of DTACC for a total of seven days. I co-transfected the cells with 1000
ng of mutant DTACC-GFP DNA and 1000 ng of α-tubulin-mCherry DNA (provided by Dr.
Steve Rogers lab) using an Amaxa S2 electroporation transfection protocol 48 hours before
imaging. I induced protein expression with 0.5 µL of 100mM CuSO4 24 hours before imaging. I
plated the induced cells onto Concanavalin A (ConA)-coated glass bottom petri dishes and
incubated for 30 minutes at 23 ºC. With the assistance of Dr. Jaime Fox, I collected time-lapse
images of the co-transfected S2 cells with a 100x NA 1.45 Plan Apochromat objective using a
VT-Hawk (VisiTech) software system with an Orca-R2 CCD camera controlled using VisiTech
Vox software.
For the mitochondrial KnockSideways (KS) experiments, I obtained a pre-cloned
PAtRFPTom20DTACC construct (Rebecca Adikes) containing a mitochondrial localization
(mito) sequence, a red fluorescent protein tag (tRFP), and dtacc 1064-1308. I co-transfected S2
cells with 750 ng of PAtRFPTom20DTACC and 750 ng of Msps 1596-2042-GFP DNA. I
induced the cells according to the same protocol as above and imaged the cells using Nikon
Results
A. Structure of DTACC C-terminal Region is α-helical and Dimeric
We hypothesize that DTACC interacts with Msps through its C-terminal coiled-coil
domain, so we first probed the C-terminal domain using CD to determine if this domain was
alpha helical. CD of three DTACC truncations (1177-1304, 1064-1176, and 1064-1304) were
taken to characterize the secondary structure of different regions of the C-terminal TACC
domain. Wavelength CD of both DTACC 1177-1304 and 1064-1177 (Figure 1A,C) showed
absorbance minima at 208 and 222 nm. Temperature ramp CD at 208 and 222 nm for each
construct (Figure 1B,D respectively) showed a low melting curve for each fragment; a melting
temperature (Tm) could not be calculated for either fragment. The full TACC domain
(1064-1304) had similar CD minima at 208 and 222 nm wavelengths (Figure 1E), and the temperature
ramp CD revealed a characteristic melting curve with a Tm of 32 ºC.
Because coiled-coils typically mediate dimerization, we tested populations of purified
DTACC C-terminal fragments for oligomerization using SEC-MALS. Dynamic light scattering
revealed that DTACC 1064-1304 (Figure S4A) primarily exists as population of dimers with an
observed molecular weight (MW) of 59.4 kDa. Similarly, DTACC 1177-1304 (Figure S4C) also
presented as a dimer with a MW of 28.8 kDa. DTACC 1064-1176 (Figure S4B) was the only
truncation analyzed that consisted of a monomer population with a MW of 14.5 kDa. Thus, we
confirmed that the TACC domain dimerizes, and we identified which TACC domain fragment is
Figure 1
C D
DTACC 1064-1176 CD (mDeg)
DTACC 1064-1304 CD (mDeg)
Figure 1. CD of DTACC C-terminal region. The DTACC constructs used for CD were: 1177-1304 (A,B), 1064-1176 (C,D), and 1064-1304 (E,F; performed by Rebecca Adikes). CD were taken at wavelengths of 185-260 nm (first column), and then at 208 nm and 222 nm from a temperature range of 20 ºC to 94 ºC (second column). All three fragments of the TACC domain show alpha helical character with CD absorbance minima at 208 nm and 222 nm (A, C, E). DTACC 1064-1304 is the most thermostable fragment (F) in comparison to its two subfragments (B,D), as signified by the more robust melting curve. The Tm of 1064-1304 was calculated to be 32 ºC.
-25 -20 -15 -10 -5 0 5 10
185 190 195 200 205 210 215 220 225 230 235 240 245 250 255 260
Wavelength (nm) DTACC 1064-1176 -25 -20 -15 -10 -5 0 5 10
185 190 195 200 205 210 215 220 225 230 235 240 245 250 255 260
DTACC 1177-1304 CD (mDeg)
Wavelength (nm) A B DTACC 1177-1304 -25 -20 -15 -10 -5 0
20 25 30 35 40 45 50 55 60 65 70 75 80 85 90 95
D
TACC
1177-1304 CD (mDeg)
Temperature (ºC) 208 nm 222 nm DTACC 1177-1304 -25 -20 -15 -10 -5 0
20 25 30 35 40 45 50 55 60 65 70 75 80 85 90 95
D
TACC
1064-1177 CD (mDeg)
Temperature (ºC) 208 nm 222 nm DTACC 1064-1176 -25 -20 -15 -10 -5 0 5 10 15 20 25 30
185 190 195 200 205 210 215 220 225 230 235 240 245 250 255 260
Wavelength (nm) E DTACC 1064-1304 -25 -20 -15 -10 -5 0
20 25 30 35 40 45 50 55 60 65 70 75 80 85 90 95
D
TACC 1064-1304 CD (mDeg)
Temperature (ºC)
208 nm 222 nm F
To directly characterize the TACC domain structure and confirm its coiled-coil structure
via X-ray protein crystallography, I attempted to crystallize purified DTACC. To first determine
which conditions favor DTACC crystal formation, 96 different Hampton Research solutions
were used to broad screen for potential crystals of Ni2+-NTA-purified DTAC 1064-1304 at a
concentration of 10 mg/mL. The only solution to yield reproducible results was HR2-110 #8 (0.2
M sodium citrate tribasic dehydrate, 0.1 M sodium cacodylate trihydrate pH 6.5, 30% v/v
2-propanol). The initial crystals in this broad-screen condition are visible under polarized light in
Figure 2A. Optimization trays were set up around HR2-110 #8 that varied the concentrations of
the salt (sodium citrate), buffer (sodium cacodylate), and precipitate (isopropanol), as well as the
pH of the solution. Most preliminary crystallization occurred at 20% isopropanol, 0.2 M sodium
citrate, and pH values between 5.0-5.5. Crystals formed most often in drops with a protein
volume to well solution volume ratio of 2:2 µL, and with an initial protein concentration of ~10
mg/mL. These optimization conditions also had no salt crystals form in control drops. An
B. DTACC Mutational Analysis Reveals Msps- and Centrosome-localization Regions
We hypothesized that certain charged residues within the second half of the TACC
domain (residues 1177-1308) constitute a charge-specific binding surface for Msps. To test this
hypothesis, I cloned the 14 DTACC mutation constructs were into DTACC 1177-1308 and
expressed in Drosophila S2 cells. These S2 cells were depleted of endogenous DTACC via
RNAi at the time of expression of exogenous DTACC mutants. To visualize the mutant DTACC
constructs’ abilities to localize to MT plus-ends (and thus interact with Msps), I performed
fluorescence microscopy of each mutant DTACC construct-transfected S2 cells. The resulting
time-lapse images of single cells were scored on the ability of its mutant DTACC construct to
localize to MT plus-ends, the MT lattice, and, if the cell was mitotic, to centrosomes. Each of the
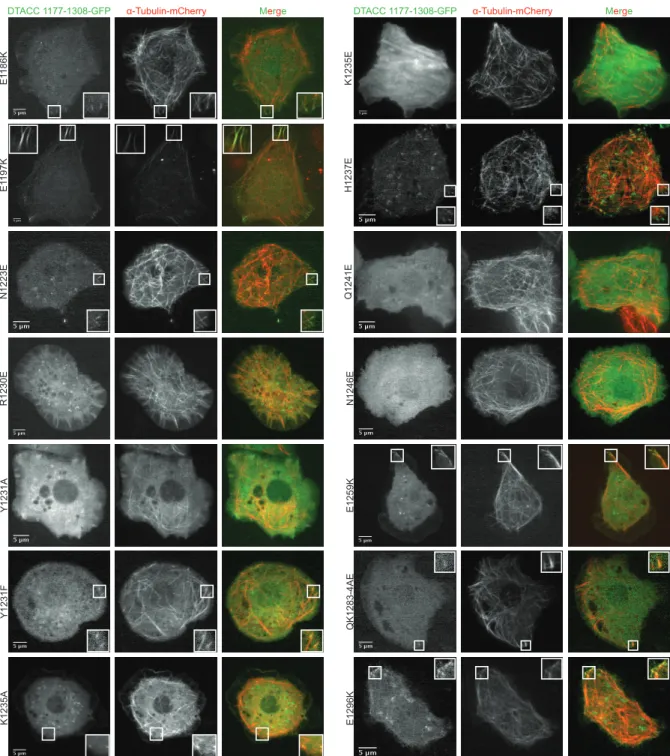
14 DTACC 1177-1308 mutations and a representative interphase image are shown in Figure 3.
Those images with white box insets represent noticeable DTACC localization to MT plus-ends
during interphase. A quantification of the mutant DTACC 1177-1308 constructs’ abilities to
localize to MTs during interphase is provided in Table 4A. A bar graph of the data presented in
Table 4A can be seen in Figure 4B that illustrates the decreased MT localization observed in
certain DTACC mutations, in comparison to the WT DTACC 1177-1308 localization patterns.
These data were used to determine which DTACC charged residues were important for Msps
binding.
We selected six of the mutations introduced to DTACC 1177-1308 for further analysis in
a different DTACC construct (marked with * in Figure 4B). These mutations were selected with
a focus on deleterious mutations that ablated DTACC’s ability to localize to MT plus-ends, as
well as similar charge reversal mutations that were not deleterious. The six mutations were
DTACC 1177-1308-GFP α-Tubulin-mCherry Merge
E1
186K
E1
197K
N1223E
R1230E
Y1231A
Y1231F
K1235A
DTACC 1177-1308-GFP α-Tubulin-mCherry Merge
K1235E
H1237E
Q1241E
N1246E
E1259K
QK1283-4AE
E1296K
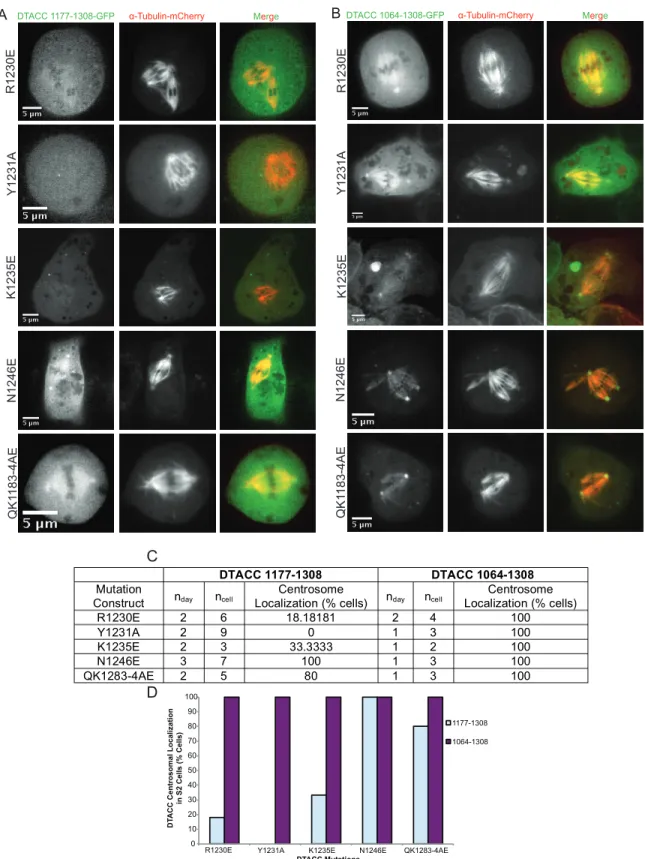
Figure 3. DTACC 1177-1308 mutational analysis during interphase. Endogenous DTACC was knocked down in S2 cells
using dsRNA against the N-terminal dtacc coding region. Truncated DTACC-GFP constructs (1177-1308) with single charge
reversal/ablation mutations were transfected into the cells. An α-Tubulin-mCherry construct was co-transfected to label MTs, and we observed the mutant DTACC constructs’ localization to MT plus-ends during interphase using fluorescence microscopy. The above images are representative cells of each construct’s ability to localize to either the MT lattice or MT plus-ends. Quantification of localization ablation for these constructs is in Figure 4.
DTACC 1177-1308
Mutation
Construct nday ncell MT Plus-end (% cells) MT Lattice (% cells) Cytoplasmic (% cells)
E1186K 2 18 77.777 83.333 16.6667
E1196K 1 9 66.6667 66.6667 33.3333
N1223E 2 13 92.307 53.846 7.692
R1230E 3 25 0 8 92
Y1231A 2 15 20 0 80
Y1231F 2 22 77.2727 68.1818 18.1818
K1235A 3 15 60 60 22.66667
K1235E 2 16 0 12.5 81.25
H1237E 2 17 76.47059 70.588 17.6471
Q1241E 4 31 22.58065 16.129 51.6129
N1246E 3 17 0 17.64706 58.823
E1259K 3 33 36.36 27.2727 24.2424
QK1283-4AE 2 13 38.4615 46.15385 53.846
E1296K 2 22 68.1818 50 27.27273
Wild Type 2 36 88.888 88.888 11.111
Figure 4 0 20 40 60 80 100 120 140 160 180 200
E1186K E1196K N1223E R1230E* Y1231A* Y1231F K1235 A
K1235E* H1237E Q1241E N1246E* E1259K QK1283/4AE*
E1296K* Wild T ype
1177-1308
D
TACC Localization in S2 Cells (% cells)
DTACC 1177-1308 Mutation
Cytoplasmic
MT Lattice
MT Plus-end
Figure 4. Quantification of DTACC 1177-1308 mutation localization during interphase. (A) This spreadsheet represents the total number of cells for each construct that exhibited localization of mutant DTACC 1177-1308 to MT plus-ends and to the MT lattice. Cells without any noticable DTACC punctae along MTs were marked “cytoplasmic.” WT DTACC 1177-1308 is presented in the bottom row for comparison. (B) Graphical representation of data presented in (A). Mutations marked with * were selected for further analysis in DTACC 1064-1308 (Figure 5).
B
A
DTACC 1064-1308-GFP α-Tubulin-mCherry Merge Y1231A R1230E K1235E N1246E QK1 183-4AE E1296K 0 20 40 60 80 100 120 140 160 180 200
R1230E Y1231 A
K1235E N1246E QK1283-4AE
E1296K Wild T ype
1064-1308
D
TACC Localization in S2 Cells (% Cells)
DTACC 1064-1308 Mutation Cytoplasmic
MT Lattice MT Plus-ends
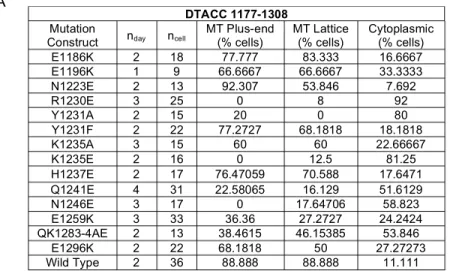
Figure 5. DTACC 1064-1308 mutational analysis during interphase. A subset of the mutations made to 1177-1308 were selected for study in the full DTACC TACC domain using S2 cells and fluorescence microscopy. Representative images of the MT localiza
-tion ability of each 1064-1308 mutant DTACC construct are shown in (A). Every construct was observed to localize robustly to MT plus-ends. (B) Spreadsheet showing the data for all imaged cells with mutant DTACC 1064-1308. (C) Graphical representa
-tion of data presented in (B). Wild type 1064-1308 localiza-tion patterns are presented for comparison. Figure 5
A
C
DTACC 1064-1308-GFP α-Tubulin-mCherry Merge
B
DTACC 1064-1308
Mutation
Construct nday ncell MT Plus-end (% cells)
MT Lattice (% cells)
Cytoplasmic (% cells)
R1230E 2 15 100 100 0
Y1231A 2 15 100 100 0
K1235E 1 7 100 85.714 0
N1246E 1 9 100 77.778 0
QK1283-4AE 1 8 100 100 0
E1296K 2 8 100 75 0
0 10 20 30 40 50 60 70 80 90 100
R1230E Y1231A K1235E N1246E QK1283-4AE
D
TACC Centrosomal Localization
in S2 Cells (% Cells)
DTACC Mutations
1177-1308
1064-1308
DTACC 1177-1308-GFP α-Tubulin-mCherry Merge DTACC 1064-1308-GFP α-Tubulin-mCherry Merge
R1230E Y1231A K1235E N1246E QK1 183-4AE
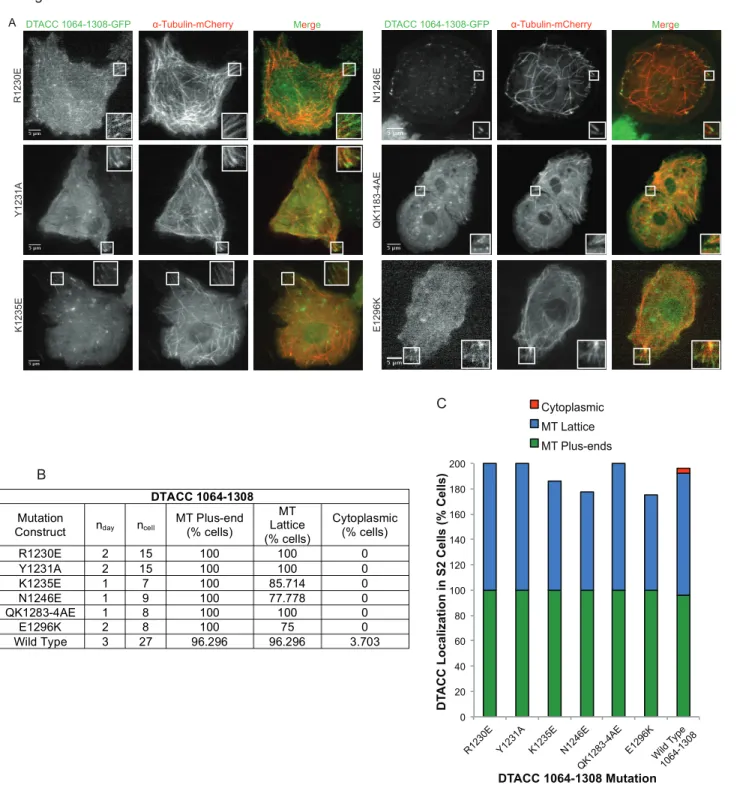
Figure 6. DTACC mutational analysis during mitosis. (A) Mitotic S2 cells transfected with the same mutant DTACC as in Figures 3-5. Representative images of each mutant construct in both 1177-1308 (A) and 1064-1308 (B). We observed and quantified (C) the ability of each mutant construct to localize to centro -somes during mitosis. (D) Graphical representation of data presented in (C). Most DTACC 1064-1308 mutants showed more robust localization to centrosomes than did the corresponding mutants in 1177-1308.
Figure 6 A B C D QK1 183-4AE N1246E K1235E Y1231A R1230E
DTACC 1177-1308 DTACC 1064-1308
Mutation
Construct nday ncell Localization (% cells) Centrosome nday ncell Localization (% cells) Centrosome
R1230E 2 6 18.18181 2 4 100
Y1231A 2 9 0 1 3 100
K1235E 2 3 33.3333 1 2 100
N1246E 3 7 100 1 3 100
(representative interphase images in Figure 5A). The cells for each 1064-1308 mutation were
scored according to the same guidelines as in 1177-1308, the data for which is in Table 5B. The
accompanying graph (Figure 5C) visually presents this MT localization data for each 1064-1308
mutation in comparison to WT DTACC 1064-1308.
Mitotic cells for each mutant construct (in both 1177-1308 and 1064-1308) were also
scored on the ability for their mutant DTACC to localize to centrosomes. Mitotic cells were rare
to find while imaging, so the five pairs of mutant constructs in Figure 6 represent those
constructs with enough mitotic cells to quantify (Table 6B) and clearly present (Figure 6C) their
mutant DTACC centrosomal localization patterns. Figure 6C shows a comparison of the effects
of each mutation on centrosome localization when it is directed to DTACC 1177-1308 and to
DTACC 1064-1308.
C. DTACC and Msps Interact Directly in Cells and in vitro
We not only hypothesize that DTACC’s interaction with Msps is mediated by its
coiled-coil, we also hypothesize that this interaction is direct and that the C-terminal domains of each
protein are sufficient for this interaction. I tested for this direct interaction in cell culture using a
KnockSideways system in S2 cells. I first transfected the cells with an exogenous, truncated
Msps-GFP c-terminal construct (residues 2042) to observe its localization. Msps
1596-2042-GFP was unremarkably cytoplasmic in these singly transfected cells (Figure 7A).
However, when I co-transfected S2 cells with both Msps 1596-2042-GFP and
mito-tRFP-DTACC 1064-1308 (genetically designed to be targeted to mitochondria), both Msps-GFP and
mito-tRFP-DTACC robustly and consistently co-localized to mitochondrial membranes (Figure
Figure 7
mito-tRFP-DTACC 1064-1308
Msps 1596-2042-GFP
Msps 1596-2042-GFP Merge B.
A.
250
130 100
70
55
35
25
M.W . (kDa)
Ladder DTACC-GST Load
Wash 1 Wash 2Wash 3 Msps LoadWash 1 Wash 2 Wash 3 Boil
DTACC 1064-1304-GST Msps 1596-2042
GST C.
To test the same DTACC-Msps interaction in vitro, I used a GST pull-down assay in
which I tested the ability of purified DTACC 1064-1304-GST to bind purified Msps 1596-2042
(Figure 7C). DTACC 1064-1308-GST was first conjugated to glutathione beads alone
(DTACC-GST Load, Figure 7C). After addition of Msps 1596-2042 (Msps Load, Figure 7C), three washes
removed any unbound Msps, as can be seen by the Wash 1-3 lanes (Figure 7C). After
denaturation of the beads by SDS and boiling, the DTACC-GST was unbound from the beads
and separated by SDS-PAGE (Boil, Figure 7C). DTACC 1064-1304-GST (M.W. = 53.8 kDa,
green arrow, Figure 7C) and Msps 1596-2042 (M.W. = 50.4 kDa, red arrow, Figure 7C) protein
bands are present in the boil lane, indicating that the Msps C-terminal domain (CTD) bound
directly to the bead-conjugated DTACC 1064-1304-GST.
Discussion
The concept that structure determines function is one of the most fundamental principles
in all levels of biology. This principle strongly applies to protein-protein interactions; it is not
possible to fully understand the role a protein plays in a cell or how it interacts with other
proteins without elucidating the structural basis of these functions. The MT cytoskeleton is no
exception to this principle; its structure is constantly undergoing rearrangements as MTs
dynamically cycle between phases of growth, pause, and shrinkage. It is this dynamicity that
affords MTs their functional versatility. Without the ability to reorganize, the MT lattice would
cease to perform its most essential functions of cell motility, intracellular transport, and
chromosome segregation.
Because MAPs contribute to the regulation of the MT lattice in cells, understanding the
their diverse and vitally important roles. The TACC family of MAPs is known to be essential for
proper MT spindle formation during mitosis (Raff et al., 2002), but the specific mechanism by
which it executes this function is still poorly understood. Its association with the well-studied
XMAP215 MT polymerase family has provided clues as to how it confers stability to the mitotic
spindle, but there is still little to no structural information on most of the TACC family, nor a
definitive structural mechanism for its interaction with XMAP215.
Characterizing the TACC domain function using structural methods was based on the
hypothesis that the DTACC TACC domain is a coiled-coil. The TACC domain in DTACC is the
only part of the protein that is sufficient to confer localization to MTs (Figure S2), and secondary
structure predictions indicate a high probability of coiled-coil formation in this domain.
Coiled-coils are formed by alpha helices, so I tested the alpha helical character of different truncations
of the TACC domain using CD (Figure 1). All three truncations (1064-1176, 1177-1304, and
1064-1304) all showed strong alpha helical character with CD minima at 208 and 222 nm
(Figure 1A,C,E). This supports the TACC domain coiled-coil hypothesis. However, the
temperature ramp CDs of each truncation construct revealed that neither 1177-1304 or
1064-1176 (Figure 1B,D) are as thermally stable as the full TACC domain (Figure 1F), this supports
the hypothesis that the entire TACC domain is responsible for stable coiled-coil formation.
Coiled-coil domains often confer homodimerization, so we also tested the tendencies of
the same three TACC domain truncations to homodimerize using SEC-MALS (Figure S4). Both
1064-1304 and 1177-1304 dimerized in vitro (Figure S4 A,C), whereas 1064-1176 remained a
monomer (Figure S4 B). In combination with the CD results, the SEC-MALS data suggest that
DTACC 1064-1304 forms a stable coiled coil dimer and that DTACC 1177-1304 forms a less
coiled coil by itself, but instead that these residues afford extra stability to the overall structure of
the entire TACC domain. Our structural characterizations of the Drosophila TACC coiled-coil
domain are consistent with recently published crystal structures TACC family members in other
species, including XTACC3 in Xenopus (Mortuza et al., 2014) and TACC3 in humans (Guo et
al. 2015). This consistency in alpha helicity and dimerizationin various homologues suggests
that the TACC domain coiled-coil structure, as well as its sequence, is conserved throughout
evolution.
The structural insights provided by the CD and SEC-MALS can be applied to DTACC’s
localization patterns in S2 cells. Our lab has previously shown that both DTACC 1064-1304 and
1177-1304 are sufficient to localize to MT plus-ends and to centrosomes, whereas DTACC
1064-1176 is not sufficient (Figure S2). These localization trends mirror the dimerization trends
for each respective DTACC construct, suggesting a link between DTACC’s ability to form
dimeric coiled-coils and its ability to localize to MTs and centrosomes. In addition, our lab has
also previously shown that DTACC’s localization to MTs is mediated by the presence of Msps
(Figure S1). Therefore, the CD and SEC-MALS results suggest that DTACC interacts with Msps
via a coiled-coil in its C-terminal TACC domain.
The hypothesis that DTACC forms and interacts with Msps through a coiled-coil domain
is also central to the in vivo mutational analysis in Figures 3-6. If DTACC does form a
coiled-coil dimer, then certain hydrophobic residues in the C-terminal alpha helices should be involved
in forming the DTACC dimerization interface, while other solvent-exposed residues should be
involved in forming the DTACC-Msps binding interface. The TACC family sequence
identity/homology alignment was used to identify conserved, charged residues (Figure S3, red
solvent-exposed surface of the putative coiled coil, and we tested this through individually ablating or
reversing these charges though mutation and observing the mutant DTACC’s localization
patterns during interphase (Figures 3-5).
Theoretically, mutating a charge reversal or ablation in DTACC’s putative coiled-coil
should not disrupt the formation of the coiled-coil, but should merely alter the distribution of
charge along the coiled-coil surface. Thus, if Msps binds DTACC’s putative coiled-coil through
a charge-specific mechanism, and an essential DTACC surface charge is reversed, Msps binding
to DTACC should weaken. If the DTACC-Msps binding is weakened, it should be evident in the
particular mutant construct’s localization to MT plus ends.
Not all mutations made to DTACC 1177-1308 had equal effects on DTACC’s ability to
localize to MT plus-ends (tip-track), as is shown in Figure 4B. Specifically, mutations made in
the region 1230-1246 severely ablated DTACC’s tip-tracking and lattice-binding abilities
(R1230E, Y1231A, K1235E, Q1241E, N1246E). Interestingly, it seems that a tyrosine to alanine
mutation (charge ablation and size reduction) at residue 1231 has a more deleterious effect on
tip-tracking than does a tyrosine to phenylalanine mutation (only charge ablation) at the same
residue. This suggests that a specific charge distribution along the putative coiled-coil’s surface
may not be the only factor conferring Msps binding. In addition, at residue 1235, a lysine to
glutamic acid (charge reversal) mutation is more deleterious to tip-tracking than a lysine to an
alanine (charge ablation and size reduction). This could suggest that electrostatic interactions
play a more important role in Msps binding than size of the residue or presence of charge.
We next selected a subset of the mutations made to 1177-1308 to test further by
introducing them into DTACC 1064-1308, the full TACC domain (Figure 5). The same
K1235E, N1246E; Figure 4B) all showed robust tip-tracking when present in the full TACC
domain (Figure 5C). The localization patterns of the mutants were, in fact, very similar to that of
the WT 1064-1308 construct. These stark differences in localization patterns of the same
mutations when present in two different DTACC constructs suggests that the additional residues
in the full TACC domain (residues 1064-1176) are sufficient to allow even a mutated DTACC
construct to tip-track when the TACC domain is not truncated. This observation mirrors the
structural observations from the SEC-MALS; namely, that residues 1064-1176 are not sufficient
to dimerize or tip-track alone, but still confer greater stability and function to the full TACC
domain. This suggests a structural link between DTACC’s dimerization and its interaction with
Msps. In addition, the results from our mutational analysis of mitotic cells (Figure 6) in both
DTACC 1177-1308 and 1064-1308 agree with the interphase analysis. Figure 6D suggests that
mutations that ablate DTACC centrosomal localization in 1177-1308 (R1230E, Y1231A,
K1235E) do not ablate centrosomal localization when present in DTACC 1064-1308.
Despite the high conservation of TACC and XMAP215 throughout species, the current
literature on the TACC family does not agree on the regions of TACC residues that interact with
XMAP215 (Hood et al., 2013; Thakur et al., 2014; Mortuza et al., 2014). In a similar fashion,
the Msps-interacting region in the Drosophila TACC homologue that our mutational analysis
identified (residues 1230-1246) does not agree with XMAP215-interacting regions in human
TACC3 (Hood et al., 2013; Thakur et al., 2014), X. laevis XTACC3 (Mortuza et al., 2014), or C.
elegans TAC-1 (Bellanger et al. 2007). Our results further suggest that while the interaction of
the TACC and XMAP215 families is conserved throughout evolution, the specific location of the
Despite providing key insights into the putative coiled-coil structure of the TACC
domain, our mutational analysis experiments do not illustrate any direct interaction between
DTACC and Msps. To examine more direct interactions between the two MAPs, I have begun to
develop a combination of cell culture and biochemical techniques to more directly assay the
DTACC-Msps interaction. The DTACC-Msps KnockSideways experiment (Figure 7A,B) shows
that mito-DTACC 1064-1308 construct can pull Msps 1596-2042 (the C-terminal domain) to
mitochondria. The main limitation of this assay is that it is in cell culture, and cannot show
definitively that these DTACC and Msps constructs are directly binding to each other, rather
than through some intermediate or in a larger complex.
To supplement this KnockSideways experiment, I have used GST pull downs with the
same Msps and DTACC constructs as in cell culture to show that the two purified constructs can
directly bind in vitro (Figure 7C). While I have not yet purified or cloned the various DTACC
and Msps constructs necessary to test more specific combinations of DTACC/Msps constructs,
this KnockSideways/Pull Down system will be eventually combined with my DTACC
mutational constructs to more directly assay for ablation of Msps binding. This in vitro/cell
culture system will be more accurate at determining the competence of the direct DTACC-Msps
interaction than the indirect method of analyzing DTACC’s tip-tracking abilities in cell culture
alone.
Ultimately, the insights into the TACC domain gained by the combination of CD,
SEC-MALS, and mutational analysis are not definitive structural characterizations. These biochemical
and cell biological results would be invaluable supplements to a crystal structure of the TACC
domain. Figure 2 shows my preliminary attempts to crystallize DTACC 1064-1304 using
irregularly shaped and likely unsuitable for X-ray crystallography. More optimization is needed
to obtain more uniform and repeatable crystals, both in the protein purification and
crystallization processes. The lack of structure in all but the most recent literature attests to the
difficulty of any definitive structural characterization of TACC family members, as the only
results have been produced by low-resolution small-angle X-ray scattering (SAXS) (Mortuza et
al., 2014) or by complexing TACC proteins to unnatural binding partners to confer
crystallization (Guo et al., 2015).
The overall lack of structural information on DTACC and the DTACC-Msps interaction
prevents us from definitively understanding how DTACC functions as a centrosomal regulator of
MTs during mitosis. The truncational and mutational experiments to the DTACC TACC domain
have provided support for the coiled-coil structure of the DTACC TACC domain, as well as its
putative role in mediating Msps binding through conserved charged residues. These experiments
will ultimately contribute to our understanding of the interactions of the entire TACC and
XMAP215 protein families, and how they participate in the fidelity of the mitotic bipolar spindle
reorganization and stabilization.
Acknowledgements
I would like to thank my thesis advisor, Dr. Kevin Slep, as well as my two graduate student
mentors, Dr. Jaime Fox and Rebecca Adikes, for their guidance during this research project and
throughout my undergraduate career. I would also like to thank Dr. Ashutosh Tripathy at UNC
Literature Cited
Albee, A.J. and Wiese, C. (2008) Xenopus TACC3/Maskin Is Not Required for Microtubule Stability but Is Required for Anchoring Microtubules at the Centrosome. MBOC19, 3347-3356.
Booth, D.G, Hood, F.E., Prior, I.A., and Royle, S.J. (2011) A TACC3/ch-TOG/clathrin complex stabilises kinetochore fibres by inter-microtubule bridging. EMBOJ. 30, 906-919. Bellanger, J.M., and Gönczy, P. (2003) TAC-1 and ZYG-9 Form a Complex that Promotes
Microtubule Assembly in C. elegans Embryos. Curr. Bio.13, 1488-1498.
Bellanger, J.M., Carter, J.C., Phillips, J.B., Canard, C., Bowerman, B., and Gönczy, P. (2007) ZYG-9, TAC-1 and ZYG-8 together ensure correct microtubule function throughout the cell cycle of C. elegans embryos. J. Cell Sci.120 (16) 2963-2973.
Gergely, F., Karlsson, K., Still, I., Cowell, J., Kilmartin, J., and Raff, J.W. (2000) The TACC domain identifies a family of centrosomal proteins that can interact with microtubules. PNAS97, 14352-57.
Glover, D.M., Gonzales, C., and Raff, J.W. (1993) The Centrosome. Sci. Am. 268, 62-68. Guo, Y., Scheuermann, T.H., Partch, C.L., Tomchick, D.R., and Gardner, K.H. (2015) Coiled
coil Coactivators Play a Structural Role Mediating Interactions in Hypoxia Inducible Factor Heterodimerization. JBC, M114.632786.
Hood, F.E., Williams, S.J., Burgess, S.G., Richards, M.W., Roth, D., Straube, A., Pfuhl, M., Bayliss, and Royle, S.J. (2013) Coordination of adjacent domains mediates TACC3-ch-TOG-clathrin assembly and mitotic spindle binding. JCB202 (3), 463-78.
Mortuza, G.B., Cavazza, T., Garcia-Mayoral, M.F., Hermida, D., Peset, I., Pedrero, J., Merino, N., Blanco, F.J., Lyngsø, J., Bruix, M. Pedersen, J.S., Vernos, I., and Montoya, G. (2014) XTACC3-XMAP215 association reveals an asymmetric interaction promoting
microtubule elongation. Nat. Comm. 5.
Peset, I., and Vernos, I. (2008) The TACC Proteins: TACC-ling Microtubule Dynamics and Centrosome Function. Trends In Cell Bio. 18 (8), 379-88.
Raff, J.W. (2002) Centrosomes and Cancer: Lessons from a TACC. Trends In Cell Bio. 12 (5), 222-25.
Still, I.H., Vince, P., and Cowell, J.K. (1999) The third member of the transforming acidic coiled coil containing gene family, TACC3, maps in 4p16, close to translocation breakpoints in multiple myeloma, and is upregulated in various cancer cell lines. Genomics58, 165 170.
Shirasu-Hiza, M., Coughlin, P., and Mitchinson, T. (2003) Identification of XMAP215 as a microtubule-destabilizing factor in Xenopus egg extract by biochemical purification. JCB
161 (2), 349-58.
Thakur, H.C., Singh, M., Nagel-Steger, L., Kremer, J., Prumbaum, D., Fansa, E.K., Ezzahoni, H., Nouri, K., Gremer, L., Abts, A., Schmitt, L., Raunser, S., Ahmadian, M.R., and Piekorz, R.P. (2013) The Centrosomal Adaptor TACC3 and the Microtubule Polymerase chTOG Interact via Defined C-terminal Subdomains in an Aurora-A Kinase-independent Manner. JBC289, 74-88.
Supplementary Figures
DTACC 1064-1308-GFP α-Tubulin-mCherry Merge
DT
ACC RNAi
Msps/DT
ACC RNAi
Scale bars represent 2 μm
Figure S1
C DT ACC 1064-1308 DT ACC 1177-1308
DTACC-GFP α-Tubulin-mCherry Merge
C. The regions of DTACC that interact and track with MT plus-ends during interphase (1064-1308 and 1177-1308, shown in A and B above), also localize to centrosomes and kinetochore fibers during mitosis.
Scale bars represent 2 μm
A
A.Truncations of FL DTACC were made to test the ability of the N-terminal region (1-1063) and the C-terminal region (1064-1308) to localize to MT plus-ends in cell culture. GFP-tagged constructs were co-transfected into Drosophila S2 cells with an α-Tubulin m-Cherry construct. The DTACC N-terminal region alone does not localize to MT plus-ends (row 1). The C-terminal region localizes to MT plus-ends (row 2). All truncation constructs were designed and tested by Dr. Jaime Fox and Rebekah Shaw.
DTACC-GFP α-Tubulin-mCherry Merge
DT ACC 1-1063 DT ACC 1064-1308 DT ACC 1064-1 176 DT ACC 1 177-1308
DTACC-GFP α-Tubulin-mCherry Merge
B. To determine which region of the TACC domain is sufficient for MT plus-end localization, our lab generated TACC domain truncation constructs. Residues 1064-1176 did not localize to MT plus-ends (row 1) while 1177-1308 localized to and tracked along MT plus-ends (row 2), revealing a subfrag -ment of the C-terminal domain that interacts (either directly or indirectly) with Msps in cell culture.
B
DTACC D. melanogaster TACC3 H. sapiens TACC3 M. musculus TACC3 G. gallus TACC3 X. laevis TACC3 D. rerio TACC S. purpuratus TAC-1 C. elegans TACC D. fasciculatum Alp-7 S. pombe
DTACC D. melanogaster TACC3 H. sapiens TACC3 M. musculus TACC3 G. gallus TACC3 X. laevis TACC3 D. rerio TACC S. purpuratus TAC-1 C. elegans TACC D. fasciculatum Alp-7 S. pombe
DTACC D. melanogaster TACC3 H. sapiens TACC3 M. musculus TACC3 G. gallus TACC3 X. laevis TACC3 D. rerio TACC S. purpuratus TAC-1 C. elegans TACC D. fasciculatum Alp-7 S. pombe
...1070...1080...1090...1100... .1110...1120...1130...1140...1150...
.1160...1170...1180...1190...1200...1210...1220...1230...1240...1250...1260
...1270...1280...1290...1300.. ..
MSVDVIDNDCNKTFDNSNTNTEDKTHNYNDMDELEKKIKNEVTRS---EDIEKKLKEGELREEALIKRITEKDKTNAKLNGVIEAYEKAIAELISEKE ---PPGVPAPGGPPLSTGPIVDLLQYSQ---KDLDAVVKATQEENRELRSRCEELHGKNLELGKIMDRFEEVVYQAMEEVQ ---PLCVLEPRGLLPAEPIVDVLKYSQ---KDLDAVVNVMQQENLELKSKYEDLNTKYLEMGKSVDEFEKIAYKSLEEAE SLARDVSPLPFTASTNAAVDAIIDVLKYSQKDMDAAV---ELVKREVQEKELEALEWKKKYNKLHMEYKEMGKVVAEFEGTITQMMEDSQ LIVDAPSSVAVPNPFLSTSDAIVEMLKYSQKDMDAAI---EAVRLEVQEKDLEVLEWKTKHEKLYLEYVEMGKIIAEFEGTITQILEDSQ DPTVLDLLVPALKPPVRTEDSIIEVLKYSQKDMDAAL---QKADRQSEERQQEL---KSQIEKLQLENQQMLFIMSEFETTITQITDEHK ANSSTEIPSSVPQTVTSSDEGIVQILRYSQADMDAAVLEAARSASIEAQRVAEEKYKEYEKKFHSSNENIKEVTKSKEVLEKSSSDMRALIMEYEKSIQQLMVDVS ---PPPSGYAIYSQ---EDVDRMMETLKKDI--LKQCSDESAIVAFELEDIQVKYDKEVRNCSS-LR ---KYTQ---EEVDKLIQERMEKV---QQAQLHERQLQEVQADRDANYHHLTSLETTFSDLHVKYEKSKEMTSQLKSNEESLLAERKQMMDNLRLQEQRYDKMKNHAMQQLEIANKKLDTYSREHADETK ---KQKELSKAEIQKVLKEKDQLTTDLNSMEKSFSDLFKRFEKQKEVIEGYRKNEESLKKCVEDYLARITQEGQRYQALKAHAEEKLQLANEEIAQVRSKAQAEAL KQRELKEIAEDKIQKVLKERDQLNADLNSMEKSFSDLFKRFEKRKEVIEGYQKNEESLKKYVGECIVKIEKEGQRYQALKIHAEEKLRLANEEIAQVHSKAQAEVL ---KQKELSKKEIQRMVEEKQQVISDLNSMEKSFSELFKRFEKQKEVLEGYRKNEEALKKCAEEYLARIKKEEQRYQALKAHAEEKLHQANEEIAQVRNKAKSETA ---RQKETAKLELNKVLQEKQQVQVDLNSMETSFSELFKRLEKQKEALEGYRKNEEALKKCVEDYLVRIKKEEQRYQALKAHAEEKLNRANEEIAHVRSKAKSEAT ---QKEALAKMEMERVLEEKDQLAKDLNELERSFSSVVKRLDRCKEVIEGFKKNEETLKQYAKNCMDRLQKEEKRYQALKAHAEEKLEQANKAIAEVRTKQGAEVA ---QAKTSSDDKASQLQKEKDQALEDMASVESAFSDLHRRYEKLKQTLDGYRKNEETLKKHVTEYQGKVKKQEQRYQTLKSHAEEKIEKANEQITKVTKSYQSEIA ---SSEELEKALKDRDAARAEADKLHANYATLFASFNTVREAANDIRGEYEDARDKLKLAAAEVDEWQAKFLAVKDNANSELERASVEYDDLLRSHDENTK ---NMLAHYESTMKKMIEQPAPSHQNTQKLQEALVD---NDRLRKENHELKESNAQLNKDVQLHVSRFGALKAHAEQKLDSASEQLTKLKEVAAKEVA ---AEDLHAQYSAKHTQKINAFKANYARKYEATIQELQNQIGTAPNAPKISNSNWEEERRALKADNQTLQKQLEKAIQERQDMSDFLNNFKADMAKSDKLLMQQQS KLKALLKKEEISRVSMTEQLQQKSRENADLLKICEELIYGKGQGG---SS ALQASLRKEQMRIQSLEKTVEQKTKENEELTRICDDLISKMEKI--- ALQASLRKAQMQNHSLEMTLEQKTKEIDELTRICDDLISKMEKI--- ALQASLRKEQMRIQSLERSLEQKTKENDELTKICDDLILKMGKNG--- ALQATLRKEQMKIQSLERSLEQKSKENDELTKICDDFILKMEKI--- ALQVQLKREQLKVQSLEKDLEQKAKEVKDVTELCDELLLKVQKHG----F---- GLTANLKREQMNVEGLEKTIQQKTKQCGELTNICDELISKMGSSG----Q----GLRLRVKRQEIELSSKNDEIKVLTNRVSELSQICDQLLNDVDVSDGMSVISTDA VLNAKLSKSEYKLQAKE---RENEELAKLCDELIFKLQKNS---QQTGDLETLRLQLQALQEELRVEREERQQLIQMSEDLVIAMDQLN----LEQKS Figure S3
A.
Time (min)
Molecular
W
eigh (kDa)
Rayleigh Ratio (relative units)
75 60 45 30 15 0 0 0.2 0.4 0.6 0.8 1.0
16 20 24 28 32 36
54.8 59.4 24.5 15.6 1064-1304 Time (min) Molecular W eigh (kDa)
Rayleigh Ratio (relative units)
75 60 45 30 15 0 0 0.2 0.4 0.6 0.8 1.0
16 20 24 28 32 36
1064-1176 B. 14.5 Time (min) Molecular W eigh (kDa)
Rayleigh Ratio (relative units)
75 60 45 30 15 0 0 0.2 0.4 0.6 0.8 1.0
16 20 24 28 32 36
C.
1177-1304
28.8 Figure S4