Original Article
Analysis of bladder cancer tumor CpG methylation and
gene expression within The Cancer Genome Atlas
identifies
GRIA1
as a prognostic biomarker
for basal-like bladder cancer
Sloane K Tilley1, William Y Kim2, Rebecca C Fry1,3
1Department of Environmental Sciences and Engineering, Gillings School of Global Public Health, The University
of North Carolina, Chapel Hill, NC, 27599, USA; 2Lineberger Comprehensive Cancer Center, University of North
Carolina at Chapel Hill, Chapel Hill, North Carolina 27514, USA; 3Curriculum in Toxicology, The University of North
Carolina, Chapel Hill, NC, 27599, USA
Received February 24, 2017; Accepted March 6, 2017; Epub September 1, 2017; Published September 15, 2017
Abstract: Increased methylation levels at cytosines proximal to guanines (CpG) in the promoter regions of tumor suppressor genes have been reported to play an important role in the development and progression of bladder cancer. In this study, we conducted a genome-wide analysis using data from The Cancer Genome Atlas to better characterize CpG methylation and mRNA expression patterns in urothelial carcinomas and to identify new
epigen-etic biomarkers of survival. Across 408 tumors, we identified 223 genes that displayed significant relationships
between CpG methylation and mRNA expression levels. Hypermethylation within 200 base pairs upstream of the transcription start site and hypomethylation within the 3’ untranslated region and body region were associated with gene silencing. These 223 genes were functionally enriched for their role in glutamate receptor signaling and among them was a novel, tumor-stage-independent epigenetic biomarker of overall mortality, GRIA1. GRIA1
hypermethyl-ation and elevated mRNA expression levels were associated with significantly worse survival outcomes in patients
with basal-like urothelial carcinomas. Furthermore, 70 genes associated with glutamate receptor signaling were differentially expressed between basal (n = 203 tumors) and luminal (n = 205 tumors) subtypes of bladder cancer, including genes involved in glutamate receptor-mediated activation of the calmodulin, PI3K/Akt, and EGFR signal-ing pathways. The majority of genes displayed increased expression levels in basal-like subtypes. This research highlights glutamate receptors as targets for investigation in the development and pharmacological treatment of urothelial cancer.
Keywords: Bladder cancer, CpG methylation, epigenetics, glutamate receptors, The Cancer Genome Atlas
Introduction
Urothelial bladder carcinoma is a highly preva-lent cancer in the United States, and its inci-dence is on the rise [1]. As the public health burden from this cancer increases, better understanding of the biological mechanisms underlying its etiology is critical [2]. Mechanis-
tic studies have identified several biological
pathways that may be targeted in the develop-ment of these cancers, and genetic analyses
have identified somatic mutations in multiple
genes that are associated with bladder cancer tumors [2, 3]. Research has also implicated that epigenetic mechanisms play a key role in bladder carcinogenesis, and
chromatin-modify-ing genes are frequently mutated in bladder cancer [2, 4].
Methylation of cytosines proximal to guanines (CpG) is an epigenetic mechanism that is known to be involved in carcinogenesis [5]. Large clus-ters of CpG sites, CpG islands, are often found in the promoter regions of genes [6]. In tumors, global hypomethylation has been implicated in a loss of cell cycle control and other cellular pro-cesses, thus leading to malignant growth [2]. In some instances, increases in CpG methylation in promoter regions of genes have been associ-ated with gene silencing [5]. Numerous studies
have identified genes that display promoter
in [7]), although few studies report correspond-ing gene expression levels, and recent research has implicated that methylation in other regions of the gene may play an important role in epi-genetic regulation [5, 6, 8].
In this study, we aimed to better characterize
the epigenomic profiles of CpG methylation in
urothelial bladder tumors across all intragene regions and to identify functional epigenetic biomarkers of bladder cancer. Therefore, meth-ylation and mRNA expression data sets from The Cancer Genome Atlas (TCGA) were ana-lyzed to identify genes that are both differen-tially expressed and methylated in bladder
can-cer and that display a significant relationship
between CpG methylation and mRNA expres-sion levels.
Materials and methods
Data acquisition
All available data files from Infinium
Human-Methylation 450 BeadChip arrays (n = 440) were downloaded from the TCGA and were read into SAS V9.3 [9]. Data were merged on probe
identifier, and, for quality control purposes,
probes where approximately 1% of the data were missing were removed. Data were log-transformed and probes corresponding to sin-gle nucleotide polymorphism (SNPs) were
removed [10]. The final data set consisted of n
= 412 methylation arrays of genome-wide DNA methylation for tumor tissue and n = 21 meth-ylation arrays of genome-wide DNA methmeth-ylation for non-tumor tissue, each containing 332,950 genomic sites.
All available RNASeqV2 normalized count data
files (n = 427), each containing data across
20,531 genes, were downloaded from the TCGA. These data were normalized using the RSEM method by the TCGA [11]. Data were then imported into SAS V9.3 and normalized count values were summarized by gene. There
were 408 data files that corresponded to tumor samples and 19 data files that corresponded to
non-tumor samples. Gene expression levels across all samples for each gene were log-transformed, as in prior publications from the TCGA [12].
All available clinical data files (n = 417), each
containing 54 variables from bladder cancer
tumors were downloaded from the TCGA. These included demographic factors, including sub-ject sex (male vs. female), age at initial diagno-sis (continuous variable), tumor pathologic sub-type (papillary vs. non-papillary), smoking sta-tus (ever vs. never), and race (white vs. non-white), and clinical data, such as the American Joint Committee on Cancer (AJCC) tumor patho-logic stage and days until death. Of the 408 subjects that had both CpG methylation and RNASeq data available for tumor samples, 381
also had clinical data files.
Identifying differentially expressed genes (DEGs) between urothelial tumor and non-tumor tissue
All possible subjects were identified that had
RNASeq data available for matched tumor and non-tumor tissue (n = 19). Individual fold chang-es (FC) were calculated using the log-trans-formed values in the formula FC = RNASeq value (tumor)/RNASeq value (non-tumor) for each subject across all genes available for analysis and the median FC per gene was cal-culated across subjects. In addition, ANCOVA of the log-transformed RNASeq values across the 20,531 genes was conducted contrasting on tumor vs. non-tumor tissue, controlling for sex, age at initial diagnosis, pathologic subtype, smoking status, and race. FDR (false discovery rate) q-values were computed. DEGs were
defined by the following criteria: (i) FDR q-value
< 0.05 and (ii) the median absolute FC for the gene between tumor and non-tumor tissue
across all matched subjects was ≥ |2.0|.
Identifying differentially methylated genes (DMGs) between urothelial tumor and non-tumor tissue
Subjects were identified that had DNA methyla
-tion data available for matched tumor and non-tumor tissue (n = 21). ANCOVA analysis of the DNA methylation beta-values across all CpG sites was conducted contrasting on tumor vs. non-tumor tissue controlling for sex, age at ini-tial diagnosis, pathologic subtype, smoking sta-tus, and race. FDR q-values were computed.
The Infinium HumanMethylation 450 BeadChip
(TSS200), (iii) in the 5’ untranslated region of
the gene (5’ UTR), (iv) in the first exon of the
gene (1st Exon), (v) in the body of the gene (Body), and (vi) in the 3’ untranslated region of the gene (3’ UTR) [13]. Individual differ-ences were calculated using the formula beta-difference = beta-value (tumor) - beta-value (non-tumor) for each subject across all CpG sites available for analysis and the median beta difference per gene was calculated across sub-jects across all CpG sites associated with a gene and within each of the six intragene sites.
DMGs were defined by the following criteria: (i)
at least one probe associated with the gene had a FDR q-value < 0.05 and (ii) the median beta difference across all CpG sites associated with a gene or at least one of the intragene sites between tumor and non-tumor tissue
across all matched subjects was ≥ |0.10|, rep
-resenting a 10% difference in methylation, as this methylation difference threshold resulted in approximately a 95% true positive rate using the beta-value method of detecting differences in CpG methylation values [14]. Permutation testing using R was used to test if the number of genes hypermethylated versus hypomethyl-ated in the promoter regions (TSS1500 and TSS200) in tumor versus non-tumor tissue dif-fered from a pure 0.5 probability of methylation directionality.
Identifying genes demonstrating a significant relationship between CpG methylation and mRNA expression in urothelial tumor tissue
In order to identify genes whose expression was associated with methylation levels in tumors, Spearman rank correlations were run on all genes that were both differentially meth-ylated and expressed between tumor and non-tumor tissue. Individual median methylation values for all CpG sites associated with a gene and for the six intragene regions were calculat-ed for all individuals who had both methylation and RNASeq tumor data available (n = 408). In separate analyses, these methylation values were log-transformed and then tested via Spearman rank analysis with the individuals’
log-transformed RNASeq values. A significant
relationship between CpG methylation and
mRNA expression was defined as a Spearman
rank correlation p-value < 0.05. In order to inte-grate these three analyses, we determined that genes that met the following criteria could serve as potential epigenetic biomarkers of bladder carcinogenesis: (i) differentially expre-
ssed between matched tumor and non-tumor tissue, (ii) differentially methylated between matched tumor and non-tumor tissue, and (iii)
displayed a significant association between
CpG methylation and mRNA expression in tumor tissue.
Network analysis of potential epigenetic bio-markers of urothelial cancer
In order to examine the higher-level biological
processes related to the genes identified as
both differentially methylated and expressed between bladder cancer tumor and non-tumor
tissue and with a significant relationship
be-tween CpG methylation and gene expression in tumor tissue, we analyzed these genes in Ingenuity Network Analysis (IPA) (Ingenuity Systems®, Redwood City, CA, USA). Canonical
pathways were identified as enriched using the right-tailed Fisher’s Exact test, where signifi -cance was set at p-value < 0.001 [15].
Assessment of prognostic potential of epigen-etic biomarkers in urothelial tumors
ANCOVA was used as an initial screen to
iden-tify specific genes among the 223 that were dif
-ferentially methylated and expressed among survivors and non-survivors of bladder cancer. ANCOVA of the log-transformed RNASeq values across the 223 genes and of the log-trans-formed median CpG methylation beta-values of all differentially methylated regions (DMRs) associated with gene expression was per-formed, contrasting on survival status in the 408 bladder cancer tumors, controlling for sex, age at initial diagnosis, pathologic subtype, smoking status, and race. Genes that were dif-ferentially expressed and methylated between survivors and non-survivors at an alpha level of 0.10 were further analyzed using Kaplan-Meier analysis with log-rank statistics. For genes
sig-nificant in Kaplan-Meier analysis, a Cox regres
-sion model was run, with AJCC Pathologic Tumor Stage incorporated as a co-predictor of survival. For both analyses, subjects were
strat-ified into two groups of (i) mean - SD and (ii)
mean + SD based on CpG methylation or gene
expression level and significance was defined
as p-value < 0.05.
Validation of a prognostic epigenetic biomark-er in an independent cohort
expression levels originally reported in Choi et al. 2014 were obtained from the Gene Ex- pression Omnibus (GSE48277) (n = 146) [16]. As the sample size of this cohort was approxi-mately one-third the size of the TCGA cohort,
individuals were stratified into two groups of mean ± [SD]/2, in order to have a sufficient number of individuals within each stratification
group. Kaplan-Meier analysis with log-rank sta-tistics was used to test for differences in sur-vival. A Cox regression model was used to test if observed differences were independent of AJCC Pathologic Tumor Stage. For both
analy-ses, significance was defined as a p-value < 0.05.
Analysis of the prognostic potential of an epigenetic biomarker in basal and luminal subtypes of urothelial tumors
In order to elucidate potential biological roles of
the identified epigenetic prognostic biomarker, we tested if this gene had significantly different
expression and methylation levels in basal- versus luminal subtypes of bladder cancer. Methodology of tumor subtyping is described in detail elsewhere [17]. ANCOVA of the formed RNASeq values and of the log-trans-formed median CpG methylation beta-values of
the significant prognostic intragene region was
performed, contrasting on basal (n = 203) ver-sus luminal (n = 205) subtype, controlling for sex, age at initial diagnosis, smoking status, and race. Tumor pathologic subtype and tumor stage were not controlled for in this analysis as it is likely correlated with basal and luminal
sub-type classification. The median FC and median
beta difference of the log-transformed RNASeq values of the gene and of the log-transformed median CpG methylation beta-values of the
sig-nificant prognostic intragene region were also
calculated between basal and luminal subtypes of urothelial cancers. Then, the prognostic power of mRNA expression and CpG
methyla-tion levels of the identified gene was assessed
separately in basal and luminal subtypes using Kaplan-Meier analysis with log-rank statistics independently among the basal and luminal subtypes. Cox regression models were used to test if observed differences were independent of AJCC Pathologic Tumor Stage. For all
analy-ses, subjects were stratified into two groups of
(i) mean - SD and (ii) mean + SD based on CpG methylation or gene expression level, and
sig-nificance was defined as p-value < 0.05.
Assessment of DEGs between basal and lumi-nal subtypes of urothelial cancer
To assess whether there is a difference in glu-tamate receptor signaling in basal-like versus luminal-like bladder cancers, we tested for dif-ferential expression between basal and luminal subtypes of bladder cancer in a total of n = 1,776 genes associated with glutamate recep-tor signaling. ANCOVA of log-transformed RNASeq values was performed, contrasting on basal versus luminal subtype in the 408 blad-der cancer tumors, controlling for sex, age at initial diagnosis, smoking status, and race. Tumor pathologic subtype was not controlled for in this analysis as it is likely correlated with
basal and luminal subtype classification. FDR
q-values were generated to control for multiple
tests. Significance for DEGs was defined as a
FDR q-value < 0.05 and a median FC (basal/
luminal) ≥ |2.00|.
Results
Gene expression and CpG methylation dif-ferences between urothelial tumor and non-tumor tissue
A total of 413 DEGs were identified between
matched tumor and non-tumor tissue samples (n = 38) (Figure 1). The majority of genes (261/ 413 = 63.2%) displayed decreased expression in tumor tissue versus non-tumor tissue, while 152/413 (36.8%) displayed increased expres-sion in tumor versus non-tumor tissue.
A total of 7,421 genes were significantly differ -entially methylated between tumor and tumor tissue between matched tumor and non-tumor tissue samples (n = 42) (Figure 1). This high number of DMGs observed between tumor and non-tumor tissue in this analysis has also been described in other types of cancer [18, 19]. Of these 7,421 genes, 2,666 (35.9%) had a median beta difference across all CpG probes
≥ |0.10|, representing a 10% increase or
decrease in methylation in the entire gene. In further analyses of these data by intragene region, the TSS1500 and TSS200 regions, which are predicted to contain gene promoters, comprised 3,081 (41.5%) and 2,054 (27.7%) DMGs, respectively. Furthermore, 631 (20.5%) genes in the TSS1500 region and 696 (33.9%) genes in the TSS200 regions were hypermeth-ylated. Permutation testing revealed that this
was significantly fewer hypermethylated genes
than would be expected to result from chance alone in both the TSS1500 and TSS200 regions (p-values < 0.0001), a surprising result as pro-moter CpG hypermethylation is often discussed in the context of bladder carcinogenesis [7, 20, 21]. Some known tumor suppressor genes were hypermethylated in their promoter regions in tumor versus non-tumor tissue, including
DBC1, PAX6, RUNX3, and WT1, although these
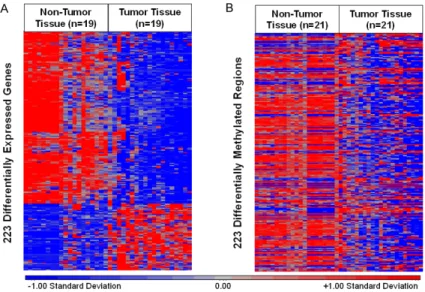
relationship between DNA methylation and gene expression. The majority of these genes (n = 161, 72%) were decreased in expression in tumor tissue versus non-tumor tissue (Figure 2A). Interestingly, only 69 genes (31%)
dis-played significant promoter-associated hyper
-methylation. In addition, 160 (72%) DMRs that displayed the strongest correlation with gene expression for each gene in tumor tissue dem-onstrated a loss of methylation in tumor versus non-tumor tissue. An inverse relationship between mRNA expression levels and CpG methylation levels was not observed among these samples (Figure2B).
Further analysis of these patterns by intragene
locality revealed several interesting findings.
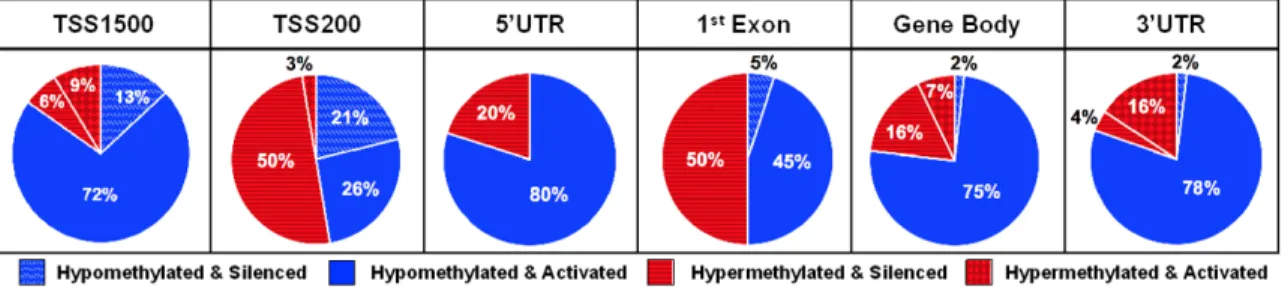
First, a consistent trend in gene suppression via promoter hypermethylation was observed in the TSS200 region, but not in the TSS1500 region. These results suggest that proximal promoter hypermethylation (e.g. TSS200) may have a greater role in cancer-associated gene silencing than hypermethylation at more distal nucleotides (e.g. TSS1500). Second, the major-ity of hypomethylated DMRs in the TSS1500, 5’ UTR, gene body, and 3’ UTR regions displayed gene activation (Figure 3). These results sup-port that intragene location of methylation is a critical determinant of gene expression.
Figure 2. A. A total of 223 DEGs in n = 19 matched controls and cases. Red indicates relatively higher expression. Blue indicates relatively lower expres-sion. B. A total of 223 DMRs with strongest correlation to gene expression in n = 21 matched non-tumor and tumor tissues. Red indicates relatively higher levels of methylation. Blue indicates relatively lower levels of methylation.
methylation changes were not associated with decreases in gene expression. Others, such as BRCA1, PTEN, TP53, and RB1 were not present among the DMGs. There were 261 genes that overlapped between the lists of DMGs and DEGs (Figure 1).
CpG methylation is associ-ated with mRNA expression in urothelial tumor tissue
An association measure was calculated between CpG me- thylation and mRNA expres-sion for the 261 DMGs and DEGs to assess whether CpG methylation in tumor tissue had a functional effect on mRNA expression. Of the 261 overlapping DMGs and DEGs,
Genes epigenetically dysregulated in urothelial tumors are associated with glutamate receptor signaling
In order to examine the function of these 223 genes, they were analyzed for enriched canoni-cal pathways (Table 1). The most significantly
enriched canonical pathway was glutamate
receptor signaling. The seven genes identified
in this pathway included CALML5, GRIA1,
GRIK3, GRIN2A, GRM4, GRM7, and SLC1A6.
Three genes, namely CALML5, GRM4, and
SLC1A6,displayed increased expression levels
in tumor tissue. GRIA1, GRIK3, GRIN2A, and
GRM7 displayed decreased expression levels
in tumor tissue.
GRIA1 is prognostic indicator of overall sur-vival independent of tumor stage
To further explore the functional significance of
the 223 DMGs and DEGs, all genes were
ana-lyzed for prognostic significance of overall
patient survival and potential targets were vali-dated in an independent cohort of urothelial tumors (n = 146) [16]. Analysis of all 223 genes revealed one gene whose CpG methylation and
mRNA expression levels displayed significant
relationships to overall survival independent of
tumor stage. Specifically, it was found that
increased mRNA expression levels of GRIA1
and increased CpG methylation in the TSS1500
region were significantly associated with overall
mortality in bladder cancer tumors (Figure 4A
and 4B). These findings remained significant
when tumor stage was included as a co-predic-tor of mortality (Wald chi-squared p-values = 1.34e-3; 1.05e-2, respectively). Tumor grade was not assessed as a co-predictor as all tumors were high-grade urothelial bladder
tumors. These findings are supported by the significant positive correlations observed
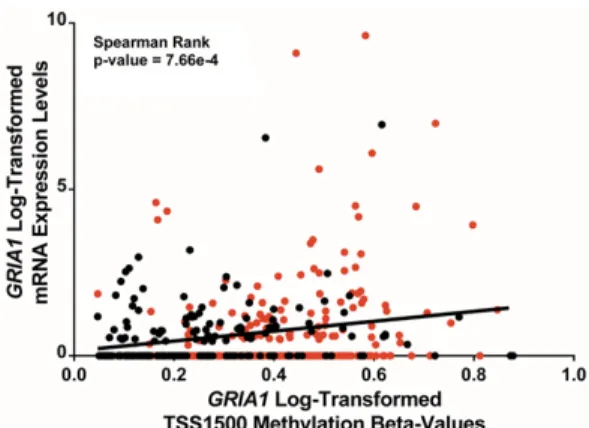
am-ong tumor tissues between GRIA1 TSS1500 CpG methylation and mRNA expression values among tumors. However, GRIA1 was found to be both hypomethylated in the TSS1500 region and decreased in expression in tumor versus non-tumor tissue (TSS1500 Median Beta Difference = -0.24; RNASeq FC = -2.51). GRIA1 TSS1500 methylation levels were significantly
correlated with GRIA1 expression levels, sug-gesting that hypermethylation of the TSS1500 region may activate GRIA1 mRNA expression (Figure 5). To note, a fraction of the samples displayed low-level expression of GRIA1. These
findings underscore the complex relationship
between CpG methylation and mRNA expres-sion patterns in tumor tissue. Both GRIA1
TSS1500 methylation levels and GRIA1 mRNA levels are novel biological endpoints associat-ed with mortality in bladder cancer patients.
Figure 3. Intragene regional distribution of hypo- and hypermethylation of DMRs and DEGs and directionality of CpG methylation and mRNA expression correlation among TCGA urothelial tumors (n = 408).
Table 1. Canonical pathways enriched among N = 223 DMGs and DEGs
Canonical Pathways Value Associated GenesP
-Glutamate Receptor Signaling 1.29e-6CALML5, GRIA1, GRIK3, GRIN2A, GRM4, GRM7, SLC1A6
Transcriptional Regulatory Network in Embryonic Stem Cells 2.29e-6CDX2, FOXD3, ISL1, LHX5, OTX1, SIX3
cAMP-Mediated Signaling 1.12e-5ADRB3, CALML5, CHRM2, CNGA3, GPR17, GRM4, GRM7, HTR1B, PDE1C,
SLC1A6, TULP2, VIPR2
G-Protein Coupled Receptor Signaling 3.24e-4ADRA1D, ADRB3, CHRM2, GPR17, GRM4, GRM7, HTR1B, PDE1C, TULP2, VIPR2
Validation of GRIA1 mRNA levels as a prognos-tic indicator of overall survival independent of tumor stage
The prognostic significance of increased GRIA1
mRNA expression levels in predicting overall survival of patients with bladder cancer tumors
was confirmed using data from an independent
cohort of 146 tumors published in a previous study by Choi et al. 2014 (Figure 6) [16]. In a
Cox regression analysis, the association was
also confirmed to be independent of tumor
stage (p-value = 2.98e-2).
GRIA1 prognostic power is specific to basal-like urothelial cancers
As two distinct molecular subtypes of urothelial
bladder cancers have been classified, we
sought to examine whether GRIA1 was a
sub-Figure 4. Differences in TCGA patient survival associated with GRIA1 mRNA expression and TSS1500 CpG methyla-tion levels. In all plots, blue represents low levels of expression or methylamethyla-tion and red represents high levels of expression or methylation. A. Kaplan-Meier plot of overall survival in subjects with low versus high GRIA1 mRNA expression. B. Kaplan-Meier plot of overall survival in subjects with low versus high GRIA1 TSS1500 methylation levels. C. Kaplan-Meier plot of overall survival in subjects with basal-like bladder cancer with low versus high GRIA1
type-specific prognostic biomarker [16]. GRIA1
mRNA expression levels were found to be high-er in basal vhigh-ersus luminal subtype bladdhigh-er can-cers (FDR q-value = 2.66e-3, FC = 1.80). CpG methylation levels in the TSS1500 region of
GRIA1 were also significantly greater in
basal-like subtypes (FDR q-value = 2.61e-14, median beta difference (basal-luminal) = 0.17). Stra-
tified Kaplan-Meier analyses between basal
and luminal subtypes of urothelial tumors revealed that the prognostic power of GRIA1 is
significant in basal subtypes of bladder cancer, but not in luminal subtypes. Specifically,
increased mRNA expression levels of GRIA1
and increased CpG methylation in the TSS1500
region remained significantly associated with
overall mortality in basal-like bladder cancer tumors (Figure 4C and 4D), while neither expression levels or TSS1500 methylation
lev-els were significant among luminal-like bladder
cancers (Figure 4E and 4F). In addition, higher transcript levels of GRIA1 and increased CpG methylation in the TSS1500 region remained
significantly associated with overall mortality in
basal-like bladder independent of tumor stage (Wald chi-squared p-values = 6.30e-5; 1.86e-2, respectively). These results potentially sug-gest a unique role for dysregulation of gluta-mate receptor signaling in basal-like bladder cancers.
Genes involved in glutamate receptor signaling are differentially expressed between basal and luminal subtypes of urothelial cancer
We identified 70 DEGs associated with gluta
-mate receptor signaling between basal and luminal molecular subtypes of bladder cancer (Table 2). Of these, 42 (60%) displayed in- creased levels and 28 (40%) genes displayed decreased levels of mRNA in basal-like sub-types. Among these 70 genes was one gene encoding for another glutamate ionotropic receptor, GRIA2, and two genes encoding for metabotropic glutamate receptors, namely
GRM3 and GRM5. GRIA2 and GRM5 displayed increased levels of mRNA expression in basal-like subtypes (FDR q-values = 2.17e-3; 2.36e-11, FC = 35.40; 2.2.36e-11, respectively), while
GRM3 displayed decreased levels of mRNA
expression in basal-like subtypes (FDR q-value = 8.00e-19, FC = -2.50). Additionally, the DEGs that displayed increased expression levels in basal-like subtypes included two genes encod-ing downstream effector proteins of glutamate
receptors. Specifically, these were CAMK2A
and PIK3C2G (FDR q-values = 9.86e-20;
4.46E-6, FC = 2.49; 66.02, respectively) [22]. Finally, two regulators of metabotropic glutamate receptor signaling were also among the 70 DEGs. GDNF displayed increased expression levels in basal-like subtypes (FDR q-value = 4.17e-7, FC = 36.14), and F2 displayed decreased expression levels in basal-like sub-types (FDR q-value = 4.45e-5, FC = -60.69) [23, 24]. These results provide further evidence of differential activity of glutamate receptors in basal and luminal subtypes of urothelial cancer.
Figure 5. GRIA1 mRNA expression versus GRIA1
TSS1500 methylation.Log-transformed GRIA1 RNA-Seq mRNA expression values are plotted against log-transformed GRIA1 CpG methylation beta-values. Red points indicate values from basal-like subtypes and black points indicate values from luminal-like subtypes.
Discussion
Bladder cancer is highly prevalent throughout the world and the incidence is increasing [1]. Furthermore, bladder carcinomas are the most expensive cancer to treat over the course of a patient’s lifetime [25]. While CpG methylation has been associated with bladder carcinogen-esis, the role of CpG methylation in the develop-ment and progression of bladder tumors is
largely unknown [2, 5, 7]. We identified a set of
223 DMGs and DEGs where CpG methylation levels were associated with gene expression
levels. The identified genes are enriched for
their role in glutamate receptor signaling. One of these genes, GRIA1, is a significant biomark -er of ov-erall mortality in patients with basal-like urothelial bladder tumors that is independent of tumor stage.
Our data corroborate several other studies in reporting that the intragene region of methyla-tion is tied to funcmethyla-tional changes in gene
expression [5, 6, 8]. Specifically, we found that
Table 2. Genes associated with glutamate receptor signaling differentially expressed in basal-like and luminal-like subtypes of blad-der cancer
Gene ANCOVA FDR q-value (Basal/Luminal)Median FC
ASTL 2.65E-10 -2.07
CACNA2D1 3.18E-11 2.06
CALB2 3.75E-17 2.09
CAMK2A 9.86E-20 2.49
CASP14 1.31E-08 2.43
CASP5 1.18E-21 3.64
CBLN4 6.88E-04 49.23
CEACAM3 2.14E-14 2.21
CHGA 3.17E-04 2.17
CR2 1.45E-04 2.16
CRH 1.58E-21 -358.55
CSF3 8.47E-12 2.05
CYP1A1 1.77E-11 -2.45
DAB1 2.65E-21 -6.50
DLGAP2 7.75E-04 44.44
DRD1 2.88E-09 -2.04
ERBB4 1.41E-15 -2.86
F2 4.45E-05 -60.69
FMN1 5.06E-22 2.17
FOLR3 6.13E-13 76.61
GABBR2 1.13E-18 -2.46
GABRP 2.33E-13 2.15
GAL 4.87E-10 3.51
GAP43 4.82E-11 2.07
GDNF 4.17E-07 36.14
GJB1 3.40E-10 -3.64
GNRH2 3.69E-06 -33.66
GRIA2 2.17E-03 35.40
GRM3 8.00E-19 -2.50
GRM5 2.36E-11 2.11
GRP 1.89E-07 3.67
HBE1 6.12E-06 29.59
HNF1B 3.63E-27 -3.18
HRH3 1.07E-17 -125.54
HTR2A 6.52E-07 3.13
HTR3A 1.35E-06 66.51
IFNG 3.37E-14 3.06
IL13 1.23E-05 39.43
IL5RA 9.57E-03 39.70
KCNA2 6.49E-05 30.02
KCNJ6 2.39E-05 49.11
KLK11 1.28E-06 2.03
L1CAM 3.48E-20 2.01
LHX1 1.71E-12 106.28
LPA 1.10E-06 -3.06
MUC2 1.10E-13 -3.12
NR1H4 3.94E-12 -5.06
NR2E1 2.44E-06 -2.03
NRXN1 3.98E-04 2.25
PENK 9.12E-06 71.70
PIK3C2G 4.46E-06 66.02
PRKCG 5.03E-07 44.46
PTPRN 3.47E-17 2.37
PVALB 3.43E-14 -2.77
RETN 4.66E-09 2.73
RNASE3 2.02E-05 2.21
SGK2 8.93E-29 -2.43
SHH 1.47E-14 -5.66
SLC26A5 9.52E-12 -88.02
SLC5A1 2.43E-07 2.31
SLC6A4 8.57E-21 -2.50
SLCO1B3 8.89E-16 188.44
SST 2.83E-03 -28.11
TAC1 4.19E-07 -52.37
TFF2 4.53E-12 -4.13
TH 7.99E-15 -2.31
TPO 7.51E-04 42.51
TTR 1.73E-15 -187.68
TUBA4B 6.44E-04 36.59
hypermethylation within the TSS200 region was most often associated with gene silencing,
a finding that has been reported in both normal
and cancerous tissues [5, 26, 27]. In addition, several genes previously reported to display promoter hypermethylation in bladder cancer, including DBC1, PAX6, RUNX3, and WT1 also displayed promoter hypermethylation in the present study, although none were found to have altered expression [7]. This apparent incongruity may be explained by unmeasured effects of CpG methylation at distal-acting enhancer and silencer regions and demon-strates that our knowledge of the role of CpG methylation in tumor tissues remains incom-plete [28-31]. Finally, our observation of a large number of hypomethylated genes in the gene body and 3’ UTR regions is consistent with data
from methylation profiling of colorectal cancers
[32].
The data also demonstrate the surprising find
-ing that many genes previously identified to be
hypermethylated in their promoter regions in bladder cancer tumors are not hypermethyl-ated in the TCGA samples. Our result that
BRCA1 showed promoter hypomethylation in
tumor vs. non-tumor samples contrasts with previous publications that the BRCA1 promoter is hypermethylated in bladder cancer tumors [20, 21]. In addition, other tumor suppressor genes that are commonly reported to display promoter hypermethylation in bladder cancer, including PTEN, TP53, and RB1, displayed mini-mal changes in methylation (< 1%) between tumor and non-tumor tissue in their promoter regions in the present analysis [20, 21]. A pos-sible explanation for this discrepancy is that not all studies compare methylation status between tumor and non-tumor tissue to determine the change in methylation levels at the promoter regions. Similarly, not all studies used matched non-tumor control tissues, thus possibly failing to control for the interindividual differences in methylation [33, 34]. Our analysis indicates that promoter hypermethylation may only con-stitute part of an epigenetic-mediated bladder carcinogenesis signature and further contrib-utes to the emerging picture of the complex relationship between CpG methylation and gene expression.
In the present study, we found that the DEGs and DMGs were enriched for their role in the glutamate receptor signaling pathway. Nu-
merous genes related to glutamate receptor signaling were found to be differentially expressed between basal and luminal sub-types of bladder cancer. In addition, GRIA1, which encodes for glutamate ionotropic
recep-tor AMPA type subunit 1, was found to signifi
-cantly predict prognosis among basal-like uro-thelial bladder cancers. Glutamate is a neu-rotransmitter that also functions as a growth factor to stimulate proliferation in both normal and cancerous cells, and glutamate signaling has been found to be dysregulated in numer-ous cancers via changes in expression of gluta-mate receptors [22, 35-38]. Genes involved in glutamate receptor signaling have been report-ed to be aberrantly methylatreport-ed in other
malig-nant neoplasms [22, 35-37]. This is the first
study to provide evidence of dysregulation of CpG methylation and gene expression of gluta-mate receptors in bladder cancer. Interestingly, glutamate receptors are reported to contribute to carcinogenesis through activation of the calmodulin, PI3K/Akt, and EGFR signaling path-ways [39, 40]. These results highlight altered CpG methylation and/or mRNA expression of several genes involved in glutamate receptor signaling and these three downstream path-ways, including CAMK2A, PIK3C2G, GDNF, and
F2 [22-24]. Activation of these pathways is known to contribute to cell growth and prolifer-ation through various mechanisms, including activation of p63, a hallmark feature of basal-like bladder cancers [16, 41].
Several factors should be considered when interpreting the data from this study. First, intratumor sample location was unknown, and thus cellular heterogeneity within the tumor samples may be a confounding variable in our analysis. Second, there was not an available dataset from an independent cohort in which
we could validate our finding that elevated lev
iono-tropic glutamate receptor and mutations of critical enzymes and prognostic outcomes in non-small cell lung cancer and glioblastomas, respectively [42, 43].
In summary, we conclude that epigenetic profil
-ing of urothelial bladder carcinomas increases the understanding of the development and pro-gression of this highly prevalent neoplasm. Although bladder cancer is primarily a disease of somatic mutations, our study supports the growing body of evidence that implicates epi-genetic mechanisms in urothelial bladder
carci-nogenesis [2, 3]. Importantly, epigenetic modifi
-cations may be reversible, and thus represent potential targets to halt tumor progression by restoring normal tissue function through epi-genetic-directed pharmaceuticals [44]. As de-
monstrated in the present study, identification of these targets is an important first step in the
development of novel cancer therapies. Acknowledgements
This research was supported by the National Institutes of Health (http://www.nih.gov) (R01 ES019315 and P42ES005948) and the National Institute for Occupational Safety and Health (T42/OH-008673). The funders of this study had no role in the study design, data col-lection and analysis, decision to publish, or preparation of the manuscript.
Disclosure of conflict of interest
None.
Address correspondence to: Rebecca C Fry, Curriculum in Toxicology, The University of North Carolina, 140 Rosenau Hall, CB #7431, Chapel Hill, NC 27599, USA. Tel: +1-843-6864; Fax: 919-843-9047; E-mail: [email protected]
References
[1] Ploeg M, Aben KK, Kiemeney LA. The present and future burden of urinary bladder cancer in the world. World J Urol 2009; 27: 289-293. [2] Knowles MA, Hurst CD. Molecular biology of
bladder cancer: new insights into pathogene-sis and clinical diversity. Nat Rev Cancer 2015; 15: 25-41.
[3] Weinstein JN, Akbani R, Broom BM, Wang W, Verhaak RGW, McConkey D, Lerner S, Morgan M, Creighton CJ, Smith C, Kwiatkowski DJ, Cherniack AD, Kim J, Sekhar Pedamallu C,
Noble MS, Al-Ahmadie HA, Reuter VE, Rosenberg JE, Bajorin DF, Bochner BH, Solit DB, Koppie T, Robinson B, Gordenin DA, Fargo D, Klimczak LJ, Roberts SA, Au J, Laird PW, Hinoue T, Schultz N, Ramirez R, Hansel D, Hoadley KA, Kim WY, Damrauer JS, Baylin SB, Mungall AJ, Gordon Robertson A, Chu A, Kwiatkowski DJ, Sougnez C, Cibulskis K, Lichtenstein L, Sivachenko A, Stewart C, Lawrence MS, Getz G, Lander E, Gabriel SB, Creighton CJ, Donehower L, Cherniack AD, Kim J, Carter SL, Saksena G, Schumacher SE, Sougnez C, Freeman SS, Jung J, Sekhar Pedamallu C, Bhatt AS, Pugh T, Getz G, Beroukhim R, Gabriel SB, Meyerson M, Mungall AJ, Gordon Robertson A, Chu A, Ally A,
Balasundaram M, Butterfield YSN, Dhalla N,
Hanh PT, Kohl B, Van Le X, Phu BD, Thorp R, Tien NV, Vinh LQ, Sandusky G, Burks E, Christ K, Gee J, Holway A, Moinzadeh A, Sorcini A, Sullivan T, Al-Ahmadie HA, Bajorin DF, Bochner BH, Garcia-Grossman IR, Regazzi AM, Solit DB, Rosenberg JE, Reuter VE, Koppie T, Boice L, Kimryn Rathmell W, Thorne L, Bastacky S, Davies B, Dhir R, Gingrich J, Hrebinko R, Maranchie J, Nelson J, Parwani A, Bshara W, Gaudioso C, Morrison C, Alexopoulou V, Bartlett J, Engel J, Kodeeswaran S, Antic T, O’Donnell PH, Smith ND, Steinberg GD, Egea S, Gomez-Fernandez C, Herbert L, Jorda M, Soloway M, Beaver A, Carter S, Kapur P, Lewis C, Lotan Y, Robinson B, Hansel D, Guo C, Bondaruk J, Czerniak B, Akbani R, Broom BM, Liu Y, Zhang W, Weinstein JN, Lerner S, Morgan M, Kim J, Cherniack AD, Freeman SS, Sekhar Pedamallu C, Noble MS, Kwiatkowski DJ, Al-Ahmadie HA, Bajorin DF, Bochner BH, Solit DB, Rosenberg JE, Reuter VE, Koppie T, Robinson B, Skinner E, Ramirez R, Schultz N, Hansel D, Kim WY, Guo C, Bondaruk J, Aldape K, Czerniak B, Jensen MA, Kahn AB, Pihl TD, Pot DA, Srinivasan D, Wan Y, Ferguson ML, Claude Zenklusen J, Davidsen T, Demchok JA, Mills Shaw KR, Sheth M, Tarnuzzer R, Wang Z, Yang L, Hutter C,
Ozenberger BA, Sofia HJ, Eley G. Comprehensive
molecular characterization of urothelial blad-der carcinoma. Nature 2014; 507: 315-322. [4] Gui Y, Guo G, Huang Y, Hu X, Tang A, Gao S, Wu
R, Chen C, Li X, Zhou L, He M, Li Z, Sun X, Jia W, Chen J, Yang S, Zhou F, Zhao X, Wan S, Ye R, Liang C, Liu Z, Huang P, Liu C, Jiang H, Wang Y, Zheng H, Sun L, Liu X, Jiang Z, Feng D, Chen J, Wu S, Zou J, Zhang Z, Yang R, Zhao J, Xu C, Yin W, Guan Z, Ye J, Zhang H, Li J, Kristiansen K, Nickerson ML, Theodorescu D, Li Y, Zhang X, Li S, Wang J, Yang H, Wang J, Cai Z. Frequent mu-tations of chromatin remodeling genes in tran-sitional cell carcinoma of the bladder. Nat Genet 2011; 43: 875-878.
[5] Jones PA. Functions of DNA methylation: is-lands, start sites, gene bodies and beyond. Nat Rev Genet 2012; 13: 484-92.
[6] Hernando-Herraez I, Garcia-Perez R, Sharp AJ, Marques-Bonet T. DNA methylation: insights into human evolution. PLoS Genet 2015; 11: 1-12.
[7] Sánchez-Carbayo M. Hypermethylation in blad-der cancer: biological pathways and transla-tional applications. Tumor Biol 2012; 33: 347-361.
[8] Rojas D, Rager JE, Smeester L, Bailey KA, Drobná Z, Rubio-Andrade M, Stýblo M, García-Vargas G, Fry RC. Prenatal arsenic exposure and the epigenome: identifying sites of 5-meth-ylcytosine alterations that predict functional changes in gene expression in newborn cord
blood and subsequent birth outcomes. Toxicol Sci 2015; 143: 97-106.
[9] TCGA. The cancer genome atlas: charting a new course for cancer prevention, diagnosis and treatment. 2014.
[10] Singhal SK, Usmani N, Michiels S, Metzger-Filho O, Saini KS, Kovalchuk O, Parliament M. Towards understanding the breast cancer epigenome: a comparison of genome-wide DNA methylation and gene expression data. Oncotarget 2016; 7: 3002-3017.
[11] Li B, Ruotti V, Stewart RM, Thomson JA, Dewey CN. RNA-Seq gene expression estimation with read mapping uncertainty. Bioinformatics 2009; 26: 493-500.
[12] Necela BM, Crozier JA, Andorfer CA,
Lewis-Tuffin L, Kachergus JM, Geiger XJ, Kalari KR,
Serie DJ, Sun Z, Aspita AM, O’Shannessy DJ, Maltzman JD, McCullough AE, Pockaj BA, Cunliffe HE, Ballman KV, Thompson EA, Perez
EA. Folate receptor-α (FOLR1) expression and
function in triple negative tumors. PLoS One 2015; 10: e0122209.
[13] Infinium ® HumanMethylation450 BeadChip.
2012.
[14] Du P, Zhang X, Huang CC, Jafari N, Kibbe WA, Hou L, Lin SM. Comparison of Beta-value and M-value methods for quantifying methylation levels by microarray analysis. BMC Bioinfor- matics 2010; 11: 587.
[15] Rager JE, Yosim A, Fry RC. Prenatal exposure to arsenic and cadmium impacts infectious dis-ease-related genes within the glucocorticoid receptor signal transduction pathway. Int J Mol Sci 2014; 15: 22374-22391.
[16] Choi W, Porten S, Kim S, Willis D, Plimack ER, Hoffman-Censits J, Roth B, Cheng T, Tran M, Lee I, Melquist J, Bondaruk J, Majewski T, Zhang S, Pretzsch S, Baggerly K, Siefker-Radtke A, Czerniak B, Dinney CP, McConkey DJ.
Identification of distinct basal and luminal sub -types of muscle-invasive bladder cancer with different sensitivities to frontline chemothera-py. Cancer Cell 2014; 25: 152-165.
[17] Aine M, Eriksson P, Liedberg F, Sjödahl G, Höglund M. Biological determinants of bladder cancer gene expression subtypes. Sci Rep 2015; 5: 10957.
[18] Fleischer T, Frigessi A, Johnson KC, Edvardsen H, Touleimat N, Klajic J, Riis M, Haakensen VD, Wärnberg F, Naume B, Helland Å, Børresen-Dale AL, Tost J, Christensen BC, Kristensen VN, Sultan N, Baig SM, Sheikh MA, Jamil A.
Genome-wide DNA methylation profiles in pro -gression to in situ and invasive carcinoma of the breast with impact on gene transcription and prognosis. Genome Biol 2014; 15: 435. [19] Shen J, Wang S, Zhang YJ, Wu HC, Kibriya MG,
H, Santella RM. Exploring genome-wide DNA
methylation profiles altered in hepatocellular carcinoma using Infinium HumanMethylation
450 BeadChips. Epigenetics 2013; 8: 34-43. [20] Cabello MJ, Grau L, Franco N, Orenes E, Alvarez
M, Blanca A, Heredero O, Palacios A, Urrutia M, Fernández JM, López-Beltrán A,
Sánchez-Carbayo M. Multiplexed methylation profiles of
tumor suppressor genes in bladder cancer. J Mol Diagnostics 2011; 13: 29-40.
[21] Agundez M, Grau L, Palou J, Algaba F, Villavicencio H, Sanchez-Carbayo M. Evaluation of the methylation status of tumour suppres-sor genes for predicting bacillus Calmette-Guerin response in patients with T1G3 high-risk bladder tumours. Eur Urol 2011; 60: 131-140.
[22] Willard SS, Koochekpour S. Glutamate, gluta-mate receptors, and downstream signaling pathways. Int J Biol Sci 2013; 9: 948-959. [23] Miller S, Sehati N, Romano C, Cotman CW.
Exposure of astrocytes to thrombin reduces levels of the metabotropic glutamate receptor mGluR5. J Neurochem 1996; 67: 1435-1447. [24] Okada Y, Eibl G, Duffy JP, Reber HA, Hines OJ.
Glial cell-derived neurotrophic factor upregu-lates the expression and activation of matrix metalloproteinase-9 in human pancreatic can-cer. Surgery 2003; 134: 293-299.
[25] Sievert KD, Amend B, Nagele U, Schilling D, Bedke J, Horstmann M, Hennenlotter J, Kruck S, Stenzl A. Economic aspects of bladder
can-cer: What are the benefits and costs? World J
Urol 2009; 27: 295-300.
[26] Yang X, Han H, De Carvalho DD, Lay FD, Jones PA, Liang G. Gene body methylation can alter gene expression and is a therapeutic target in cancer. Cancer Cell 2014; 26: 577-590. [27] Wagner JR, Busche S, Ge B, Kwan T, Pastinen
T, Blanchette M. The relationship between DNA methylation, genetic and expression
inter-indi-vidual variation in untransformed human fibro -blasts. Genome Biol 2014; 15: R37.
[28] Griffiths A, Miller J, Suzuki D, Lewontin R,
Gelbart W. Transcription: an overview of gene regluation in eukaryotes. In: an introduction to genetic analysis. 7th edition. New York: W. H. Freeman; 2000.
[29] Jones PA, Takai D. The role of DNA methylation in mammalian epigenetics. Science 2001; 293: 1068-1070.
[30] Aran D, Sabato S, Hellman A. DNA methylation of distal regulatory sites characterizes dysreg-ulation of cancer genes. Genome Biol 2013; 14: R21.
[31] Estécio MR, Issa JP. Dissecting DNA hyper-methylation in cancer. FEBS Lett 2011; 585: 2078-2086.
[32] Naumov VA, Generozov EV, Zaharjevskaya NB, Matushkina DS, Larin AK, Chernyshov SV, Alekseev MV, Shelygin YA, Govorun VM.
Genome-scale analysis of DNA methylation in
colorectal cancer using Infinium
Human-Methylation450 BeadChips. Epigenetics 2013; 8: 921-934.
[33] Fisel P, Schaeffeler E, Schwab M. DNA methyl-ation of ADME genes ADME genes and interin-dividual variability of drug response. Clin Pharmacol Ther 2016; 99: 512-27.
[34] Sandovici I, Kassovska-Bratinova S, Loredo-Osti JC, Leppert M, Suarez A, Stewart R, Bautista FD, Schiraldi M, Sapienza C. Interindividual variability and parent of origin
DNA methylation differences at specific hu -man Alu elements. Hum Mol Genet 2005; 14: 2135-2143.
[35] Stepulak A, Rola R, Polberg K, Ikonomidou C. Glutamate and its receptors in cancer. J Neural Transm 2014; 121: 933-944.
[36] Luksch H, Uckermann O, Stepulak A, Hendruschk S, Marzahn J, Bastian S, Staufner C, Temme A, Ikonomidou C. Silencing of select-ed glutamate receptor subunits modulates cancer growth. Anticancer Res 2011; 31: 3181-92.
[37] Chang HJ, Yoo BC, Lim SB, Jeong SY, Kim WH, Park JG. Metabotropic glutamate receptor 4 expression in colorectal carcinoma and its
prognostic significance. Clin Cancer Res 2005;
11: 3288-3295.
[38] Wu CS, Lu YJ, Li HP, Hsueh C, Lu CY, Leu YW, Liu HP, Lin KH, Hui-Ming Huang T, Chang YS. Glutamate receptor, ionotropic, kainate 2 si-lencing by DNA hypermethylation possesses tumor suppressor function in gastric cancer. Int J Cancer 2010; 126: 2542-2552.
[39] de Groot J, Sontheimer H. Glutamate and the biology of gliomas. Glia 2011; 59: 1181-1189. [40] Brocke KS, Staufner C, Luksch H, Geiger KD,
Stepulak A, Marzahn J, Schackert G, Temme A, Ikonomidou C. Glutamate receptors in pediat-ric tumors of the central nervous system. Cancer Biol Ther 2010; 9: 455-68.
[41] Yoh K, Prywes R. Pathway regulation of p63, a director of epithelial cell fate. Front Endocrinol (Lausanne) 2015; 6: 1-9.
[42] Tamura H, Suzuki M, Moriya Y, Hoshino H, Okamoto T, Yoshida S, Yoshino I. Aberrant methylation of N-methyl-D-aspartate receptor type 2B (NMDAR2B) in non-small cell carcino-ma. BMC Cancer 2011; 11: 220.
[43] Labussiere M, Sanson M, Idbaih A, Delattre JY. IDH1 gene mutations: a new paradigm in
glio-ma prognosis and therapy? Oncologist 2010;
15: 196-199.