SHORT-TERM FEEDING EFFECTS OF HIGH-FAT DIET ON HIPPOCAMPAL NEUROINFLAMMATION: DIFFERENCES AMONG C57BL/6J, C3H/HeN, AND
C3H/HeJ MICE
Drew Millette
A thesis submitted to the faculty of the University of North Carolina at Chapel Hill in partial fulfillment of the requirements for the degree of Master of Science in the Department of
Nutrition, Gillings School of Global Public Health.
Chapel Hill 2012
Approved by,
Patricia Sheridan, PhD
Melinda A. Beck, PhD
ii Abstract
DREW MILLETTE: Short-term Feeding Effects of High-Fat Diet on Hippocampal Neuroinflammation: Differences among C57BL/6J, C3H/HeN, and C3H/HeJ mice
(Under the direction of Dr. Patricia Sheridan)
Neurodegenerative diseases represent a growing public health concern. Increasing
evidence has implicated a potential role of dietary intake of saturated fats in Alzheimer’s
development, possibly through Toll-like Receptor 4 (TLR-4) activation in microglia. We
hypothesized that a diet high in saturated fats would increase neuroinflammation, and loss of
TLR-4 would protect against this increase. C57BL/6, C3H/HeN, and C3H/HeJ mice were
given either a low-fat or a high-fat diet for 8 weeks. HFD increased the expression of TNF-
and decreased expression of IL-10 in the hippocampus of C57BL/6 mice, and increased
microglial TLR-2 and TLR-4 receptors. HFD did not increase neuroinflammation in
C3H/HeN mice; however, IL-6, MIF and SOCS-3 transcription were decreased. No
differences were discovered in C3H/HeJ mice. While microglia isolated from HFD-fed
C3H/HeN mice had increased TLR-2 and TLR-4 expression, TNF-α was decreased
following LPS-stimulation. In conclusion, C57BL/6 mice are an appropriate model for
iii
Adrienne, Paul, Mom, Dad, and all my friends,
thank you for all of your support, love, and guidance; I wouldn’t have survived these last two, very challenging years,
iv
Acknowledgements
First and foremost, I owe a great debt of gratitude to my advisor, Dr. Patricia
Sheridan for all of her help, guidance, patience, and support throughout the last two years
I’ve been in this program. The time I’ve spent working with her has not always been the
easiest. She helped me become a better student and scientist, enabling me to conduct this
research and write this thesis. In addition, I would like to thank my other mentors, Dr. Liza
Makowski and Dr. Melinda Beck, for all of their support, guidance, and help in preparing me
for this paper and my defense. I am extremely grateful to all the members of the Beck Lab
who have helped with my research over the last two years. In regards to members of the
Beck Lab, a special thanks to Justin Milner, Qing Shi, and Farah Ladak. If it wasn’t for the
help that all of you have given me, I would never have been able to collect the data presented
in this work. And lastly, I have great appreciation for all of the time that Dr. John Anderson
v
Table of Contents
List of Tables ... vii
List of Figures ... viii
List of Abbreviations and Symbols... ix
Chapter I - Background ...1
Introduction ...1
Risk Factors of Alzheimer’s Disease Development ...2
Obesity and Alzheimer’s Disease ...4
Mouse Models of Obesity and Cognitive Impairment ...5
Saturated Fatty Acids, Cognitive Impairment, and AD development...6
Proposed Mechanisms Involved in AD Development ...7
Role of Microglia in Neuroinflammation...8
Innate Immune Response and Toll-Like Receptor Signaling ...9
Lipopolysaccharides and Saturated Fatty Acids ... 11
Saturated Fatty Acids and Inflammation: a Role for TLR-4 ... 13
TLR-4, HFD, and Neuroinflammation ... 17
vi
Chapter II – Journal Manuscript ... 21
INTRODUCTION ... 21
METHODS AND MATERIALS ... 24
RESULTS... 27
DISCUSSION ... 30
Chapter III – Discussion ... 44
Considerations for Designing Studies Investigating Short-term HFD-feeding effects on the Hippocampus ... 45
Effects of Short-term HFD-feeding on Neuroinflammation in the Hippocampus ... 48
Effects of Short-term HFD-feeding on Microglia ... 50
Effects of Long-term HFD-induced Obesity on Neuroinflammation ... 51
Differences between C57BL/6 mice and C3H mice in response to HFD-feeding... 57
Future Studies and Implications of Our Findings ... 63
Appendix – Supplementary Data ... 71
vii List of Tables
Table 1. Microglial Toll-like Receptors, Cellular localization, and Associated Ligands ... 12
Table 2. Summary of Cited Studies Investigating Effects of High-fat
viii List of Figures
Figure 1. TLR-4 signaling pathway upon LPS stimulation ... 13
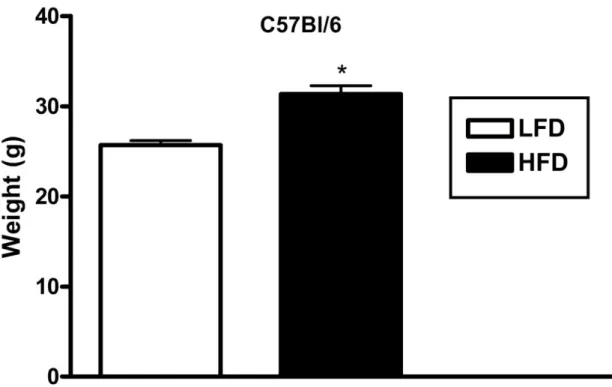
Figure 2. Mean weights of C57BL/6 mice fed for 8 weeks on either a
low-fat or high-fat diet ... 36
Figure 3. TNF-α expression (A) and IL-10 expression (B) in hippocampus
from C57BL/6 mice fed 8 weeks of either LFD or HFD ... 36
Figure 4. Percent of microglial population expressing TLR-2 and TLR-4/MD-2 surface receptors isolated from whole brain of C57BL/6 mice fed 8
weeks of either LFD or HFD ... 37
Figure 5. Mean Weights of C3H mice fed 8 weeks on either LFD or HFD (A), Percent Weight Gain after 8 weeks of HFD-feeding compared to LFD control (B), and Serum Leptin of C3H mice fed 8 weeks of either
LFD or HFD (C) ... 38
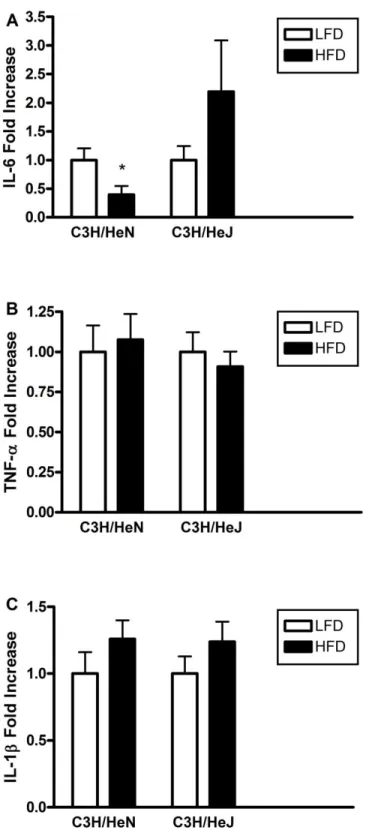
Figure 6. IL-6 expression (A), TNF-α expression (B), and IL-1β expression (C) in hippocampus of C3H mice fed 8 weeks of either LFD or HFD ... 39
Figure 7. MIF expression in hippocampus from C3H/HeN and C3H/HeJ fed
8 weeks of either LFD or HFD ... 40
Figure 8. SOCS-3 expression in hippocampus of C3H/HeN and C3H/HeJ fed
8 weeks of either LFD or HFD ... 40
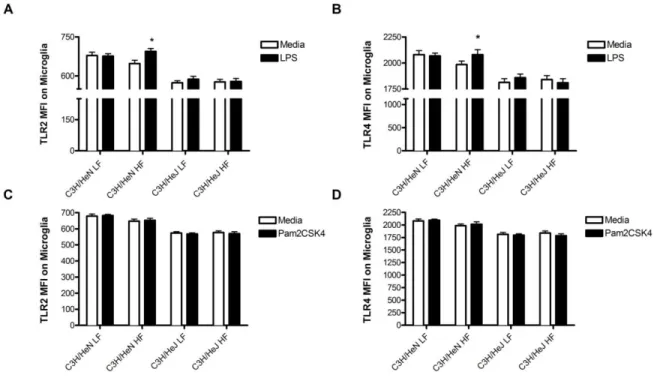
Figure 9. TLR-2 (A, C) and TLR-4 (B, D) surface expression (Mean Fluorescence Intensity) on microglia isolated from whole brain of C3H mice fed 8
weeks of either LFD or HFD ... 41
Figure 10. TNF-α and IL-6 production (pg/mL) in isolated microglia following
LPS stimulation (A, C) or Pam2CSK4 stimulation (B, D) ... 42
Figure 11. TNF-α and IL-6 production (pg/mL) in isolated splenocytes following
ix
List of Abbreviations and Symbols
4-HNE 4-hydroxynonenal
5XRT 5 times reverse transcriptase
Aβ beta-amyloid
AD Alzheimer’s disease
AGE advanced-glycation-end
Akt serine-threonine protein kinase Akt
AMP adenosine monophosphate
anti-TNF antibody to tumour necrosis factor
ANOVA analysis of variance
AP antigen presentation
AP-1 (also known as JUN, cJun) Jun proto-oncogene
APAF-1 apoptotic peptidase activating factor 1
APO apolipoprotein
APOE apolipoprotein E
APOEε4 apolipoprotein E sigma 4
APP amyloid precursor protein
x
Bax Bcl2-associated X protein
BBB blood brain barrier
Bcl-2 B-cell CLL/lymphoma 2
BDNF brain-derived neurotrophic factor
BMI body mass index
CA1 Region 1 of hippocampus proper
CD chow diet
CD11b (also known as Itgam) integrin, alpha M
CD14 cluster of differentiation 14
CD16/32 (also known as Fcgr1) Fc receptor, IgG, low affinity III
CD45 (also known as PTPRC) protein tyrosine phosphatase, receptor type, C
CD80 CD80 molecule
CD86 CD86 molecule
COX-2 cyclooxygenase-2
cDNA complementary deoxyribonucleic acid
cJun (also known as JUN, AP-1) Jun proto-oncogene
xi
Cre-lox cyclization recombinase-lysyl oxidase
DCX doublecortin
DEPC diethylpyrocarbonate
DHA docosahexaenoic acid
DIO diet-induced obesity
DMEM Dulbecco’s Modified Eagle Medium
DNA deoxyribonucleic acid
dNTP mix of nucleoside triphosphate
dT deoxy thymine
EAE experimentally-induced autoimmune encephalomyelitis
ELISA enzyme-linked immunosorbent assay
ERK1/2 mitogen-activated protein kinase
F4/80 (also known as Emr1) EGF-like module containing, mucin-like, hormone receptor-like sequence 1
FA fatty acid
FABP7 fatty acid binding protein-7
FADD Fas (TNFRSF6)-associated via death domain
xii
FATP-1 fatty acid translocase protein-1
FATP-4 fatty acid translocase protein-4
FBS fetal bovine serum
FFA free fatty acid
GAPDH glyceraldehyde-3-phosphate dehydrogenase
HBP-1 HMG box transcription factor-1
HBSS Hank’s Balanced Salt Solution
HF high-fat
HFD high-fat diet
HFL high-fat lard diet
HMGB1 high-mobility group box-1
HSD Honestly Significant Difference
HSV-1 herpes simplex virus-1
Iba-1 induction of brown adipocytes 1
ICV intracerebroventricular
IFN-γ interferon-gamma
xiii
IKB kinase inhibitor of kappa light polypeptide gene enhancer in B-cells, kinase
IKbKe inhibitor of kappa light polypeptide gene enhancer in B-cells, kinase epsilon
IKK1 (also known as CHUK) conserved helix-loop-helix ubiquitous kinase
IKKA (also known as CHUK) conserved helix-loop-helix ubiquitous kinase
IKKB (also known as IKBKB)inhibitor of kappa light polypeptide gene enhancer in B-cells, kinase beta
IL-1 interleukin-1
IL-10 interleukin-10
IL-1β interleukin-1 beta
IL-1R interleukin 1 receptor
IL-6 interleukin-6
IRAK1 interleukin-1 receptor-associated kinase 1
IRAK4 interleukin-1 receptor-associated kinase 4
IRF-3 interferon regulatory factor-3
JNK c-Jun N-terminal kinase
Kcal kilocalorie
LFD low-fat diet
LTP long-term potentiation
xiv
LBP lipopolysacchardie binding protein
LDLR low density lipoprotein receptor
LD low-fat diet
MCI mild cognitive impairment
MCP-1 macrophage chemotactic protein-1
MD-2 lymphocyte antigen 96
MEK1/2 (also known as Dsor1) downstream of raf1
MetS Metabolic Syndrome
MFI mean fluorescence intensity
MHC major histocompatibility complex
MIF macrophage migration inhibitory factor
MIP-1α (also known as CCL-3) chemokine (C-C motif) ligand 3 OR macrophage inflammatory protein -1 alpha
MKK3/6 mitogen-activated protein kinase kinase 3/6
MKK4/7 mitogen-activation protein kinase kinase 4/7
M-MLV Moloney Murine Leukemia Virus
mRNA messenger ribonucleic acid
xv
MyD88 myeloid differentiation primary response protein 88
NCI National Cancer Institute
NFκB Nuclear Factor Kappa-light-chain-enhancer of activated B cells
Nrf-2 nuclear factor (erythroid-derived 2)-like 2a
ω-3 omega-3
ω-6 omega-6
p38 (also known as MAPK14) mitogen-activated protein kinase 14
PAMP pathogen-associated molecular pattern
PCR polymerase chain reaction
PDGFB platelet-derived growth factor beta polypeptide
peIF2α phosphorylated eukaryotic translation Initiation Factor 2alpha
PET Positron Emission Tomography
PI3K phosphoinositide-3-kinase
pIKK phosphorylated IkappaB kinase-like 2
pJNK phosphorylated c-Jun N-terminal kinase
PPAR-γ Peroxisome proliferator activated receptor gamma
xvi
PRR pattern recognition receptor
PS-1 presenilin-1
PS-2 presenilin-2
PUFA polyunsaturated fatty acid
qRT-PCR quantitative real-time polymerase chain reaction
RANTES (also known as CCL-5) chemokine (C-C motif) ligand 5 OR regulated upon activation normal T-cell expressed and secreted
RIP ribosome-inactivating protein
RNA ribonucleic acid
ROS reactive oxygen species
RPMI Roswell Park Memorial Institute
SEM standard error of measurement
SFA saturated fatty acid
siRNA small interfering ribonucleic acid
STAT-3 signal transducer and activator of transcription 3
T2D type 2 diabetes
TAB2 TGF-beta activated kinase 1-binding protein 2
xvii
tGPi toxoplasma gondii phophoinositide
TIR toll-interleukin-1 receptor
TIRAP toll-interleukin-1 receptor (TIR) domain containing adaptor protein
TLR Toll-like receptor
TNF-α tumour necrosis factor-alpha
TRAF6 TNF receptor associated factor-6
TRAM (Trif)-related adaptor molecule
TRIF toll-interleukin-1 receptor (TIR) domain containing adaptor inducing interferon-beta
UPR unfolded protein response
US United States
WD Western Diet
Chapter I- Background Introduction
Neurodegenerative disorders, such as Alzheimer’s disease (AD) represent a growing
issue facing today’s population. As compared to other leading causes of mortality, limited
knowledge exists regarding risk factors and potential targets for treatment of
neurodegenerative disease. With advances in medical treatment of diseases such as
cardiovascular disease, diabetes, and cancer, along with changes in the US age-distribution
relating to the “baby boom” generation, a growing population over the age of 70 is at risk of
AD development. Emphasis on research in this field could lead to better overall health,
longer lives, and could lessen the emotional and financial burden on families and the health
care system [1].
Neurodegenerative diseases are characterized by loss of structure and function of
neurons in various regions of the brain. AD is a neurodegenerative disorder which results in
neuronal death within the hippocampal and basal forebrain regions of the brain. These neural
regions are generally associated with learning, memory, and emotional states. Cognitive
impairment, short-term memory loss, and mood changes are all associated with the
progression of the disease [1]. A main hallmark of AD is the formation of beta-amyloid
plaques that are associated with neuronal death, and they are a predominant feature in brains
of AD patients upon autopsy. Other predictors of AD development include ventricular
2
angiopathy, and silent cerebral infarcts [4]. Though these predictors for AD development
have been discovered, both improving screening processes and discovering possible
therapeutic targets for treatment remain main research focuses [5].
In order to develop new strategies for disease prevention and treatment of AD, it’s
important to understand the underlying causative mechanisms driving AD etiology.
Considering the complexity of the disease, discovering the underlying mechanisms requires a
full understanding of specific risk factors that lead to increased AD development. Our
research focuses on the contribution of a high-fat diet, a modifiable risk factor, to potential
mechanisms underlying the neurodegenerative disorder.
Risk Factors of Alzheimer’s Disease Development
Determining modifiable risk factors, such as nutritional variables, for AD
development can be difficult given the long developmental period and complexity of the
disease. Many factors likely involved in increased AD risk have varying effects over a long
time course. Age is considered the predominant risk factor with AD prevalence drastically
increasing as individuals age. AD prevalence is quite common among individuals aged 70
years, continues to increase in the 80 and 90 year age groups, and doubles every 5 years [6].
Like many diseases, genetic components of AD have been proposed. Early-onset
AD, which represents only 0.01% of the total number of AD patients, has implicated roles of
the amyloid precursor protein (APP) gene as well as presenilin-1 (PS-1) and presenilin-2
(PS-2) genes. These genes represent rare genetic influences that affect AD development in
individuals under the age of 65[1,7]. A more common genetic influence in AD development
3
apolipoprotein E (APOE) gene variant. Individuals with this allele have increased risk of
developing the disease; however, this gene polymorphism, unlike those in APP or the
presinilin genes, does not guarantee development of AD [7]. For most individuals, many
lifestyle risk factors contribute to the development and progression of the disease.
Metabolic syndrome (MetS), a collection of associated risk factors that increase the
risk for cardiovascular disease and type 2 diabetes mellitus has been implicated in several
different ways in the pathogenesis of AD [8]. Vascular arterial disease has long been
hypothesized to be closely related to Alzheimer’s development. Dementia is characterized in
many different ways including Alzheimer’s related dementia as well as non-Alzheimer’s
related vascular dementia. The vast majority of dementia cases lie between these two types
[9]. Growing evidence suggests that pathologies of AD and vascular disease overlap and
may be synergistic. Preclinical determination of Alzheimer’s development is possible
through measuring events of regional-specific cerebral perfusion, or the amount of blood
flow in certain regions of the brain at a given time [10,11]. In addition, cerebral amyloid
angiopathy, which is the accumulation of beta amyloid (Aβ) plaques in the arteries of the
brain, is a characteristic of both stroke and Alzheimer’s, bridging the gap between the two
diseases [4,10] .
Another aspect of MetS that has been implicated as a possible risk factor of AD
development is hyperglycemia and insulin resistance in type 2 diabetes (T2D). Longitudinal
studies have reported an association between insulin resistance, T2D, and AD [12,13].
Dysfunctional insulin signaling has been linked to a number of detrimental consequences
including oxidative stress, mitochondrial dysfunction, impaired membrane function, as well
4
tau hyperphosphorylation. PET studies have demonstrated reduced glucose uptake in AD
patients. Hyperglycemia, as a result of impaired insulin signaling or insulin resistance, is
associated with disruptive effects in the brain including detrimental effects on cognition and
memory. High levels of glucose in the brain are associated with formation of toxic
advanced-glycation-end (AGE) products, reactive oxygen species (ROS), and
hyperhomocysteinemia. Hyperglycemia perfusing the brain may alter the cerebral vascular
system, linking type 2 diabetes, vascular disease, and AD development [10,14].
MetS is a collection of several related pathologies including abdominal obesity linked
to an excess of visceral fat, insulin resistance, dyslipidemia, and hypertension [15].
Pathologies associated with MetS may stimulate the development of Alzheimer’s disease. A
risk factor associated with developing MetS is obesity [16].
Obesity and Alzheimer’s Disease
Obesity, a chronic condition characterized by the accumulation of excess adipose
tissue, has been associated with increased risk of multiple morbidities, increased mortality,
and it is a primary risk factor for both type 2 diabetes and cardiovascular disease. Obesity
represents a major, growing epidemic in the United States, with about two-thirds of the adult
population being either overweight (body mass index (BMI) ≥ 25-30) or obese (BMI ≥ 30)
[15]. In addition, obesity has been increasing world-wide with the spread of the Western
Diet (WD). The WD is characterized by higher levels of both dietary saturated fats and
sugars [17]. In addition to its involvement in the Metabolic Syndrome, obesity, i.e. visceral
fat expansion, has recently been proposed as a risk factor for the development of AD. In a
study by Fitzpatrick et al. (2009), the authors reported that there was an increased risk of
5
adjusting for demographics (hazard ratio [HR], 1.39; 95% CI, 1.03 – 1.87). Higher BMI in
middle life has been reported to be associated with the development of cognitive impairment
and possible neurodegeneration later in life [18]. Another epidemiological study, conducted
by Xu et al. (2011), of a population-based twin study in relation to midlife BMI status, found
that midlife, overweight BMI (25-30) and obesity (≥30) were associated with increased risk
of dementia. They used an adjusted generalized estimating equation with ORs of 1.71 (95%
CI 1.30 – 2.25) for overweight and 3.88 (95% CI 2.12 – 7.11) for obesity [19].
Determining associations between AD development and BMI can sometimes be
difficult in older age groups, especially if low BMI in older age is an indicator of severe
undernourishment. A population-based prospective cohort study conducted by Hughes et al.
(2009) as part of The Kame Project reported that subjects with higher baseline BMI and
slower declining BMI in late life was associated with reduced risk of dementia. The results
of their study suggest that low BMI or a faster decline in BMI in late life may be preclinical
indicators of the development of dementing illness, especially for those who were initially
overweight or obese [20].
Mouse Models of Obesity and Cognitive Impairment
Mouse models have also given indications that obesity impairs cognition. These
particular animal studies have utilized very long-term high-fat feeding models to induce
obesity. A study by Farr et al. (2008) tested diet-induced obese mice, as determined by 30%
weight gain after 10 months of high-fat diet (HFD) feeding, against non-obese control mice
in several spatial memory tests including the hippocampal-dependent Morris Water maze and
6
non-obese mice in both of these spatial memory tests, indicating a relationship between
obesity and hippocampal-dependent, cognitive impairment. Farr et al. (2008) also reported
that obese mice performed significantly less well in the non-hippocampal dependent, lever
press test [21]. In a report, Hwang et al. (2009) presented evidence that obese male mice, fed
a HFD for 9 to 12 months, had significantly lower long-term potentiation (LTP) than normal
weight controls. Long-term potentiation is a measure of synaptic plasticity and is important
for retention of new memories. Impairments in LTP are a characteristic of Alzheimer’s
patients [22].
Saturated Fatty Acids, Cognitive Impairment, and AD development
Several studies investigated the effect of diet-induced obesity on AD development.
However, in previous studies which had long dietary exposures [21,22], it was difficult to
separate the effects of obesity from effects of the dietary components. Diets high in saturated
fatty acids have been proposed as a risk factor for AD development in humans and cognitive
impairment in mice [23-25].
Morris and co-investigators (2003) observed dietary influences of several types of
fatty acids on later AD development in a population of Chicago inhabitants over the age 65
with no pre-clinical AD symptoms observed. After a mean follow-up of 3.9 years, the
general trend indicated that diets high in saturated and trans-unsaturated fatty acids, as
reported through a food-frequency questionnaire, correlated with increased risk of AD
development in the subjects, whereas diets high in monounsaturated and ω-6 polyunsaturated
fatty acids had a marginally decreased risk of AD development [23]. In another study,
Mattson (2003) stated that low-calorie, low-fat diets have a protective effect against AD
7
Several mouse studies examined the effect of high-fat diets on cognition and possible
risk factors for AD development [1,24,25]. By attempting to limit the consequences of
HFD-induced obesity; however, most studies were unable to fully separate short-term feeding
effects of HFD from potential obesigenic effects on cognition.
A study conducted by Gault et al. (2010) presented evidence that high fat diets result
in cognitive impairment in object recognition tests. In addition, Gault also presented
evidence that high-fat fed mice have compromised LTP induction and maintenance as
compared to low-fat fed controls [24]. The Mattson (2003) study reported HFDs promoted
cognitive decline as compared to dietary restricted, low-fat controls in rodents [1]. Pistell et
al.(2010) presented evidence that C57BL/6 mice fed high-fat diets consisting of 60% fat from
lard for 16 weeks produced cognitive impairment and increased proinflammatory cytokine
production including Tumor Necrosis Factor – α (TNF-α) and Interleukin-6 (IL-6) in isolated
whole-brain tissue compared to low-fat control mice [25].
Proposed Mechanisms Involved in AD Development
Several proposed mechanisms involved in progression of the neurodegenerative state
have been postulated. Among these, two predominant mechanisms have been proposed that
could generate symptoms of AD. The first mechanism is the formation of Aβ plaques, a
process sometimes referred to as abnormal protein aggregation. Aβ is derived from amyloid
precursor protein (APP), which was mentioned earlier as one of the genes in which rare
mutations can lead to early-onset AD. Production and aggregation of Aβ peptides is believed
to be associated with synaptic dysfunction and neuronal death. Aggregation of the Aβ
8
(MCI) and are associated with generation of ROS, resulting in membrane lipid peroxidation
and neuronal death. Aβ accumulation is a hallmark pathological and diagnostic indicator of
AD [26-28].
A second proposed mechanism suggests that increased neuroinflammation through
activation of resident immune cells results in increased neuronal loss, and subsequent
neurodegeneration. Neuroinflammation in different regions of the brain results from the
generation of several types of molecules, including pro-inflammatory cytokines, chemokines,
and immunoregulators. An exaggerated immune response is considered the predominant
source of these inflammatory molecules. In many cases, neuroinflammation is used to fight
off infection and in maintaining proper brain function through apoptosis of damaged neurons
[29].
The central nervous system (CNS) is tightly regulated in terms of the immune
response. For many years, the CNS has been considered an “immune-privileged” organ
under strict control by the blood brain barrier (BBB). However, the immune response of the
brain may be more dynamic than once believed with new discoveries regarding microglial
function, the brain’s innate immune cells, and recent reports that certain agents, including
WD-feeding, can alter BBB permeability [29,30].
Role of Microglia in Neuroinflammation
Microglia are cells within the brain that can be derived from myeloid cells,
particularly monocytes, from the peripheral circulation. They comprise 12% of the cells
within the brain, with the highest concentrations of microglia present in the hippocampus and
9
within the CNS. Each microglial cell has been hypothesized to function as a hybrid between
a white blood cell and a glial cell [29] .
Microglial function is similar to that of macrophage. Microglia express MHC class II
molecules and they have the capacity for antigen presentation (AP) to other immune cells for
recognition and destruction. Microglia also secrete proinflammatory molecules, i.e.
cytokines and chemokines, upon activation. Microglial function helps to clear infectious
agents within the CNS as well as facilitate apoptosis of damaged cells. Stimulated microglial
cells enable neurons to recover from traumatic stress and injury and have been reported to
facilitate guided migration of stem cells to sites of inflammation and injury. Microglia also
express TLRs 1-9 on their cell surface and intracellularly, which enables them to respond
efficiently to different types of pathogens as part of the innate immune system [31].
Innate Immune Response and Toll-Like Receptor Signaling
The body’s response to infection from microbial pathogens relies on both the innate
and adaptive immune responses. The innate immune response acts immediately after an
infectious challenge; and its actions are conducted largely by modified monocytes, especially
macrophage. Macrophages can phagocytose and kill pathogens, as well as produce several
inflammatory mediators and cytokines [32] . The ability of these innate immune cells to
recognize foreign pathogens and initiate the immune response relies heavily on surface and
intracellular receptors that have adapted through time to respond to a wide variety of foreign
molecules. Among the pattern-recognition receptors (PRRs), Toll-like receptors (TLRs)
have been identified as respondents to a large variety of bacterial, viral, and fungal agents
10
Mammalian TLRs are highly conserved receptors which share sequence similarity
with Toll proteins, essential molecules in embryonic patterning and antifungal protection
found in drosophila [34,35]. Mammalian TLRs are type 1 transmembrane protein receptors
found on a variety of innate immune cells including macrophages, neutrophils, natural killer
cells, and microglia. As part of the innate immune system, TLRs are capable of
differentiating between self and foreign pathogens [34] . In addition, TLRs are also related
to the IL-1 receptor; however, the extracellular, leucine-rich repeat domains of TLRs are very
different from the extracellular domain of IL-1R. TLRs respond to specific molecular motifs
called pathogen associated molecular patterns (PAMPs) found on a variety of pathogens in
microbial, viral, and fungal organisms [34,36]. As of 2012, 10 human TLRs and 12 mouse
TLRs have been discovered and are known to respond to specific ligands, both physiological
and synthetic [37]. Microglial TLRs are present either on the plasma membrane
(TLR-1:TLR-2, TLR-2, TLR-2:TLR-6, TLR-4, TLR-4:TLR-6, TLR-5, and TLR-11(mouse)) or on
the endosomal membrane (TLR-3, TLR-7, TLR-8, and TLR-9). Although some ligands for
certain TLRs have yet to be characterized, a list of known TLRs and respective ligands are
characterized in Table 1.
The first identified and most potent TLR ligand is lipopolysaccharide (LPS), a
component of the cell wall of Gram negative bacteria. LPS, also known as endotoxin, which
is normally bound to a soluble factor called LPS binding protein (LBP) associates with a
phosphatidylinositol-anchored cell surface molecule of microglia called cluster of
differentiation 14 (CD14), which in turn activates TLR-4 signaling. In addition, a small
secreted molecule called MD-2 associates with TLR-4 and is essential for LPS recognition
11
events that ultimately regulate the innate immune response and inflammation. Of particular
interest is the activation of Nuclear Factor Kappa-light-chain-enhancer of activated of B-cells
(NF-ᴋB), a proinflammatory transcription factor which enhances cytokine and inflammatory
mediator production [33,34]. Downstream events of TLR-4 activation can lead to several
different outcomes dependent on localization of several intermediate steps. Initially, it was
thought that myeloid differentiation primary response protein 88 (MyD88) was a necessary
signaling adaptor for effective TLR-4 signaling; however, MyD88 deficient mice still
promote changes that protect them against viral infections through upregulation of IRF-3
upon TLR-4 stimulation and signaling through another adaptor molecule called
TIR-containing adaptor inducing interferon-β (TRIF) [33,34] . The TLR-4 signaling pathway is
represented in Figure 1.
Lipopolysaccharides and Saturated Fatty Acids
Initially, LPS was thought to be the only ligand for TLR-4 stimulation. LPS is
highly conserved across species and contains a core of hydrophilic polysaccharides, an O
antigen, and a hydrophobic lipid A tail. The lipid A tail is considered the main inducer of the
biological responses of LPS [38]. Lipid A of E. Coli and S. 11typhimurium is a β-1,6 linked
disaccharide of glucosamine acylated with R-3-hydroxylaurate or myristate and
phosphorylated at positions 1’ and 4’. The 3-hydroxyl groups of these saturated fatty acids
are further 3-O-acylated by lauric acid, myristic acid, or palmitic acid. When the lipid A tail
is deacylated, capable through the enzyme, acyloxyacyl hydrolase, it loses its endotoxic
properties and acts antagonistic to TLR-4 signaling [39]. This finding, originally reported in
a 1986 study, suggests saturated fatty acyl moieties of the lipid A tail may be essential to
12
Table 1. Microglial Toll-like Receptors, Cellular localization, and Associated Ligands
Toll-like Receptors
Cellular Location
Physiological Ligands Synthetic ligands
TLR-1:TLR-2 Plasma Membrane Triacylated lipopeptides Pam3CSK4
TLR-2 Plasma Membrane Peptidoglycan, phospholipomannan, tGPI-mucins,
haemagglutinin, porins, lipoarabinomannan, glucoronoxylomannan, high-mobility group box 1 protein (HMGB1)
Not determined
TLR-2: TLR-6 Plasma membrane Diacylated lipopeptides, lipoteichoic acid, zymosan S-(2,3-bispalmitoyloxypropyl)-CGDPKHSPKSF,
macrophage-activating lipopeptide of 2kDa, Pam2CSK4
TLR-3 Endosomal
Membrane
Double-stranded RNA Polyl:C
TLR-4 Plasma Membrane Gram negative bacterial lipopolysaccharide,
vesicular stomatitis virus glycoprotein, mouse mammary tumour virus envelope protein, mannans, glycosylinositol phospholipids, Viral envelope proteins, heat shock proteins, fibrinogen, nickel, HMGB1
Not determined
TLR-4: TLR-6 Plasma membrane Oxidized low-density lipoprotein, amyloid-β fibrils Not determined
TLR-5 Plasma Membrane Flagellin Not determined
TLR-7 Endosomal
Membrane
Single-stranded RNA Imiquimod, resiquimod, loxoribine
TLR-8 Endosomal
Membrane
Single stranded RNA Resiquimod
TLR-9 Endosomal
Membrane
DNA, haemozoin CpG-A, CpG-B, and CpG-C oligodeoxynucleotides
TLR-11 Plasma
membrane
Profilin Not determined
13
Figure 1
.
TLR-4 signaling pathway upon LPS stimulation (Adapted from PharmaProjects and ClipArt)
research, greater focus has been placed on the role of dietary saturated fatty acids (SFAs) and
TLR-4 signaling as a means for promoting long-term, low-grade inflammation.
Saturated Fatty Acids and Inflammation: a Role for TLR-4
Several studies have investigated high-fat diet induced inflammation in many areas of
the body implicating it in the etiology of several diseases related to MetS. High-fat diet
14
macrophages. Both adipose tissue and macrophages have been reported to produce
significant quantities of inflammatory molecules, which are increased in diets high in
saturated fats. Ajuwon et al. (2005) investigated the effect of culturing 3T3-L1 adipocytes
with palmitate (SFA) on expression of several inflammatory cytokines and mediators. They
reported a 3.5-fold increase in NFᴋB activity as measured through a luciferase enzyme assay,
as well as inducing increases in IL-6 mRNA and protein expression. Results from this
experiment indicate that palmitate is capable of inducing inflammation in adipocytes;
however, a specific mechanism linking palmitate and NFᴋB activation was not investigated.
High-fat diet-induced insulin resistance is thought to be mediated in part through changes in
inflammation in adipose tissue and adipocytes, and TLR-4 mutation has been reported to
attenuate HFD-induced insulin resistance [43,47,48]. Therefore, to better understand the
underlying mechanism, several studies have focused on the role of TLR-4 in HFD-induced
changes in the adipocyte inflammatory state [41,42].
Shi and colleagues (2006) linked TLR-4 to inflammatory changes in adipose tissue
and adipocytes stemming from either high saturated fat diets or the presence of palmitate.
Before investigating the potential role of TLR-4 in adipocytes, the authors wanted to confirm
a link between palmitate and TLR-4 signaling. The authors used a 293T cell transfection
experiment to confirm that palmitate works through TLR-4 in a MyD88-dependent process to
induce NFᴋB activation. Shi and co-researchers then addressed palmitate induced
inflammatory changes through TLR-4 in 3T3-L1 adipocytes. Shi and co-researchers (2006)
confirmed that TLR-4 mRNA is significantly expressed in 3T3-L1 adipocytes, isolated
mouse adipocytes, and adipose tissue, and confirmed that TLR-4 is functional through LPS
15
stimulated with free fatty acids (FFA) had increased cytokine production (TNF-α and IL-6);
however 3T3-L1 adipocytes with a TLR-4 knockdown through TLR-4 siRNA did not show
any change. In addition, adipocytes were harvested from WT and TLR-4 -/- mice and stimulated with both LPS and FFAs. In WT adipocytes, LPS, and to a lesser extent FFAs,
induced both IL-6 and TNF-α production; however this induction was absent in the TLR-4 -/-adipocytes [43].
As part of the in vivo portion of the study,Shi et al. (2006) fed WT and TLR-4 -/-mice either a high-fat diet (HFD) or low-fat diet (LFD), and harvested adipose tissue. The
authors reported that even though both mouse types gained significantly more weight on the
HFD, the TLR-4 -/- mice were more insulin sensitive. In addition, WT mice exhibited increased HFD-induced adipose tissue expression of IL-6, MCP-1, SOCS3, TNF-α, as well
as the macrophage marker F4/80. Though adipocytes do express TLR-4 and produce
inflammatory cytokines in vitro, previous studies have indicated that adipose tissue from
obese individuals exhibit higher levels of macrophage infiltration, which could be
contributing to increased inflammatory molecules being produced by the tissue [43,44].
Suganami et al. (2006) investigated the interaction between co-cultured adipocytes
and macrophage, in order to better understand a mechanism linking saturated fats to reported
increases in inflammation produced in adipose tissue. These researchers examined the
relative contribution to inflammatory changes of adipocytes and macrophage in co-culture.
The investigators used a magnetic cell sorting to completely separate the adipocytes and
macrophage, as confirmed through exclusively expressed markers: adiponectin (adipocytes)
and F4/80 (macrophage). They assessed relative mRNA levels for several markers in the two
16
significantly up-regulated in both macrophage and adipocytes, though at much higher
concentrations in adipocytes [44].
In contrast to previous reports, TNF-α mRNA was only up-regulated in the
macrophage fraction, indicating that the majority of inflammatory changes that result from
circulating FAs (produced by lipolysis in adipocytes) directly stem from macrophages
present in adipose tissue, rather than from adipocytes themselves. In addition, Suganami’s
research team examined the role of TNF-α released by macrophage and the role of palmitate,
the most abundant FA released by adipocytes, as a potential paracrine mediator of
inflammation. They found that TNF-α was capable of inducing NFᴋB activation in
adipocytes and that palmitate was capable of inducing TNF-α production through a
NFᴋB-dependent process in RAW264.7 macrophages, a standard macrophage culture cell model
[44].
Suganami et al. (2007) harvested macrophages from C3H/HeJ and C3H/HeN mice to
assess the role of TLR-4 in this process. C3H/HeJ mice possess a natural loss of function
mutation in TLR-4, whereas C3H/HeN mice are their respective TLR-4 intact controls.
Suganami and co-workers (2007) also reported that both LPS (positive control) and palmitate
induced TNF-α in macrophages isolated from the C3H/HeN mice. In contrast, this increase
in TNF-α expression was greatly attenuated in the macrophages isolated from TLR-4 mutant
C3H/HeJ mice. Suganami and co-researchers (2007) also investigated levels of lipolysis by
adipocytes in the presence of macrophage from either C3H/HeJ or C3H/HeN mice. FA
release was significantly decreased in the adipocyte co-cultured with C3H/HeJ macrophage
as compared to co-cultures of adipocytes with C3H/HeN macrophage, indicating a role of
17
Many reports have demonstrated the role of TLR-4 in regulating inflammation in
individuals with HFD-induced obesity, as well as playing a role in several disorders
associated with MetS. A study by Tsukomo et al. (2007) investigated the role of TLR-4 as a
candidate between metabolic signals, inflammation, and insulin resistance. The investigators
gave C3H/HeJ and C3H/HeN mice either a chow control diet or a HFD (55% from fat)
experimental diet. Tsukomo et al. (2007) reported that the C3H/HeJ mice were protected
against diet-induced obesity, as well as exhibiting decreased adiposity, increased oxygen
consumption, decreased respiratory exchange ratio, greater insulin sensitivity, and increased
insulin signaling capacity in adipose tissue, muscle, and liver. Furthermore, TLR-4 mutation
in the C3H/HeJ mice prevented IᴋB kinase and c-Jun NH2-terminal kinase activity, which are
both involved in NFᴋB activation and production of inflammatory molecules. Taken
together, results indicated a critical role of TLR-4 in the development of HFD-induced
insulin resistance, potentially mediated through increased inflammation [42,45]. Considering
the relationship between MetS-associated disorders, such as insulin resistance, with AD
development, TLR-4 could be playing a role in regulating HFD-induced neuroinflammation,
which may lead to increased AD risk.
TLR-4, HFD, and Neuroinflammation
Few studies have addressed the role of TLR-4 in HFD-induced changes in
neuroinflammation. Considering the similarity between macrophage and microglial function
and that both cell types express TLR-4, as well as many other TLRs, it’s likely that many of
the same processes exist. In addition, dietary fats are transported into the brain through a
process still under investigation, but reported to involve both active transport through
18
A Milanski et al. (2009) study presented evidence that TLR-4 signaling is upregulated
and activated by long chain saturated fatty acids and this contributes to increased ER stress in
the brain (hypothalamus) of TLR-4 intact C3H/HeN mice, but not C3H/HeJ mice [47]. This
study followed up a report by Tsukomo et al. (2007) hypothesizing that dietary fats act
through TLRs 2/4 and endoplasmic reticulum stress to induce cytokine expression in the
hypothalamus, leading to functional resistance to the anorexigenic hormones, insulin and
leptin [42]. Milanski et al. (2009) used both Wistar rats and the C3H/HeJ and C3H/HeN
mice fed either a chow or one of two high fat (36.0 g% fat from lard or 36.0g% oleic acid
rich) diets. The results of their study indicated that long chain saturated fatty acids act
through TLR-4 to promote increased inflammatory protein expression in the hypothalamus,
increased cytokine production, increased ER stress, and TLR- 2/MyD88 and TLR-4/MyD88
upregulation in rats. In addition, loss or inhibition of TLR-4 protected against diet-induced
body mass gain, impaired leptin resistance, and arachidic acid-induced hypothalamic
cytokine expression. The Milanski (2009) study clearly indicated that TLR-4 plays a major
role in regulating inflammation in the hypothalamus, as well as contributing to disorders
related to obesity and MetS [42,47].
Milanski et al. (2009) reported that both TLR-2 and TLR-4 were upregulated and
constitutively activated in the hypothalamus, and that TLR-2 and TLR-4 were exclusively
expressed on microglia within the hypothalamus following a high fat diet. In addition to
increased or constitutive activation of TLRs caused by high saturated fats, the microglia will
also respond more vigorously to agonists such as LPS or peptidoglycans, and produce
increased levels of proinflammatory molecules [47]. This phenomenon is known as
19
such as “primed microglia.” In addition, another study with similar dietary conditions to the
Milanski study (2009) indicated that 8 weeks of high-fat feeding was sufficient to increase
apoptotic markers in the hypothalamus, microglial activation through increased F4/80
expression, and TLR-4 upregulation. In addition, this study reported that loss of TLR-4
activity in C3H/HeJ mice, compared to C3H/HeN control mice, prevented body mass gain
with equivalent dietary food intake and altered expression of apoptotic markers [48].
Preliminary data from the Sheridan lab (unpublished data) reported that early
infection with herpes simplex virus 1 (HSV-1), primed microglia isolated from C57BL/6
whole brain display increased pro-inflammatory gene expression including TLR-4.
Microglia harvested from HFD, HSV-infected mice had higher expression levels of several
markers of priming and inflammatory cytokines including TLR-4, MHCII, CD80, CD86,
CD11b, IL-1β, and TNF-α compared to LFD, HSV-infected mice, implicating a role of HFD
in contributing to increased TLR-4 surface receptor expression.
Hypotheses
Previous research has focused on either the role that TLR-4 plays in other areas of the
body than the brain, or how HFD can contribute to increased neuroinflammation in areas of
the brain less related to Alzheimer’s development. We examined the effect of HFD on
neuroinflammation within the hippocampus, an important site in AD development.
Furthermore, investigation of the role that TLR-4 plays in mediating HFD-induced
neuroinflammation was warranted, since previous reports have indicated a role of TLR-4 in
mediating HFD-induced inflammation in other tissues. Our primary hypothesis was that
mice fed a high-fat diet (HFD) for 8 weeks will exhibit increased levels of
20
addition, we postulated that 8 weeks of HFD-feeding will result in increased surface
expression of TLR-2 and TLR-4. Our secondary hypothesis was that loss of TLR-4 activity
would prevent HFD-induced increases in neuroinflammation.
In order to investigate the effect of HFD-feeding on neuroinflammation in the
hippocampus, C57BL/6 mice were fed either a high fat diet (HFD) consisting of 45%
calories from lard/soybean oil, or a low-fat control diet (LFD) consisting of 10% calories
from the same fat source. This LFD control diet was more reflective of a true low-fat control
diet, as previous studies, including the Milanski (2009) and Moraes (2009) studies, utilized
normal chow diets with highly variable fat sources. After assessing status of
neuroinflammatory mediators and changes in microglial surface receptor expression in the
C57BL/6 mice, the role of TLR-4 in mediating HFD-induced neuroinflammation was
examined by using C3H/HeJ mice, which as mentioned previously, have a natural
loss-of-function mutation in TLR-4. C3H/HeJ mice and C3H/HeN mice, and their respective TLR-4
intact controls, were fed the same HFD and LFD for 8 weeks. We measured cytokine
transcriptional changes and microglial reactivity.
Chapter II – Journal Manuscript1
INTRODUCTION
Neurodegenerative disease such as Alzheimer’s disease represents a growing public
health concern with prevalence increasing both domestically and world-wide.
Neurodegenerative disease is characterized by loss of structure and function of neurons
within various regions of the brain, leading to symptoms such as cognitive
impairment/dementia. Age has long been considered the most predominant risk factor for
Alzheimer’s development. Considering shifts in the age distribution of the US population
towards older aged individuals, the population at risk for this disease continues to increase.
This has placed greater economic burden on the health community, emphasizing the
importance of research in this field towards developing new screening techniques, better
treatment options, as well as discovering preventative measures. Unlike other diseases such
as cancer, diabetes, or cardiovascular disease, treatment for neurodegenerative disease
remains scarce as many of the risk factors are either unknown or insufficiently characterized
[1] . Determining risk factors for diseases with long developmental periods such as
Alzheimer’s disease can be a difficult task. In recent years, several potential risk factors for
neurodegenerative disease development have been proposed and investigated.
Alzheimer’s is considered a multi-factorial disease with both genetic and
environmental influences. Early onset AD is characterized by rare mutations in the APP
gene, as well as mutations in PS-1 and PS-2; however, these represent only a small
percentage of the population who develop AD. A more common gene polymorphism,
1
22
APOEε4, has been associated with increased AD development, representing a main genetic
influence for late-onset AD. This polymorphism is not sufficient to cause AD development
on its own [7]. In general, environmental factors likely play a larger role in AD etiology over
the course of a patient’s lifetime.
Disorders associated with Metabolic Syndrome (MetS) have been given greater focus
within this research field as potential risk factors. Insulin resistance, Type II Diabetes,
Vascular Disease, Atherosclerosis, and Obesity have all been associated with increased risk
of AD development. Obesity contributes as a primary risk factor for all disorders related to
MetS [8,12,13]. Recent longitudinal studies have associated obesity/BMI, as well as,
increased dietary intake of saturated and trans-unsaturated fatty acids with increased AD risk
[23,49,50,51]. Though it may be difficult to dissociate each MetS disorder and dietary intake
in order to identify the true underlying mechanism, it is possible to address potential
pathways that contribute to increased AD development.
One proposed pathway that has been implicated in several MetS disorders is high fat
diet-induced activation of innate immunity through Toll-like Receptor 4 (TLR-4).
Polymorphisms in TLR-4 in the context of diet have been associated with several MetS
disorders and age-related diseases, indicating that this may be a relevant target in AD disease
pathology [47,52,53] TLR-4 is part of a family of Toll-like receptors that respond and
activate the innate immune response upon binding to various pathogen associated molecular
patterns (PAMPs) found on bacteria, viruses, and fungi. Activation of the innate immune
response increases levels of proinflammatory cytokines, chemokines, and immunoregulators.
Classically, lipopolysaccharide (LPS), a main component in cell walls of gram-negative
23
activates a downstream cascade of TLR-4, ultimately leading to increases in Nuclear Factor
Kappa-light-chain-enhancer of activated B-cells (NF-ᴋB), a transcription factor that
promotes production of pro-inflammatory cytokines and chemokines [34]. LPS contains
three domains; an O antigen, a core polysaccharide, and a lipid A tail. Evidence has shown
that the lipid A tail, which contains multiple saturated fatty acyl moieties, is the endotoxic
component of LPS [38]. When LPS is deacylated, it loses its endotoxic properties, indicating
that saturated fats may be responsible for activating the inflammatory cascade associated
with TLR-4 activation [40,54].
Microglia, the central nervous system’s primary innate immune cells, express TLRs
1-9 and are capable of mediating inflammation in response to several different kinds of
stimuli [29]. A primary proposed mechanism for the development of neuronal degradation,
and subsequent neurodegenerative disease, is the over-activation of microglia in producing
persistent, low-level inflammation within the brain. Over-activation of microglia can be
achieved through several different mechanisms. Microglial priming is the hypothesis that
certain stimuli either early on or consistently presented, causes the microglia to be more
responsive and inflammatory when presented with future stimuli. Another consideration is
constitutive activation of TLR-4 through constant ligand recognition, as would be the case
with components of an individual’s diet. A 2009 article published by Milanski et al.,
demonstrated that high fat diet resulted in constitutively activated microglia in the
hypothalamus, as well as increased ER stress [47].
Several studies have addressed the role of saturated fatty acids (SFAs) in activating
TLR-4 in the context of several diseases [33,36,38,39,41-45,47,48,54-57]; however, the role
24
thoroughly addressed. We hypothesized that HFD would increase inflammation in the
hippocampus after only 8 weeks of feeding, Further, loss of TLR-4 will protect against
HFD-induced neuroinflammation.
METHODS AND MATERIALS
Animals and animal care. Weanling, male C3H/HeJ mice containing a naturally-occurring,
loss-of-function TLR-4 mutation, their respective C3H/HeN control mice (NCI, Bethesda,
MD); and C57BL/6J (Jackson Laboratories, Bar Harbor, ME) were housed at the University
of North Carolina Animal Facility, which is fully accredited by the American Association for
Accreditation of Laboratory Animal Care. Animals were housed 4/cage under pathogen-free
conditions and maintained under protocols approved by the Institutional Animal Care and
Use Committee. The mice were randomized to either a high-fat diet (HFD) consisting of a
45% kcal by fat diet with soybean oil and lard as the fat source (D12451, Research Diets) or
a 10% fat diet from the same fat source (D12450B). Water and food were available ad
libitum. Body weights were measured at 6 and 12 weeks of age. After 8 weeks, mice were
killed by rapid cervical dislocation and the brain was removed, quickly dissected and flash
frozen.
Quantitative RT-PCR. Total RNA was isolated using a commercially available acid-phenol
reagent (TRIzol; Invitrogen, Carlsbad, CA). Potential DNase contamination was removed
with Amplification Grade Dnase 1 (Sigma Aldrich, St. Louis, MO). RNA was re-extracted
for purification using phenol: chloroform (5:1) in isoamyl alcohol, chloroform: isoamyl
alcohol (24:1), and re-precipitated using Molecular Grade ethanol (200 proof) and 9M
glycogen. First-strand cDNA reverse transcription was synthesized using a master mix of
25
(Promega), Oligo (dT)15 primers, 10mM dNTP mix, and DEPC-treated water. Thermal
conditions were 42⁰C for 60 min followed by 95⁰C for 5 min, and held at 9⁰C until storage at
-20⁰ C. Quantitative Real-Time PCR (qRT-PCR) was carried out with previously described
TaqMan Assays on Demand Primer Probe pairs (Applied Biosystems, Branchburg, NJ) to
determine the mRNA expressions of GAPDH, IL-1β, IL-6, IL-10, TNF-α, MIF, SOCS-3 in
each tissue fraction for all three mouse strains. In addition, IFN-γ, MCP-1/CCL2,
MIP-1α/CCL3, and RANTES/CCL5 mRNA expression was determined for C3H/HeN and
C3H/HeJ mice. Real-time reactions were carried out on a CFX96 Real-Time System
(BioRad, Hercules, CA) with BioRad CFX Manager using TaqMan Universal PCR Master
Mix (Applied Biosystems). All genes of interest were normalized to GAPDH mRNA
expression.
Microglial Isolation. Microglia were isolated following a previously published method (17).
Briefly, whole brains were removed and homogenized in HBSS. Single cells suspensions
were filtered through 70 μM nylon mesh and centrifuged at 500Xg for 5 min. The cells were
re-suspended in 70% Isotonic Percoll (Sigma) and then layered with 50%, 35% and 0%
isotonic Percoll. The Percoll gradient was centrifuged at 2000Xg for 20min at room
temperature. The microglia layers were located at the 70/50% interphase and were carefully
collected, washed 2 times with HBSS, and finally re-suspended in complete RPMI.
Microglial TNF-α and IL-6 ELISA Immunoassay. Isolated microglia were plated with 1 X
105 cells per well on a 96-well plate. Microglia were incubated with either media, Pam2CSK4 (a synthetic TLR2 ligand), or purified LPS for 16 hours. Supernatants were
collected for quantifying TNF-α and IL-6 protein expression through ELISA assays (R & D
26
Splenocyte TNF-α and IL-6 ELISA Immunoassay. Splenocytes were isolated in
unsupplemented HBSS. Samples were processed into single-cell suspensions by mechanical
agitation of a Stomacher (Seward) and strained througha 40-µM nylon filter. Cells were
subjected to RBC lysis using ACK lysis buffer for 6 min at room temperature, washed, and
counted. Isolated splenocytes were plated 1 X 10⁶ cells per well on a 96-well plate. Splenocytes were incubated with either media, Pam2SCK4, or purified LPS for 48 hours.
Supernatants were collected for qualifying TNF-α and IL-6 protein expression through
ELISA assays (R & D systems).
Flow Cytometry. Previously plated microglia were washed and re-suspended in DMEM, 5%
FBS, and incubated with anti-CD16/32 to block non-specific binding to Fc receptors.
Microglia were then surface-stained with anti-CD11b, CD45, TLR-2, and TLR-4 antibodies
for flow cytometric analysis to determine the Mean Fluorescence Intensity (MFI). Cells are
analyzed using an Accuri Flow Cytometer (Accuri, Ann Arbor, MI) and data analysis is
performed using Flow Jo software (Tree Star, Ashland, OR).
Serum Leptin and Resistin ELISA Immunoassay. To determine markers of obesity status
and leptin resistance, serum leptin and serum resistin were measured by ELISA (R & D
systems) in serum collected from fed mice.
Statistical Analysis. Weight data for C57BL/6 mice were analyzed using a Student’s T test.
Percent weight gain data and qRT-PCR data were analyzed using the Kruskall-Wallis test.
Serum ELISA data were analyzed using 2 way ANOVA with post hoc Students’ T test.
Microglial TNF-α and IL-6 ELISA data were analyzed using 3 way ANOVA with post hoc
27
Microglial TLR-2 and TLR-4 MFI data were analyzed using a Student’s T test, comparing
treatment to media control. All statistical analyses were performed using JMP Statistical
Software (SAS Institute). Values are the mean ± SEM. Data were considered statistically
significant if P < 0.05.
RESULTS
C57BL/6 mice gain significantly more weight on the high fat diet after 8 weeks. After 8
weeks of high fat feeding, C57BL/6 mice gained significantly more weight (p = 0.0002) than
low-fat fed C57BL/6 mice (Figure 2).
C57BL/6 mice have increased neuroinflammation in the hippocampus following a high-fat
diet. In order to assess potential changes in neuroinflammation as an effect of HFD,
qRT-PCR was performed on RNA extracted from hippocampi of C57BL/6 mice fed either a LFD
or a HFD. TNF-α mRNA was significantly increased in the hippocampus of HFD-fed mice
(p = 0.03) as compared to LFD-fed mice (Figure 3A). In addition, IL-10 was significantly
decreased (p = 0.006) in the hippocampus of the HFD-fed mice (Figure 3B). There were no
significant differences in hippocampal mRNA levels of IL-1β, IL-6, MIF, or SOCS-3
comparing LFD-fed and HFD-fed mice (data not shown).
HFD increased TLR-2 and TLR-4 on microglia harvested from C57BL/6 whole brain
tissue. HFD significantly increased the expression of TLR-2 and TLR-4 on microglia
isolated from whole brains compared to LFD-fed mice (Figure 4).
C3H/HeJ mice gained significantly more weight than C3H/HeN mice following a high-fat
diet, corresponding to differences in serum leptin. In order to investigate the potential role
28
utilized C3H/HeJ mice, which have a natural loss-of-function mutation in TLR-4, compared
to C3H/HeN mice, their respective TLR-4 wild-type controls. After 8 weeks on the high fat
diet, both C3H/HeN mice and C3H/HeJ mice gained significantly more weight (p ≤ 0.0001)
(Figure 5A). In addition, HFD-fed C3H/HeJ mice gained significantly more weight (20.8 ±
0.7%) compared to HFD-fed C3H/HeN mice (12.4 ± 0.8%) in respect to LFD-fed controls (p
≤ 0.0001) (Figure 5B). Leptin was significantly increased in the serum of HFD-fed C3H/HeJ
mice, but not in the HFD-fed C3H/HeN serum samples (Figure 5C). The leptin data
corresponds to the weight gain data presented in Fig. 5B. Leptin was also increased in the
C3H/HeN mice; however this increase was not significant.
HFD decreased IL-6 mRNA levels in hippocampi of C3H/HeN mice, but not C3H/HeJ
mice. IL-6 mRNA was decreased (p = 0.05) in hippocampi isolated from HFD-fed
C3H/HeN compared to LFD-fed controls (Figure 6A); however, this dietary effect was not
seen in C3H/HeJ mice. Furthermore, there were no changes as an effect of diet in any of the
pro-inflammatory cytokines tested, including TNF-α (Fig. 6B), IL-1β (Fig. 6C), IL-10,
MCP-1, MIP-1α, or RANTES (data not shown).
HFD decreases MIF mRNA in the hippocampus of C3H/HeN mice, but not C3H/HeJ
mice. MIF transcription was significantly decreased (p ≤ 0.01) in the hippocampus (Figure
7) of HFD-fed CH3/HeN mice compared to LFD-fed controls; however, there was no
difference between HFD-fed C3H/HeJ and LFD-fed C3H/HeJ mice.
HFD decreases SOCS-3 mRNA expression in the hippocampus of C3H/HeN mice, but not
29
HFD-fed C3H/HeN mice, but not in HFD-fed C3H/HeJ mice (Figure 8), indicating a
potential role of TLR-4.
TLR-2 and TLR-4 receptor expression is upregulated following stimulation with LPS in
microglia isolated from HFD-fed C3H/HeN mice in a TLR-4 dependent manner. TLR-2
and TLR-4 surface receptor expression was significantly upregulated (α = 0.05) following
stimulation with purified LPS in microglia isolated from HFD-fed C3H/HeN mice compared
to media controls (Fig. 9A and Fig. 9B). There were no significant differences between LPS
and media stimulation in microglia isolated from LFD-fed C3H/HeN mice, LFD-fed
C3H/HeJ mice, or HFD-fed C3H/HeJ mice. Pam2CSK4, a synthetic TLR-2 ligand, did not
increase TLR-2 or TLR-4 receptor expression in any samples compared to media controls
(Fig. 8C and Fig. 8D).
TNF-alpha production was significantly decreased in microglia isolated from HFD-fed
C3H/HeN mice following LPS and Pam2CSK4 stimulation compared to LFD-fed
C3H/HeN microglia. LPS stimulation increased TNF-α expression in microglia isolated
from both LFD-fed and HFD-fed C3H/HeN mice compared to media stimulated microglial
controls. As expected, LPS did not increase TNF-α in microglia isolated from C3H/HeJ
mice. In C3H/HeN microglia, TNF-α expression was decreased in HFD-fed microglia
compared LFD-fed microglia following LPS stimulation (Fig. 10A). Pam2CSK4 increased
TNF-α expression in microglia isolated from both LFD-fed and HFD fed C3H/HeN mice;
however, there were no significant differences between Pam2CSK4 and media stimulation in
microglia isolated from C3H/HeJ mice. TNF-α expression decreased in microglia isolated
from HFD-fed C3H/HeN mice compared to LFD-fed C3H/HeN mice following Pam2CSK4
30
IL-6 production in microglia isolated from C3H/HeN and C3H/HeJ mice fed either a
low-fat diet or a high-low-fat diet. LPS significantly increased IL-6 in microglia isolated from
LFD-fed C3H/HeN mice compared to media controls. As expected, LPS did not induce IL-6
production from microglia isolated from C3H/HeJ mice. There were no differences in IL-6
expression between LFD and HFD in either C3H/HeN or C3H/HeJ mice following LPS
stimulation (Fig. 10C). Pam2CSK4 significantly increased IL-6 protein expression in both
LFD and HFD-fed C3H/HeN microglia but only LFD-fed C3H/HeJ microglia. There was no
significant difference in IL-6 in microglia isolated from HFD-fed C3H/HeJ. There were no
differences in IL-6 expression between LFD and HFD in either C3H/HeN or C3H/HeJ mice
following Pam2CSK4 stimulation (Fig. 10D).
Effect of HFD-feeding on inflammatory response in isolated splenocytes. TNF-α
production was significantly increased following LPS stimulation in splenocytes from both
LFD-fed and HFD-fed C3H/HeJ mice as compared to media controls. As expected, LPS did
not induce TNF-α production in splenocytes isolated from C3H/HeJ mice. (Fig. 11A).
Pam2CSK4 stimulation significantly increased TNF-α production in all four treatment
groups as compared to media controls; however, HFD did not augment this response (Fig.
11B). LPS stimulation resulted in significantly higher production of IL-6 in HFD-fed
C3H/HeN mice only, indicating a role of TLR-4 in HFD-induced increases in IL-6
production (Fig. 11C). Stimulation with Pam2CSK4 increased IL-6 production only in
C3H/HeN mice only, and there was no effect of HFD-feeding (Fig. 11D).
DISCUSSION
While many studies of the effect of HFD on the brain have focused on the
31
there is a growing body of literature, in both rodents and humans, that points to a role for
obesity and/or the consumption of a diet high in saturated fat on increased
neuroinflammation, memory impairment, and dementia including Alzheimer’s disease
[1,8,9,15,18,19,21-23,25,30,49-51,59-72]. Excessive neuroinflammation caused by
prolonged microglial activation has been hypothesized to play a major role in many
neurological disorders and diseases including AD. The goal of this study was to determine if
relatively short-term feeding of HFD could increase inflammation in the hippocampus. We
found that after 8 weeks of HFD, C57BL/6 mice have increased inflammation in the
hippocampus, as well as increased TLR-2 and TLR-4 receptor expression on isolated
microglia. Several studies have reported that saturated fatty acids (SFA) drive expression of
inflammatory molecules through TLR-4 activation, specifically activation of the
pro-inflammatory transcription factor, Nuclear Factor Kappa-light-chain-enhancer of activated
B-cells (NF-κB) [9,42,44,47,54,73]. Both TNF-α and IL-10 transcription are controlled, in
part, through TLR-4 signaling in microglia [47]. In our study, 8 weeks of HFD-feeding
upregulated both TLR-2 and TLR-4/MD-2 surface expression on microglia isolated from
whole brain from C57BL/6 mice. Though our findings of elevated TLR-2 and TLR-4 in
isolated microglia is not specific to the hippocampal region of the brain, it does indicate that
microglia in the whole brain respond to HFD by upregulating inflammatory surface
receptors. The increase in TLR-2 and TLR-4 receptors on HFD microglia could account for
the increase in TNF-α mRNA expression in the hippocampus.
These findings are important as a very recent study has found that there may be a
critical period for HFD exposure to result in learning and memory impairments [74]. In this