i
THE ROLE OF COBALAMIN IN BIOLOGICAL PHOTOCHEMISTRY
Weston James Smith
A dissertation submitted to the faculty at the University of North Carolina at Chapel Hill in partial fulfillment of the requirements for the degree of Doctor of Philosophy in the UNC Department of Chemistry in the
School of Arts and Sciences.
Chapel Hill 2015
Approved by:
David Lawrence
Marcey Waters
Michel Gagné
Linda Spremulli
iii
ABSTRACTWeston James Smith: The Role of Cobalamin in Biological Photochemistry (Under the direction of David Lawrence)
This dissertation is divided into two parts. The first part describes the development of small molecule drug delivery systems that exploit human erythrocytes as drug carriers and photolabile cobalamin-drug complexes as light activated “switches”. These complexes are activated by energy transfers from long wavelength fluorophores that act as antennae receptive to wavelengths of light that reside in the optical window of tissue. The first of these delivery systems takes advantage of hydrophobic anchors to bind fluorescent antennae and cobalamin complexes to the exterior of erythrocyte membranes and allows the two to interact by free association. The second of these systems appends the fluorophores directly to the cobalamin-drug complexes and these delivery units are loaded to the interior of the red blood cell through hypotonic pore formation. Upon irradiation, these red blood cells release chemotherapeutics.
iv
This work is dedicated to my Grandmother, Hazel Smith, who made encouraging me
her life’s goal. While she did not get the chance to see this milestone, in her mind there
v
ACKNOWLEDGEMENTS
I would like to thank my advisor, David Lawrence for his guidance, under standing, and friendship throughout my graduate tenure at UNC. I deeply appreciate his ability to see the larger picture, willingness to engage in deep discussions (even when we disagree), and his sense of humor. I would also like to thank my committee: Michel Gagné, Christopher Sims, Linda Spremulli, Marcey Waters.
Special thanks to Marissa Cann, Robert Hughes, Finith Jernigan, Christina Marvin, Luong Nguyen, Colin O’Banion, Nathan Oien, Melanie Priestman, Zach Rodgers, Jennifer Shell, Thomas Shell, Liang Sun, Qunzhao Wang, Weichen Xu. I will always be gratefrul for their training, advice, assistance and support, but most of all I will remember their friendship.
vi
TABLE OF CONTENTS
LIST OF TABLES…..………viii
LIST OF FIGURES….………....ix
LIST OF SCHEMES…..………xiii
LIST OF ABBREVIATIONS…..………..…viii
Chapter 1: The Development of Photoactivated Molecules for Biological Study and the Promise of Cobalamin for the Future of the Field. 1.1: A Brief History of the Practice of Photoactivation of Biomolecules………1
1.2: The Problem with Ultraviolet Light………11
1.3: Past and Current Attempts to Develop Relevant Biological Tools Activated with Visible and Infrared Light……….……….14
1.4: Cobalamin Photochemistry………17
1.5: The Principle of Cobalamin Regulated Biological Activity………17
1.6: Cobalamin Allows Access to the Opitical Window of Tissue………19
1.7: References………..…22
Chapter 2: Membrane Mediated Assembly of Near IR Activated Phototherapeutics 2.1: Background………26
2.2: Design and Synthesis of Anchored Compounds……….28
2.3: Measuring a Light Dependent Change in Hydrophilicity of Lipid Tethered Molecules………28
2.4: Demonstration of Small Molecule Loading and Release From Erythrocyte Membranes……….33
2.5: Products of C18-Cbl-Drug Photolysis………..43
2.6: Delivery of Drugs Via Photolysis from Erythrocyte Membranes………..43
2.7: Demonstration that C18-Cbl-Drugs do not “Jump“ from Erythrocytes………..43
vii
2.9: Fluorophore Release from Erythrocytes by Long Wavelength Energy Transfer………49
2.10: Drug Release from Erythrocytes by Long Wavelength Energy Transfer………61
2.11: Using Long Wavelength Light to Release Drugs into HeLa Cells……….61
2.12: Conclusion………...61
2.13: Materials and Methods………..67
2.14: References……….101
Chapter 3: Erythrocyte Loaded Near IR Activated Phototherapeutics 3.1: Background………..104
3.2: Design and Synthesis………107
3.3: Photolysis Products of Cbl-MTX and Cbl-COL. ………110
3.4: Light Induced Dosage of Erythrocyte Delivered Drugs to HeLa Cells………..117
3.5: Conclusion………...117
3.6: Future work………..117
3.7: Materials and Methods………..121
3.8: References………...128
Chapter 4: Development of a Src Kinase Sensor that is Sequestered In Cellular Membranes Until Exposed to Green Light 4.1: Background………..131
4.2: Selection of a Src Substrate………136
4.3: Hydrophobic Membrane Anchors………..136
4.4: Products of C12-Cbl-Src and C18-Cbl-Mal-Src Photolysis………..145
4.5: Photolysis Induced a Change in Hydrophobicity of Peptide Substrate………150
4.6: Erythrocyte Ghosts as Model Membranes………...152
4.7: Membrane Affinity of Anchored Peptides………155
4.8: Determination of Enzyme Kinetics of a Src Substrate on and off the Membrane………156
4.9: Treatment of HeLa Cells with C18-Cbl-Mal-Src………173
4.10: Attempts to Penetrate the Cellular Membrane………..176
4.11: Conclusion……….176
viii
4.13: References……….193
Chapter 5: Engineering Green Light Regulated Protein Kinase A Activity 5.1: Background………..198
5.2: Design of a “Caged” PKA Activated by Green Light. ………205
5.3: Monitoring PKA Activity by Deep Quench………210
5.4. Free Inhibitor Effect of Nonconjugated 5c on PKA……….213
5.5: Enzyme Caging Reaction……….……….213
5.6: Optimization of Enzyme Caging Reaction………218
5.7: Conclusion………...225
5.8: Materials and Methods………..226
ix
LLIST OF TABLES
Table 2.1. Elution times and masses of C18-Cbl-MTX, C18-Cbl-COL, and C18-Cbl-DEX. ………41
Table 2.2. Elution times and detected masses of the photocleavage products for C18-Cbl-MTX, C18-Cbl-COL, and C18-Cbl-DEX. ……….………..41
Table 2.3. Power output of each of LED arrays from Figure 2.20………50
Table 2.4. Elution times for fluorophore assisted photocleavage products of C18-Cbl-MTX and C18-Cbl-COL……….……….58
Table 2.5. Solvent gradient used for preparative HPLC to purify C18-Cbl-MTX, C18-Cbl-DEX, C18-Cbl-COL,fC18-Cbl-TAM, and C18-Cbl-FAM. ………79
Table 2.6. Gradient used for LC-MS analysis of C18-Cy5 and C18-Cy7..……….………89
Table 2.7. Gradient used for LC-MS analysis of C18-DY800 and intermediates. ………89
Table 2.8. The solvent gradient used for analytical MTX, COL, and DEX LC-MS assays.………91
Table 3.1. Observed masses of Cbl-MTX and Cbl-COL before and after photocleavage.………116
Table 3.2. Solvent gradient used for preparative HPLC to purify Cy5-Cbl-DOX..………124
Table 3.3. Solvent gradient used for the detection of photolyzed species of Cbl-MTX and Cbl-COL……….……….125
Table 4.1. The masses of species found by mass spectrometry after various periods of photolysis of C12-Cbl-Src and C18-Cbl-Mal-Src.………..……….146
Table 5.1. The slopes of fluorescent response from enzymatic activity obtained by deep quench from Figure 5.9………..………220
x
LIST OF FIGURES
Figure 1.1. A photoisomerizable inhibitor of a Na+ ion channel. ………4
Figure 1.2. Muscle fibers were triggered to relax by flash photolysis……….………6
Figure 1.3. Caged Signal Transducers cAMP and Ca2+.………..8
Figure 1.4. A practical application of photoactivated fluorescence. ………9
Figure 1.5. Various caging agents available in the early 1990s. ………10
Figure 1.6. A demonstration of the versatility and widespread use of the o-nitrobenzyl caging group.….12 Figure 1.7. Prominent examples of peptide photochemistry. ………13
Figure 1.8. Visualization of the optical window of tissue. ………..15
Figure 1.9. Selected visible wavelength to NIR caging groups……….16
Figure 1.10. The role of cobalamin in the mechanism of methylmalonyl coenzyme A mutase………18
Figure 1.11. Cobalamin sequestered small molecules………20
Figure 2.1. An a priori selected wavelength of drug release……….27
Figure 2.2. Lipidated Cbl-reporters, TAM (C18-Cbl-TAM) and FAM (C18-Cbl-FAM) and lipidated Cbl-drug conjugates, MTX (C18-Cbl-MTX), COL (C18-Cbl-COL), and DEX (C18-Cbl-DEX) ……….……29
Figure 2.3. Structure of C18 conjugated fluorophores used in Chapter 2………30
Figure 2.5. Light induced migration of MTX from octanol to water……….32
Figure 2.6. Light dependent realse of TAM from Erythrocytes loaded with C18-Cbl-TAM………34
Figure 2.7. Structural integrity of erythrocytes exposed to various concentrations of lipidated drugfconjugates for 14 h……….35
Figures 2.8. Drug loading onto and release from human erythrocytes………36
Figure 2.9. Quantification of drug loading and photo-release………37
Figure 2.10. The standard curves for MTX, COL, and DOX LC-MS Assays………38
Figure 2.11. Erythrocyte-released photoproducts of C18-Cbl-MTX, C18-Cbl-COL and C18-Cbl-DEX……40
Figure 2.12. Inhibition of DHFR by MTX and photolyzed erythrocyte-bound C18-Cbl-MTX………42
Figure 2.13. Assessment of MTX photo-release with 525 nm light from C18-Cbl-MTX-loaded erythrocytes. ………..44
xi
Figure 2.15. Effect of photo-released COL from erythrocyte-bound C18-Cbl-COL. ………46
Figure 2.16. Effect of DEX on the subcellular location of GRα in HeLa
cells. ……….47
Figure 2.17. Effect of photo-released DEX from erythrocyte-bound C18-Cbl-DEX on the
subcellular location of GRα in HeLa cells. ……….47 Figure 2.18. Assessment of C18-Cbl-DEX transfer between the erythrocyte and HeLa cell membranes.…48 Figure 2.19. LED boards used in Chapter Two. ……….50
Figure 2.20. Heat map of TAM release from erythrocytes. ………51 Figure 2.21. Photo-release of TAM from C18-Cbl-TAM/C18-fluorophore-loaded erythrocytes…….………52 Figure 2.22. Release of FAM from erythrocytes loaded with C18-Cbl-FAM/C18-fluorophores………53 Figure 2.23. Release of TAM from erythrocytes loaded with C18-Cbl-TAM/C18-fluorophores. ………54 Figure 2.24. Release of TAM from erythrocytes loaded with C18-Cbl-TAM (1 µM) as a function
of photolysis ftime...………...55 Figure 2.25. Release of FAM from erythrocytes loaded with C18-Cbl-FAM (1 µM) as a function
of photolysisftime………...56
Figure 2.26. Confocal images of erythrocytes loaded with C18-Cy5………57 Figure 2.27. Release of MTX from C18-Cbl-MTX/C18-fluorophore-loaded erythrocytes………59 Figure 2.28. Release of COL and DEX from C18-Cbl-COL/C18-fluorophore-loaded
erythrocytes and C18- Cbl-DEX/C18-fluorophore-loaded erythrocytes.……….60 Figure 2.29. DEX release from C18-Cbl-DEX/C18-Cy5-loaded erythrocytes at 660 nm
triggers HeLa cell GRα nuclear localization.……….………62 Figure 2.30. Wavelength selective release of DEX from erythrocyte-bound C18-Cbl-DEX
and the effect on GRα subcellular location. ………62 Figure 2.31. Quantitation of the effect of DEX release from C18-Cbl-DEX/C18-Cy5-loaded
erythrocytes onfGRα subcellular location in HeLa cells. ………63 Figure 2.32. COL release from Cbl-COL/C18-DY800 erythrocytes at 780 nm initiates
HeLa microtubule depolymerization………..64 Figure 2.33. Long wavelength release of COL from erythrocytes……….…65 Figure 2.34. MTX release from C18-Cbl-MTX/C18-Cy7-loaded erythrocytes at 725 nm………66
Figure 2.35. LC-MS UV/Vis chromatograms of purified C18-Cbl-MTX, C18-Cbl-COL, and
xii
Figure 2.37. LC-MS UV/Vis chromatogram of purified C18-Cy7. ……….82
Figure 2.38. LC-MS UV/Vis chromatograms of purified chloro-DY800. ………85
Figure 2.39. LC-MS UV/Vis chromatogram of purified C18-DY800. ………..88
Figure 3.1 . Demonstration of EryDex drug delivery system. ……….106
Figure 3.2. Cobalamin gated RBC drug delivery. ……….……….………108
Figure 3.3. Cobalamin drug conjugates, Cbl-MTX, Cbl-COL, and Cy5-Cbl-DOX. ……….109
Figure 3.4. Structure of Cbl-MTX and Cbl-COL after photolysis. ……….………115
Figure 3.5. Assessment of MTX photo-release using 525 nm light from Cbl-MTX-loaded erythrocytes. ……….……….……….………..118
Figure 3.6. Quantification of optical densities shown in Figure 5 for the CESTA. ………..119
Figure 3.7. The effect of 525 nm photolysis on HeLa cells coincubated with Cbl-COL loaded erythrocytes. ……….……….……….………..120
Figure 4.1. A small snippet of a tyrosine kinase is shown with a nitrobenzyl moiety appended to the crucialfp-hydroxyl group of the tyrosine residue.….……… …….…….……….…..131
Figure 4.2. Illustration of substrate activation by photolysis from a membrane….……….……….136
Figure 4.3. The peptide substrates chosen for cobalamin coupling….……….……….…….136
Figure 4.4. Proposed cobalamin based cellular membrane anchors using DMPE, DSPE, and DOPE….……….……….……….……….……….……140
Figure 4.5. The structures of Chol-Cbl (4e) and C18-Cbl (4f) ….……….……….…………141
Figure 4.6. Photolysis of C18-Cbl-Mal-Src by HPLC. ….……….……….……….…149
Figure 4.7. Fluorescent increase of C18-Cbl-Mal-Src upon photolysis….……….……….…151
Figure 4.8. Light induced migration of TAMRA from octanol to buffer….……….……….153
Figure 4.9. Visualization of light dependent migration from octanol to water Mal-Src-Pep….………154
Figure 4.10. Assessment of Src peptide loaded onto red blood cell ghosts….……….……….157
Figure 4.11. Demonstration of light proportional release from erythrocyte membranes….………158
Figure 4.12. Membrane bound peptide is inversely proportional to peptide in solution….……….159
Figure 4.13. Light dependent release of Src peptide from erythrocyte ghosts as measured by LC-MS….……….……….……….……….……….…...160
Figure 4.14. Light dependent release of Src peptide from HepG2 cells as measured by LC-MS….……….……….……….……….………161
xiii
Figure 4.16. Dual substrate Src kinase assay between 4h and (photolyzed/intact)
C18-Cbl-Mal-Src….……….……….……….……….………164
Figure 4.17. Confirmation of Src kinase activity in the presence of red blood cell ghosts. ….…………..166
Figure 4.18. The maximum extent of phosphorylation of C18-Cbl-Mal-Src in the presence of erythrocyte ghosts…….……….……….……….……….……167
Figure 4.19. Src kinase time point assay with ghosts interference with enzyme quench….……….169
Figure 4.20. Src kinase time point assay with enzyme quenching cocktail….……….……….170
Figure 4.21. Src kinase time point assay with enzyme quenching cocktail and 0.1% BSA washes….……….……….……….……….……….….……..172
Figure 4.22. Non-cytosolic distribution of C18-Cbl-Mal-Src….……….……….……….174
Figure 4.23. Non-cytosolic distribution of C18-Cbl-Mal-Src by confocal microscopy….……….…174
Figure 4.24. C18-Cbl-Mal-Src loading and photolysis from HeLa cell membranes….……….…….175
Figure 4.25. CPPs synthesized to ferry C18-Cbl-Mal-Src into the cytoplasm of HeLa cells….………178
Figure 4.26. Demonstration of CPP cellular distribution by fluorescent microscopy….……….….179
Figure 4.27. SOK peptide fails to assist in cytoplasmic distribution of our fluorescent Src substrate….……….……….……….……….……….…… 180
Figure 4.28. Pep1 fails to assist in cytoplasmic distribution of our fluorescent Src substrate. ….…………181
Figure 4.29. An image of the 525 nm photolysis chamber………188
Figure 4.30. Beers law plot of Mal-Src-Pep….……….……….……….………..190
Figure 5.1. The structure of PKA caging agent from Lee et al………202
Figure 5.2. Structure of caging agent 5c. ………206
Figure 5.3. A general schematic of the process of caging cyclic AMP dependent protein kinase………207
Figure 5.4. The catalytic subunit of PKA is shown. ………209
Figure 5.5. Demonstration of the PKA-catalyzed fluorescent increase using Deep Quench. ………212
Figure 5.6. Demonstration of the method of rate determination for modified PKAc by Deep Quench………..………...214
Figure 5.7. The structure of the DTT-Inhibitor conjugate, 5e………..215
Figure 5.8. Wild type activity compared to enzymatic activity in the presence of 5e………216
Figure 5.9. The fluorescent response of two modified enzymes by Deep Quench………….………..217
xiv
Figure 5.11. The first 20 s of PKA activity resulting from four different coupling reactions
xv
LIST OF SCHEMES
Scheme 1.1. Bio-orthogonal form of ATP………2
Scheme 1.2. Mechanism of o-nitrobenzyl cleavage. ………3
Scheme 2.1. Mechanism and products of alkyl cobalamin photolysis. ………39
Scheme 2.2. The structure and synthesis of C18-modified Cbls 2a, 2b, and 2c. ………68
Scheme 2.3. Synthesis and purification of C18-Cbl-MTX. ………..71
Scheme 2.4. Synthesis of C18-Cbl-COL. ………..72
Scheme 2.5. Synthesis of C18-Cbl-DEX. ………..74
Scheme 2.6. Synthesis of C18-Cbl-TAM. ……….77
Scheme 2.7. Synthesis of C18-Cbl-FAM. ……….78
Scheme 2.8. Synthesis of C18-Cy5 and C18-Cy7. ………80
Scheme 2.9. Synthesis of DY800 fluorophore. ………83
Scheme 2.10. Synthesis of C18-DY800……….86
Scheme 3.1. Structure and synthesis of Cbl-MTX. ……….……….…………111
Scheme 3.2. Design and synthesis of Cbl-COL. ……….……….………112
Scheme 3.3. Design and synthesis of 2e. ……….……….………113
Scheme 3.4. Design and synthesis of Cy5-Cbl-DOX. ……….……….………114
Scheme 3.5. Structure and synthesis of 3a and 3b. ……….……….121
Scheme 3.6. Structure and synthesis of 3c. ……….……….………122
Scheme 3.7. Structure and synthesis of 3d. ……….……….………123
Scheme 4.1. The synthesis of C12-B12-succinate (4c). ………138
Scheme 4.2. The synthesis and structure of C18-B12-maleimide 4g. ………142
Scheme 4.3. The synthesis and structure of C12-Cbl-Src………143
Scheme 4.4. The synthesis and structure of C18-Cbl-Mal-Src. ……….144
Scheme 4.5. Photolysis products for C12-Cbl-Src. ………..…147
Scheme 4.6. The structure and synthesis of 4i……….183
xvi
Scheme 4.8. Structure and Synthesis of 4f……….185
Scheme 5.1 The earliest caged enzymes………...199
Scheme 5.2. Mechanism of the Deep Quench assay……….………….211
Scheme 5.3. Mechanism of amide backbone scission by free radicals. ………224
Scheme 5.4 The structure and synthesis of 5a and 5b. ………..227
xvii
ABBREVIATIONS
5-FAM – 5-Carboxy Fluorescein
5-TAMRA – 5-Carboxy Tetramethylrhodamine A – Alanine
Abs. - Absorbance Ac – Acyl moiety
ATP - Adenosine Triphosphate a.u. – Arbitrary Units
B12a – Hydroxocobalamin Hydrochloride BSA – Bovine Serum Albumin
Br - Bromine C – Cysteine Calcd. - Calculated
cAMP – Cyclic Adenosine Monophosphate Cbl - Cobalamin
CDT – Carbonylditriazole
CE-LIF – Capillary Electrophoresis – Laser Induced Fluorescence cGMP – Cyclic Guanosine Monophosphate
Cha – Cyclohexylalanine
CIB1 – Calcium and Integrin-Binding Protein Co – Cobalt
xviii
DEX - DexamethasoneDIPEA – Diisopropylethylamine DHFR – Dihydrofolate Reductase
DMEM – Dulbecco’s Modification Eagle Medium dH2O – Deionized Water
DMF – N,N-Dimethylformamide DMSO – Dimethylsulfoxide
DMPE – 1,2-Dimyristoyl-Glycero-3-Phosphoethanolamine DOPE - 1,2-Dioleoyl-Glycero-3-Phosphoethanolamine DS - Dasatinib
DSPE - 1,2-Distearoyl-Glycero-3-Phosphoethanolamine DTT – Dithiothreitol
E - Glutamic Acid EDA – Ethylene Diamine EDT – Ethane Dithiol EtOH – Ethanol eq. - Equivalents F – Phenylalanine
FAD – Flavin Adenine Dinucleotide Fmoc – Fluorenylmethyloxycarbonyl Fract. - Fraction
G – Glycine
g – Force of Gravity
GAPDH - Glyceraldehyde 3-Phosphate Dehydrogenase GSH - Glutathione
H – Histidine
xix
H - HydrogenHCl – Hydrochloric Acid
HCTU – 2-(6-Chloro-1H-benzotriazole-1-yl)-1,1,3,3-tetramethylaminium hexafluorophosphate HPLC – High Pressure Liquid Chromatography
HSA – Human Serum Albumin I – Isolucine
IC50 – Half Maximal Inhibitory Concentration in – Inch
Int. - Intensity K – Lysine
LC-MS – Liquid Chromatography with Mass Spectrometer Detection LED – Light Emitting Diode
M - Molar Mal – Maleimide MeOH - Methanol Mg – Magnesium min – Minutes mM – Millimolar mol – Mole
MTX- Methotrexate N – Asparagine N - Nitrogen
NEM – N-ethylmaleimide nm – nanometer
nM – nanomolar Orn – Ornithine
xx
PhyB – Phytochrome BPIF3 – Phytochrome Interacting Factor 3
PKA – Protein Kinase A / cAMP Dependent Protein Kinase PKG – Protein Kinase G / cGMP Dependent Protein Kinase PKI – Protein Kinase Inhibitor
PMSF – Phenylmethanesulfonylfluoride RA – Rheumatoid Arthritis
RBC –Red Blood Cell r.t. – Room Temperature Rxn – Reaction
s – Seconds S – Serine
SDS – Sodium Dodecyl Sulfate SH2 – Src Homology 2
T – Threonine
TBST – Tris Buffered Saline and Tween 20 TIS – Triisopropylsilane
Tris – Tris(hydroxymethyl)aminomethane TFA – Trifluoroacetic Acid
TSTU - O-(N-Succinimidyl)-N,N,N′,N′-tetramethyluronium tetrafluoroborate µ - Micro
v/v – volume/volume WT – Wild Type w/v – weight/volume Y – Tyrosine
1
Chapter 1: The Development of Photoactivated Molecules for Biological Study and the Promise of Cobalamin for the Future of the Field.
1.1. A Brief History of the Practice of Biomolecular Photoactivation
In the years leading up to 1978, Joseph Hoffman realized that a significant barrier to studying enzymatic activity in intracellular environments would be the need to deliver bioactive molecules into a functionally complete system in such a way that they would be functionally inert until a measurement could be made1. Previous work dating back to the 1960’s had used light to expose key functional groups of various small biomolecules2,3. By appending one of these photoprotecting groups to the γ-phosphate of adenosine triphosphate (ATP), Hoffman generated what he called “caged ATP” wherein the molecule was rendered unusable to an ATP dependent Na, K ion channel until he irradiated it with 340 nm UV light (Scheme 1.1). Demonstrating this further caged ATP was encapsulated in erythrocyte ghosts and photolyzed to instantly activate the membrane bound ion channels “upon command”, a feat that could not have been accomplished without the aid of photochemistry1. This demonstration of exquisite temporal control would open up a new field of biology that would allow chemists to directly control the systems they wanted to study using rapid photochemical reactions.
2
3
4
Figure 1.1. (a) A photoisomerizable inhibitor of a Na+ channel is inactive in its relaxed trans configuration. Upon excitation with 360 nm light, the azobenzene moiety transitions into a cis configuration on the ms time scale. (b) By exciting when the ion channel was active the researchers confirmed that the inhibitor could bind to the open channel. If the mechanism of binding had been stabilization of the closed confirmation, photolysis would have not caused a change in voltage of an active channel4.
Reprinted with permission from Lester, H.; Krouse, M; Nass. M; Wassermann, N.; Erlanger, B. Light-activated drug confirms a mechanism of ion channel blockade. Nature. 1979 280 (9), 509-510..© 1979 Nature Publishing Group.
5
A very short time after azobenzene derivatives were found to be useful in the study of membrane action potentials, “caged” ATP also found biological relevance in the study of muscle contraction. Muscle fibers were stripped of their membranes and incubated with “caged” ATP. The bio-orthogonal nature of the non-photolyzed construct allowed full equilibrium to be reached within muscular myofibrils. Brief flashes with lasers rapidly “uncaged” significant amounts of ATP within the fibers, which must hydrolyze it in order to relax. Thus upon photolysis, the muscle fiber would relax until the researchers washed away ATP and replaced it with the “caged” derivative. By allowing the researchers to choose time T0 for their experiments there were no artifacts in their measurements from the rate of diffusion and they could effectively gauge the rates of muscular relaxation and contraction due to consumption of ATP6 (Figure 1.2).
Half a decade after its inception in the late seventies, the field of biological photochemistry was still limited to one photocleavable molecule and a small class of photoisomerizable inhibitors that were largely restricted to studying ion channels. The early successes of “caged” ATP and azobenzene inhibitors had proven the utility of being able to “instantaneously dose” a biological system with a desired reagent. It was well known that cellular signal transduction often happened through instantaneous and transient “bursts” of ions or small molecules. The desire to mimic these characteristic would lead to the first light controlled signaling pathways7.
6
Figure 1.2. Muscle fibers were incubated with 5 mM ATP to keep them in a relaxed state. After washing away ATP and replacing it with “caged” ATP, the fibers stiffened (top) and the contractile force of the muscle increased (bottom). Because muscle fibers consume ATP in order to relax, a laser pulse in the presence of 5 mM “caged” ATP triggered the fiber to relax and the kinetics of this process could be properly studied. Surprisingly, in the presence of calcium, the laser pulse triggered the opposite effect and intense transient contractile force was generated6. Without the ability to permeate the fiber with quiescent form of ATP, the tissue would move differentially at the rate of perfusion, creating an artificial motion that had nothing to do with its biological design.
Reprinted with permission from Goldman, Y.; Hibberd, M.; Trentham D. Relaxation of rabbit psoas muscle fibres from rigor by photochemical generation of adenosine-5'-triphosphate. J Physiol Lond. 1984 354, 605-624.© 1984 The Physiological Society.
ATP Washed Away “Caged” ATP
7
Two years later, Roger Tsien and Robert Zucker described a calcium chelator with a 160 nM affinity for calcium ions that showed a 40 fold drop in binding affinity upon photolysis. Calcium is normally sequestered in intracellular organelles such as the endoplasmic reticulum. Previously used methods relied on secondary effects of cell stimulus or toxins to release calcium into the cytoplasm or ionophores to carry calcium across the outer membrane (also toxic). Tsien was able to microinject calcium bound to his photolabile chelator and create a bio-orthogonal reservoir of calcium that remained inactive until exposed to light (Figure 1.3). This gave biologists absolute control over spikes in intracellular calcium that more accurately resembled a biological cascade9. Both Tsien and Zucker would go on to describe other examples of neurological activation using this elegant approach that could mimic the cell’s own signaling mechanisms as opposed to previously utilized ion channel blockers and other toxins10,11.
In 1989 Timothy Mitchison decided to use the nitrobenzyl moiety to create profluorescent molecules that could only be visualized via flash photolysis, inventing a new method for visualizing intracellular motion. Before photoactivation of fluorescence (PAF) imaging, movement was visualized by photobleaching fluorescently labeled biomolecules and monitoring for the reappearance of fluorescence over time. PAF allowed one to visualize a small portion of fluorescently labeled biomolecules to observe against a dark background, allowing the researcher to track their movements with far greater signal to noise ratios than previously possible. These were of great use in studying tubulin12,13 and actin14 dynamics in living cells (Figure 1.4). These studies mark one of the first exploitations of both spatial and temporal control afforded by photoactivation.
8
9
Figure 1.4. (top) Phase contrast image of neural axon. (middle) Photolyzed fluorescein labeled tubulin polymerized into microtubules. Tubulin is seen migrating down the axon toward the dendrite body of the neuron (time after photolysis is marked on the figure in minutes). (bottom) Structure and photolysis of “caged” fluorescein.
10
11
Despite the growing number of photoactivating groups, the popularity of the nitrobenzyl caging group became more wide spread due to the simplicity of the chemistry involved, the predictable and reliable photochemistry, and the fact that other caging groups offered little improvement. Regardless of whether one wanted to deprotect using a nitrene18 or end up with an indole19 the wavelength of activation was always limited to 350-365 nm (or even shorter)15. This was not such a draw in the 90’s as whole animal experiments were not as common place as they are today. The lack of tissue penetration afforded by UV light was not yet of great concern and the number of nitrobenzyl mediated caged compounds ballooned. Over 10 years after the first signaling molecules were caged (cAMP and cGMP) the literature was becoming populated with a diverse array of caged signal transduction agonists, some of which are represented in Figure 1.620. It was becoming clear that photoactivation of enzymatic agonists was the closest analogue to their natural release in biological systems.
The 90’s saw a blossoming of biological photochemistry into a field that could make real contributions in the elucidation of biological mechanism and function within living cells. Hoffmann’s caging principle was finding broad utility in the study of signaling pathways. The increased availability of microscopes that could selectively photolyze part of a cell allowed more researchers to exploit the potential of spatial control of photoactivation15,21. The increased accessibility and scope of solid phase peptide synthesis would allow for kinase and protease substrates that were inactive until photolyzed and light mediated peptide protein interactions. A nitrobenzyl moiety can be appended onto an amino acid either on a side chain22 or as part of the backbone23 and be incorporated into the peptide without any significant deviation in synthetic procedure22-24 (Figure 1.7). Together these two innovations would bring the field of biological photochemistry into the modern era.
1.2. The Problem with Ultraviolet Light
Despite their great versatility, nitrobenzyl derivatives are limited by the fact that they all require UV light to change the biological activity of a biomolecule. Many have seen this limitation as a benefit in that cells can be monitored using visual wavelengths without any effect on caged molecules12. While this is a great convenience to the cellular biologist, it ties the hands of those who wish to do in vivo work or simply study cells in any environment closely resembling living tissue. It is well established that only
12
Figure 1.6. A sample of bioactive molecules that were “caged” in the 90’s. The nitrobenzyl moiety is, as of this writing, by far the most commonly used chemical group for photoactivation20.
13
Figure 1.7. Prominent examples of peptide photochemistry. (a) Kinase substrates can be unavailable for phosphorylation until illuminated with UV light by appending a nitrobenzyl moiety on the site of phosphoryl transfer25. (b) A nitrobenzyl moiety attached to the fmoc-protected amine of an amino acid will protect the resulting peptide backbone from proteolysis23. (c) A nitrobenzylic amino acid can be incorporated into a peptide to make a photocleavable backbone26.
a)
b)
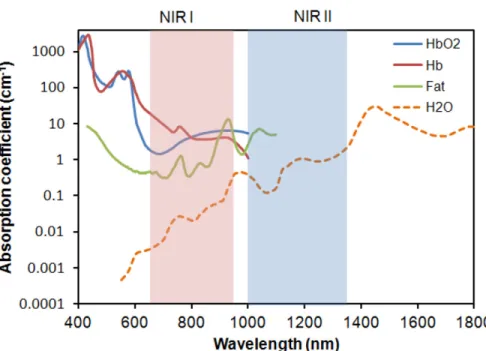
14
longer wavelengths of light have the ability to penetrate deeper into living tissue due to light scattering and the inner filter effect of biomolecules at short wavelength. This is known as the optical window of tissue. Shorter wavelengths are absorbed and scattered while wavelengths longer than 1000 nm are absorbed by water27 (Figure 1.8). Furthermore this inner filter effect is not simply a benign nuisance that can be compensated for by increasing the power of the light source. Molecules excited by UV light can produce radicals that damage cellular components or simply become bleached and useless to their host, thus perturbing the system in uncontrolled ways28. The desire to avoid unintentional perturbations is what leads many to use caged compounds in the first place.
In an attempt follow the leading edge of research into living animals, there has been an extensive effort to add to the usable wavelengths of photolysis to the molecular biologist’s toolkit for caging compounds. One such method is use of “two-photon” chemistry that focuses an intense beam of light so concentrated that a molecule can absorb two photons nearly simultaneously. When this happens it has the effect of absorbing one photon of half the wavelength. What this means is that a nitrobenzyl group that absorbs maximally at 350 nm could be excited using a very intense beam of 700 nm light. This is done by applying short bursts of very high intensity light (typically each pulse has a power of over 1000 W) and focusing the light on as small an area as possible. This creates a small three dimensional space within which a molecule of interest can be excited. Unfortunately not every molecule has a usable two photon cross section and the most commonly used caging agents function poorly under these conditions so new photoprotecting groups have had to be synthesized. The kinetics of photo release mediated by two photon processes are not as easy to control as the relationship between increased illumination power and photolysis is non-linear. As a result significant single photon sample heating is often observed with this method29,30.
1.3. Attempts to Red Shift the Wavelengths of Photoactivation
15
Figure 1.8. Visualization of the optical window of tissue. The visible and Near Infrared (NIR) absorbance of a 1 cm barrier of blood (blue line), deoxygenated blood (red line), fat (green), and water (orange dots).
16
17
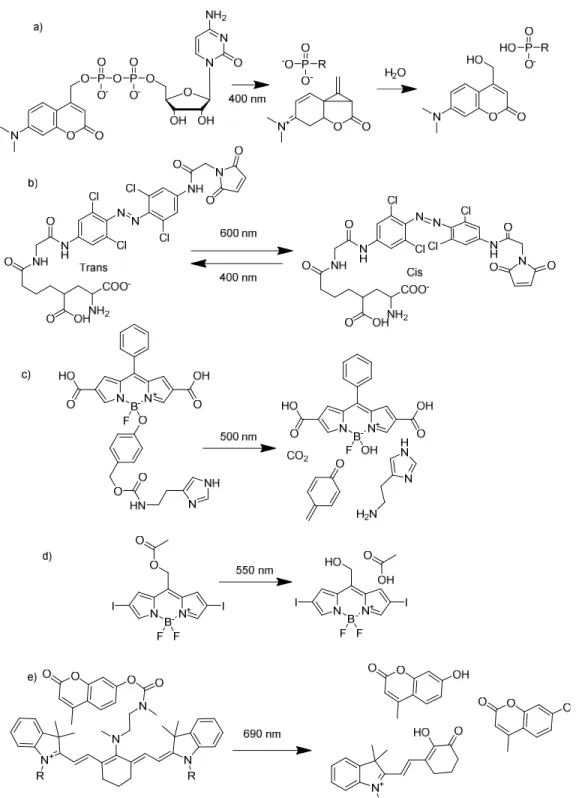
Wooley and colleagues recently discovered that ortho substituents on the azobenzene photosystem extend its isomerization potential into the red (2014)33. Bodipy fluorophores have been shown to release functional groups similarly to the coumarin derivatives using green light (2014)34,35. Cyanine dyes have recently been shown to photobleach in a manner that can deprotect functional groups using red light (2014)36. Finally the recently discovered upconverting nanoparticles have made it possible to excite a system with 960 nm light and emit photons in the UV spectrum. Researchers recently used this phenomenon to use infrared light to release an HIV drug using nitrobenzyl derivatives (2014)37.
1.4. Cobalamin Photochemistry
As far as we know, Vitamin B12 (or cobalamin) is essential for every living animal on earth. The species that do not synthesize it must get it from their diet38. It is the most complicated of all the essential vitamins and is used primarily for carbon skeletal rearrangements. As such it is used by life as a controlled source of carbon centered radicals (Figure 1.10). In biology these are generated in sudden conformational changes in the enzymes containing the cofactor39. However, a convenient side effect of this is a willingness to undergo homolytic cleavage of the cobalt carbon bond upon excitation with any light that the cobalamin can absorb. At the time our work began, the longest wavelength anyone had reported for photocleavage of a caging group was around 450 nm40. Since alkyl cobalamins absorb at wavelengths as long as 577 nm, they seemed like an attractive option for extending the wavelengths of photoactivation out of the blue spectrum.
Given the complexity of the B12 complex, it is surprisingly simple to functionalize. Reduction with zinc creates a nucleophilic Co(I) species that reacts very readily with alkyl halides. Activation by carbonyl ditriazole allows amines to be linked to the 5’ –OH of the cobalamin ribose, forming a carbamate. Anything attached via the Co-C bond is cleaved away upon irradiation with light, and anything attached to ribose remains attached to the cobalamin. These two simple reactions form the basis of all of the caged compounds we have been able to create.
1.5. The Principle of Cobalamin Regulated Biological Activity
18
19
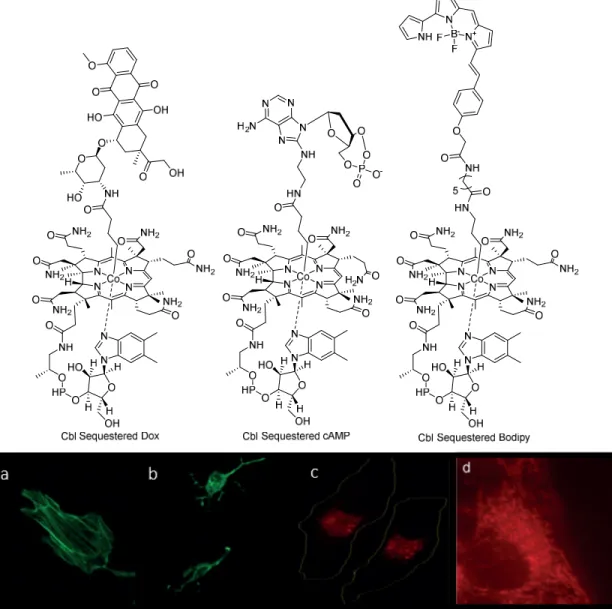
bio-orthogonal to bioactive or a key functional group modification that is reversed upon photolysis, one can think of a caged molecule as inactive or quiescent. Looking at Figure 1.11, we see the work of Dr. Thomas Shell et al. in the attempt to “cage” doxorubicin, cAMP, and a Bodipy fluorophore41. One would think that the size of the appended B12 alone would be sufficient to disrupt the interaction between the small molecule and any endogenous targets. However, it was found that cAMP tethered to cobalamin is still capable of activating PKA. However, none of these three molecules is able to achieve their biological function in cell culture in the absence of photolysis because of the sequestration effects of cobalamin trafficking inside cells38.
Cobalamin remains inside of endosomes in living cells until removed via active transport, which may or may not recognize a particular modified cobalamin42,43. Therefore each of these compounds were trapped, endosomally, away from their targets until illumination caused the Co-C bond to break. So instead of caging the compounds, cobalamin sequesters them by dominating their cellular fate until photolysis releases them from the endosomal compartment they were trapped inside of. So in this sense we have not made cobalamin into a caging group but a photolabile sequestering group. As such we had to think beyond the old caging group paradigm in order to find practical applications for our new system.
This begs the question of why go to the trouble of using a system that operates on a fundamentally different principle than all previous photoprotecting groups? What is the advantage in generating a carbon based radical over heterolytic cleavage of an oxygen or a thiol? For one, radicals can do things that anions (the typical leaving group in a caged compound) cannot. Alkyl radicals can abstract a hydrogen from their environment to release alkyl chains instead of heteroatoms. We have found that in a biological context this happens for the majority of cleavage events and have shown that this is a useful function in the release of small hydrophobic drugs such as colchicine44. Homolytic cleavage can cause damage, which can be negligible45 or devastating46 depending on how the concentration of radicals and the photolysis conditions (factors controlled by the researcher). However, beyond radical generation, the true gain of this system is the fluorescent antenna effect.
1.6. Cobalamin Allows Access to the Opitical Window of Tissue
20
Figure 1.11. Cobalamin sequestered small molecules. (top) The structure of three cobalamin sequestered small molecules: Doxorubicin, cAMP, and Bodipy 650. (a) HeLa cells in the presence of Cbl sequestered cAMP. (b) HeLa cells after photolysis of Cbl sequestered cAMP. (c) Bopidy trapped in endosomes before photolysis. (d) Bodipy migrates to mitochondria after photolysis.
Reprinted with permission from Shell, T.; Shell, J.; Rodgers Z.; Lawrence, D.Tunable Visible and Near-IR Photoactivation of Light-Responsive Compounds by Using Fluorophores as Light-Capturing Antennas
Angew Chem Int Ed Engl. 2014 53 (3), 875-878. © 2014 WILEY-VCH Verlag GmbH & Co. KGaA, Weinheim
21
extinction coefficient than cobalamin by itself). Additionally, appending a fluorophore that is excited in the near IR region can cause cleavage to occur at wavelengths where cobalamin does not absorb light at all41. An energy transfer, the mechanism of which is not understood, from the fluorophore to the cobalamin results in cleavage of the β-axial ligand of cobalamin. This phenomenon allows photoactivation at any wavelength of light capable of exciting the appended fluorochrome and affords access to the entire spectrum of the optical window of tissue.
22
REFERENCES(1) Kaplan, J. H.; Forbush, B.; Hoffman, J. F. Rapid Photolytic Release of Adenosine 5’-Triphosphate from a Protected Analog - Utilization by Na-K Pump of Human Red Blood-Cell Ghosts. Biochemistry 1978, 17, 1929–1935.
(2) Kirby, A. J.; Varvoglis, A. G. A Photosensitive Protecting Group for Phosphate Esters. Chem. Commun. 1967, No. 8, 406.
(3) Barltrop, J. A.; Plant, P. J. Photosensitive Protecting Groups. J Chem. Soc. Chem. Comm. 1966, 22, 822–823.
(4) Jacobsen, D. W.; Troxell, L. S.; Brown, K. L. Catalysis of Thiol Oxidation by Cobalamins and Cobinamides: Reaction Products and Kineticst. Biochemistry 1984, 23, 2017–2025.
(5) Kla, P.; Bochet, C. G.; Givens, R.; Rubina, M.; Popik, V.; Kostikov, A.; Wirz, J. Photoremovable Protecting Groups in Chemistry and Biology : Reaction Mechanisms and E Ffi Cacy. 2012.
(6) Goldman, Y. E.; Hibberd, M. G.; Trentham, D. R. Relaxation of Rabbit Psoas Muscle Fibres from Rigor by Photochemical Generation of Adenosine-5’-Triphosphate. J. Physiol. 1984, 354, 577–604.
(7) Gurney, M.; Lester, H. Light-Flash Physiology with Synthetic Photosensitive Compounds. Physiol. Rev. 1987, 67, 583–617.
(8) Nerbonne, J. M.; Richard, S.; Nargeot, J.; Lester, H. A. New Photoactivatable Cyclic Nucleotides Produce Intracellular Jumps in Cyclic AMP and Cyclic GMP Concentrations. Nature 1984, 310 (5972), 74–76.
(9) Tsien, R. Y.; Zucker, R. S. Control of Cytoplasmic Calcium with Photolabile Tetracarboxylate 2- Nitrobenzhydrol Chelators. Biophys. J. 1986, 50 (5), 843–853.
(10) Gurney, a M.; Tsien, R. Y.; Lester, H. a. Activation of a Potassium Current by Rapid
Photochemically Generated Step Increases of Intracellular Calcium in Rat Sympathetic Neurons. Proc. Natl. Acad. Sci. U. S. A. 1987, 84 (10), 3496–3500.
(11) Landò, L.; Zucker, R. S. “Caged Calcium” in Aplysia Pacemaker Neurons. Characterization of Calcium-Activated Potassium and Nonspecific Cation Currents. J. Gen. Physiol. 1989, 93, 1017–1060.
(12) Mitchison, T. J. Polewards Microtubule Flux in the Mitotic Spindle: Evidence from Photoactivation of Fluorescence. J. Cell Biol. 1989, 109 (2), 637–652.
(13) Reinsch, S. S.; Mitchison, T. J.; Kirschner, M. Microtubule Polymer Assembly and Transport during Axonal Elongation. J. Cell Biol. 1991, 115, 365–379.
23
(15) Adams, S. R.; Tsien, R. Y. Controlling Cell Chemistry with Caged Compounds. Annu. Rev. Physiol. 1993, 55, 755–784.
(16) Baldwin, J. E.; McConnaughie, A. W.; Moloney, M. G.; Pratt, A. J.; Bo Shin, S. New Photolabile Phosphate Protecting Group. Tetrahedron 1990, 46 (19), 6879–6884.
(17) Corrie, J. E. T.; Reid, G. P.; Trentham, D. R.; Hursthouse, M. B.; Mazid, M. A. Synthesis and Absolute Stereochemistry of the Two Diastereoisomers of P3-1-(2-Nitrophenyl)ethyl Adenosine Triphosphate (’caged' ATP). J. Chem. Soc. Perkin Trans. 1 1992, No. 8, 1015–1019.
(18) Adams, S. R.; Kao, J. P. Y.; Tsien, R. Y. Biologically Useful Chelators That Take up calcium(2+) upon Illumination. J. Am. Chem. Soc. 1989, 111 (20), 7957–7968.
(19) Fedoryak, O. D.; Sul, J.-Y.; Haydon, P. G.; Ellis-Davies, G. C. R. Synthesis of a Caged Glutamate for Efficient One- and Two-Photon Photorelease on Living Cells. Chem. Commun. 2005, No. 29, 3664–3666.
(20) Shigeri, Y.; Tatsu, Y.; Yumoto, N. Synthesis and Application of Caged Peptides and Proteins. Pharmacol. Ther. 2001, 91, 85–92.
(21) Ghosh, M.; Song, X.; Mouneimne, G.; Sidani, M.; Lawrence, D. S.; Condeelis, J. S. Cofilin Promotes Actin Polymerization and Defines the Direction of Cell Motility. Science 2004, 304, 743–746.
(22) Huse, M.; Klein, L. O.; Girvin, A. T.; Faraj, J. M.; Li, Q.-J.; Kuhns, M. S.; Davis, M. M. Spatial and Temporal Dynamics of T Cell Receptor Signaling with a Photoactivatable Agonist. Immunity 2015, 27 (1), 76–88.
(23) Nandy, S. K.; Agnes, R. S.; Lawrence, D. S. Photochemically-Activated Probes of Protein−Protein Interactions. Org. Lett. 2007, 9 (12), 2249–2252.
(24) Vázquez, M. E.; Nitz, M.; Stehn, J.; Yaffe, M. B.; Imperiali, B. Fluorescent Caged Phosphoserine Peptides as Probes to Investigate Phosphorylation-Dependent Protein Associations. J. Am. Chem. Soc. 2003, 125 (34), 10150–10151.
(25) Dai, Z.; Dulyaninova, N. G.; Kumar, S.; Bresnick, A. R.; Lawrence, D. S. Visual Snapshots of Intracellular Kinase Activity at the Onset of Mitosis. Chem. Biol. 2015, 14 (11), 1254– 1260.
(26) Li, H.; Hah, J.; Lawrence, D. S. Light-Mediated Liberation of Enzymatic Activity : “ Small Molecule ” Caged. 2008, 10474–10475.
(27) Smith, A. M.; Mancini, M. C.; Nie, S. Bioimaging: Second Window for in Vivo Imaging. Nat. Nanotechnol. 2009, 4 (11), 710–711.
(28) Rahman, I. U.; Karim, A.; Idrees, M.; Khan, M. I. Cellular and Genomic Toxicity Produced by UV Light in Chinese Hamster Ovary Cells. 1995, 295–301.
24
(30) Mayer, G.; Hechel, A. Biologically Active Molecules with a “Light Switch.” Angew. Chemie - Int. Ed.
2006, 45 (30), 4900–4921.
(31) Schönleber, R. O.; Bendig, J.; Hagen, V.; Giese, B. Rapid Photolytic Release of Cytidine 5′- Diphosphate from a Coumarin Derivative: A New Tool for the Investigation of Ribonucleotide Reductases. Bioorg. Med. Chem. 2002, 10 (1), 97–101.
(32) Zayat, L.; Salierno, M.; Etchenique, R. Ruthenium(II) Bipyridyl Complexes as Photolabile Caging Groups for Amines. Inorg. Chem. 2006, 45 (4), 1728–1731.
(33) Rullo, A.; Reiner, A.; Reiter, A.; Trauner, D.; Isacoff, E. Y.; Woolley, G. A. Long Wavelength Optical Control of Glutamate Receptor Ion Channels Using a Tetra-Ortho-Substituted Azobenzene Derivative. Chem. Commun. 2014, 50 (93), 14613–14615.
(34) Umeda, N.; Takahashi, H.; Kamiya, M.; Ueno, T.; Komatsu, T.; Terai, T.; Hanaoka, K.; Nagano, T.; Urano, Y. Boron Dipyrromethene as a Fluorescent Caging Group for Single-Photon Uncaging with Long-Wavelength Visible Light. Acs Chem. Biol. 2014.
(35) Goswami, P. P.; Syed, A.; Beck, C. L.; Albright, T. R.; Mahoney, K. M.; Unash, R.; Smith, E. A.; Winter, A. H. BODIPY-Derived Photoremovable Protecting Groups Unmasked with Green Light. J. Am. Chem. Soc. 2015, 137 (11), 3783–3786.
(36) Gorka, A. P.; Nani, R. R.; Zhu, J.; Mackem, S.; Schnermann, M. J. A Near-IR Uncaging Strategy Based on Cyanine Photochemistry. J. Am. Chem. Soc. 2014, 136 (40), 14153–14159.
(37) Fedoryshin, L. L.; Tavares, A. J.; Petryayeva, E.; Doughan, S.; Krull, U. J. Near-Infrared-Triggered Anticancer Drug Release from Upconverting Nanoparticles. 2014.
(38) Banerjee, R.; Gherasim, C.; Padovani, D. The Tinker, Tailor, Soldier in Intracellular B12 Trafficking. Curr. Opin. Chem. Biol. 2009, 13 (4), 484–491.
(39) Banerjee, R.; Ragsdale, S. W. The Many Faces of Vitamin B12: Catalysis by Cobalamin- Dependent Enzymes 1. Annu. Rev. Biochem. 2003, 72 (1), 209–247.
(40) Lee, H.-M.; Larson, D. R.; Lawrence, D. S. Illuminating the Chemistry of Life: Design, Synthesis, and Applications of “Caged” and Related Photoresponsive Compounds. Acs Chem. Biol. 2009, 4 (6), 409–427.
(41) Shell, T. A.; Shell, J. R.; Rodgers, Z. L.; Lawrence, D. S. Tunable Visible and Near-IR Photoactivation of Light-Responsive Compounds by Using Fluorophores as Light- Capturing Antennas. Angew. Chemie Int. Ed. 2014, 53 (3), 875–878.
(42) McEwan, J. F.; Veitch, H. S.; Russell-Jones, G. J. Synthesis and Biological Activity of Ribose-5‘- Carbamate Derivatives of Vitamin B12. Bioconjug. Chem. 1999, 10 (6), 1131–1136.
(43) Clardy, S. M.; Allis, D. G.; Fairchild, T. J.; Doyle, R. P. Vitamin B12 in Drug Delivery: Breaking through the Barriers to a B12 Bioconjugate Pharmaceutical. Expert Opin. Drug Deliv. 2010, 8 (1), 127–140.
25
(45) Rodgers, Z. L.; Hughes, R. M.; Doherty, L. M.; Shell, J. R.; Molesky, B. P.; Brugh, A. M.; Forbes, M. D. E.; Moran, A. M.; Lawrence, D. S. B12-Mediated, Long Wavelength
Photopolymerization of Hydrogels. J. Am. Chem. Soc. 2015, 137 (9), 3372–3378.
26
Chapter 2: Membrane Mediated Assembly of Near IR Activated Phototherapeutics
(Reproduced with permission from Smith, W. J.; Oien, N. P.; Hughes, R. M.; Marvin, C. M.; Rodgers, Z. L.; Lee, J.; Lawrence, D. S. Cell-Mediated Assembly of Phototherapeutics. Angew. Chemie - Int. Ed. 2014, 10945–10948. © 2014 WILEY-VCH Verlag GmbH & Co. KGaA, Weinheim
)
2.1. Background
The use of light to activate therapeutic agents at disease sites offers the advantage of aggressive
treatment with exquisite spatial control, thereby reducing potential deleterious side effects at unintended
sites. An excellent example of this concept is photodynamic therapy, which employs the delivery of a
photosensitizer to the tissue of interest.1 Upon excitation with the appropriate wavelength of light
and, in the presence of oxygen, cytotoxic reactive oxygen species are generated, resulting in
destruction of the target cells. This minimally invasive procedure furnishes control over where and
when the reactive oxygen species are produced. However, a more general strategy that can control the
delivery of any drug could profoundly influence the treatment of a variety of disorders, including
cancer, diabetes, and autoimmune and vascular diseases.
A major challenge in this regard is the so-called “optical window of tissue”, the wavelength
of light that enjoys maximal tissue penetration, which lies in the range of 600 – 900 nm (see Figure 1.8
for detail)2. Wavelengths less than 600 nm are absorbed by hemoglobin in the circulatory system
and melanin in the skin whereas water interferes with light penetrance >900 nm. Unfortunately,
nearly all light-activatable pro-drugs described to date respond to short wavelengths <450 nm3,4. This
limitation is responsible for the intense interest in two-photon5 and up converting6 technologies. However,
as discussed in recent reviews,5,6 both technologies must overcome daunting challenges before potential
therapeutic applications are realized. We recently described the long wavelength (>600 nm) photolysis of
alkylcobalamins (alkyl-Cbl)7. We now report the cell-mediated assembly of Cbl-drug and
lipid-fluorophore conjugates in which the latter serve as long wavelength light capturing antennas that promote
27
28
Erythrocytes have been called the “champions of drug delivery” due to their biocompatibility,
their long life span (120 days), and their size, which allows large quantities of drug to be conveyed relative
to other carriers8. However, “practically useful controlled release from carrier RBC (red blood cells) remains
an elusive goal”. Our strategy to address this issue is depicted in Figure 2.1. Based on a previously
demonstrated energy transfer between fluorophores and Cbls in covalently appended Cbl-fluorophore
conjugates7, we decided to explore the premise that a cell-mediated assembly of C18-Cbl-drug and C18
-fluorophore conjugates could act in concert as a photo-responsive drug delivery system. Illumination
of the fluorophore antenna at its λmax and subsequent energy transfer to the Cbl-drug moiety should
result in cleavage of the weak Co-C bond7,9,10,11,12, thereby liberating the drug.
2.2. Design and Synthesis of Anchored Compounds
A series of lipid anchored cobalamins (C18-Cbl) and C18–fluorophore derivatives were prepared
(Figure 2.2 and Figure 2.3 and Schemes 2.3-2.10). In the case of the cobalamin derivatives, the C18
moiety was appended to the 5ʹ ribose –OH of cobalamin using octadecylamine (ODA) and carbonyl-di-triazole (CDT). Subsequent alkylation of the Co furnished an amine or carboxylic acid handle, upon which
drugs and fluorescent reporters were covalently attached (Figure 2.2). These species include the
anti-inflammatories methotrexate (MTX), colchicine (COL), and dexamethasone (DEX), and the fluorescent
reporters tetramethylrhodamine (TAM) and fluorescein (FAM). The C18–fluorophore derivatives were
prepared via direct condensation of the activated carboxylate of the fluorophore with the amine of
octadecylamine.
2.3. Measuring a Light Dependent Change in Hydrophilicity of Lipid Tethered Molecules
Our initial studies sought to explore the premise of Figure 2.1 strategy by establishing
light-triggered movement of drugs and reporters from a hydrophobic environment to an aqueous one.
For these preliminary experiments we directly photolyzed C18-Cbl-drug and C18-Cbl-reporter conjugates
at the cobalamin absorbance wavelength (525 nm) in an octanol / water partition. As expected, both
C18- Cbl-TAM and C18-Cbl-MTX are soluble in octanol. Illumination at 525 nm cleaved the C18-Cbl-TAM
cobalt-carbon bond and promoted migration of TAM from octanol to water as hydrophilicity assessed
29
Figure 2.2. Lipidated Cbl-reporters, TAM (C18-Cbl-TAM) and FAM (C18-Cbl-FAM) and lipidated Cbl-drug
30
Figure 2.3. Structure of C18 conjugated fluorophores used in this study. Their ʎmax excitation wavelengths
31
Figure 2.4. Light induced migration of TAM from octanol to water monitored by fluorescence of the aqueous layer. C18-Cbl-TAM (primarily soluble in the octanol layer) in a water/octanol partition was photolyzed at
525 nm. Fluorescence of TAM in the water layer ʎex: 555 nm ʎem: 585 nm. Photolysis time: 0 (red), 1 (orange), 2 (yellow), 3 (green), and 10 min (blue). The inset shows the emission spectrum of aqueous TAM (570 nm – 600 nm). Data are represented as averages with standard errors of three independent experiments.
0
2
4
6
8
10
12
14
16
18
20
0
2
4
6
8
10
12
F
lu
o
re
sce
n
t
F
o
ld
C
h
a
n
g
e
32
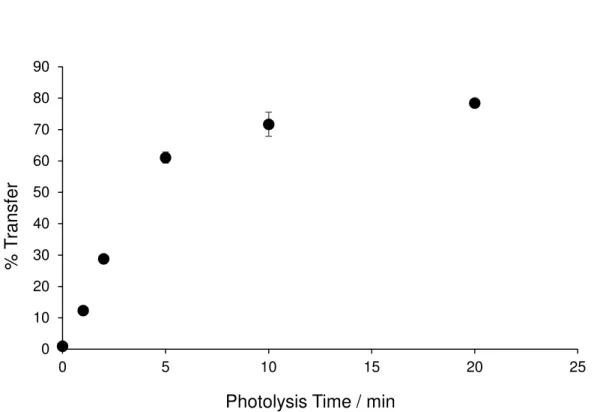
Figure 2.5. Light induced migration of MTX from octanol to water as quantified by the MTX LC-MS assay.
C18-Cbl-MTX (primarily soluble in the octanol layer) was photolyzed using 525 nm LEDs. Migration is
represented as the mole percent of total amount of MTX found in the aqueous layer. Data are represented as averages with standard errors of three independent experiments.
0 10 20 30 40 50 60 70 80 90
0 5 10 15 20 25
%
T
ra
n
sf
e
r
33
triggered the release of MTX into the aqueous phase as demonstrated by LC-MS (Figure 2.5). We
subsequently explored the light triggered transfer of drug/reporter from the lipophilic plasma membrane
of erythrocytes to the aqueous milieu.
2.4. Demonstration of Small Molecule Loading and Release From Erythrocyte Membranes
First, exposure of erythrocytes to C18-Cbl-TAM revealed even and extensive loading as
assessed by widefield fluorescence microscopy. The act of imaging the loaded erythrocytes was
sufficient to cleave the fluorophore from the membrane. In addition, given the established photolytic
sensitivity of the Co-C bond,7,9,13 we were not surprised to find that 20 ms exposure of C
18-Cbl-TAM to
570 nm light on erythrocytes results in the rapid migration (<1 s) of TAM fluorescence from erythrocytes
into solution (Figure 2.6).
C18-Cbl-MTX, C18-Cbl-COL, and C18-Cbl-DEX were loaded onto intact human erythrocytes with
minimal lysis (ca. 5% at 5 mM C18-Cbl-drug, Figure 2.7. The amount of drug that could be loaded onto
erythrocyte membranes was a linear function of the loading concentration (within a range of 1 to 10 µM).
Loading capcity was remarkably similar for C18-Cbl-MTX and C18-Cbl-COL with slightly more efficient
loading observed with C18-Cbl-DEX (Figure 2.8). A typical loading concentration for the Cbl-Drug carriers
was 4 µM cobalamin complex. At that loading concentration, the amount of C18-Cbl-drug loaded per red
blood cell was 0.3–1.0 fmol. Subsequent photorelease of the drug was quantitative for C18-Cbl-COL and
C18-Cbl-DEX and 35% for C18-Cbl-MTX (Figure 2.9). We were able to accurately measure the
concentrations of liberated drug with LC-MS analysis and comparison to known standards (Figure 2.10).
LC-MS analysis revealed that photolysis of erythrocyte-anchored C18-Cbl-MTX primarily furnishes
N-propylamide MTX (Figure 2.11; Scheme 2.1, and Tables 2.1–2.2). Consistent with the established
structure–activity relationship of MTX derivatives,14,15 the photolyzed product of C
18-Cbl-MTX serves as an
effective inhibitor of dihydrofolate reductase (DHFR, Figure 2.12). N-butanoyl COL is the primary
photoproduct of C18-Cbl-COL loaded erythrocytes (Figure 2.11; Scheme 2.1, Tables 2.1–2.2). DEX is the
observed product from photolysis of C18-Cbl-DEX loaded erythrocytes, instead of one or more of the
34
Figure 2.6. Erythrocytes loaded with 10 µM C18-Cbl-TAM and visualized at (a) long wavelength (λex= 650
35
Figure 2.7. Structural integrity of erythrocytes exposed to various concentrations of lipidated drug conjugates for 14 h. Leaked heme was measured by optical density at 550 nm minus the optical density of a DMSO control (7 ± 1%) and divided by the absorbance of a 100% lysed control (0.05% SDS). In this way, only hemolysis due to compounds was measured. Data are represented as averages with standard errors of three independent experiments. C18-Cbl-MTX (blue), C18-Cbl-COL (orange), and C18-Cbl-DEX (grey).
0
5
10
15
20
25
2.5
5
10
20
%
L
y
si
s
36
Figures 2.8. Drug loading onto and release from human erythrocytes. The figure shows the amount of drug photo-released from erythrocytes as a function of C18-Cbl-Drug loading concentration. Samples were
photolyzed to completion using 525 nm LEDs exposure for 2 h. Concentrations were determined by LC-MS assays described for each drug. Data are represented as averages with standard errors of three independent experiments. C18-Cbl-MTX (blue), C18-Cbl-COL (orange), and C18-Cbl-DEX (grey). Drug
release quantity determined by comparison to known standards (Figure 2.10).
0
0.5
1
1.5
2
2.5
0
1
2
3
4
5
6
7
8
9
10
11
L
ib
e
ra
te
d
D
ru
g
C
o
n
ce
n
tr
a
ti
o
n
/
µ
M
37
Figure 2.9. Quantification of drug loading and photo-release. Erythrocytes (200 µL, 5% hematocrit) were incubated with 4 µM of each Cbl drug conjugate for 30 min. At the end of this time, three washes were performed in which the erythrocytes were spun down at 1000 g and the PBS buffer was exchanged. Supernatants were collected, pooled, photolyzed for 30 min at 525 nm, and then analyzed by the various LC-MS assays described for each drug (Figure 2.10). This provided a measure of the C18-Cbl-drug that did
not bind to the membranes. The erythrocytes were resuspended at 200 µL and photolyzed for 1 h at 525 nm and the supernatant was analyzed by the drug specific LC-MS assays (Fig. 2.10). Black bars represent the total amount of drug loaded onto erythrocytes at 5% hematocrit in 200 µL. Conversion of the y-axis values to fmol of C18-Cbl-Drug per RBC was calculated from the experimentally derived value of 2.3 ± 0.1
x 107 RBC/mL (5% hematocrit): 0.28 ± 0.04 fmol of C
18-Cbl-DEX/RBC,1.03 ± 0.03 fmol of C18 -Cbl-COL/RBC, and 0.57 ± 0.01 fmol of C18-Cbl-MTX/RBC. White bars represent the amount of drug liberated
from photolysis into the supernatant. Data are represented as averages of three independent experiments.
C18-Cbl-MTX C18-Cbl-COL C18-Cbl-DEX
n
m
o
l
o
f
D
ru
g
0.35
0.30
0.25
0.20
0.15
0.10
0.05
38
y = 100.97x - 0.4544
R² = 0.9995
0
10
20
30
40
50
60
70
80
90
100
0
0.2
0.4
0.6
0.8
1
A
re
a
U
n
d
e
r
th
e
C
u
rv
e
Concentration / µM
y = 86.099x - 1.9384
R² = 0.9997
0
50
100
150
200
250
300
350
400
450
500
0
1
2
3
4
5
6
A
re
a
U
n
d
e
r
th
e
C
u
rv
e
Concentration / µM
y = 70.5x R² = 0.9902
0 50 100 150 200 250 300 350 400
0
2
4
6
A re a U n d e r th e C u rv e
Concentration / µM
Figure 2.10. (a) The standard curve used with MTX LC-MS assay was generated by titration of known amounts of commercially available MTX and subsequent analysis of the area under the curve by UV-Vis (300 nm) via LC-MS; concentrations used were 1.0 µM, 0.5 µM, 0.1 µM, 0.05 µM, and 0.01 µM. Data are represented as averages of three independent experiments. (b) standard curve used with COL LC-MS assay was generated by titration of known amounts of commercially available COL and subsequent analysis of the area under the curve by UV-Vis (365 nm) via LC-MS. Concentrations used were 5 µM, 1 µM, 0.5 µM, 0.1 µM. Data are represented as averages of three
independent experiments; (c)
standard curve used with DEX LC-MS assay was generated by titration of known amounts of commercially available DEX and subsequent analysis of the area under the curve by
UV-Vis (239 nm) via LC-MS;
concentrations used were 5.0 µM, 2.5
µM, 1 µM, 0.5 µM, and 0.1 µM. Data are represented as averages of three independent experiments.
b)
a)
39
Products of C18-Cbl-Drug Photolysis40
Figure 2.11. Erythrocyte-released photoproducts of C18-Cbl-MTX, C18-Cbl-COL and C18-Cbl-DEX. In the