ARTICLE
Trans-ethnic Fine Mapping Highlights
Kidney-Function Genes Linked to Salt Sensitivity
Anubha Mahajan,
1Aylin R. Rodan,
2Thu H. Le,
3Kyle J. Gaulton,
4Jeffrey Haessler,
5Adrienne M. Stilp,
6Yoichiro Kamatani,
7Gu Zhu,
8Tamar Sofer,
6Sanjana Puri,
2Jeffrey N. Schellinger,
2Pei-Lun Chu,
3Sylvia Cechova,
3Natalie van Zuydam,
1the SUMMIT Consortium, the BioBank Japan Project,
Johan Arnlov,
9,10Michael F. Flessner,
11Vilmantas Giedraitis,
12Andrew C. Heath,
13Michiaki Kubo,
14Anders Larsson,
9Cecilia M. Lindgren,
1,15Pamela A.F. Madden,
13Grant W. Montgomery,
16George J. Papanicolaou,
17Alex P. Reiner,
5Johan Sundstro
¨m,
9Timothy A. Thornton,
6Lars Lind,
9Erik Ingelsson,
18,19Jianwen Cai,
20Nicholas G. Martin,
8Charles Kooperberg,
5Koichi Matsuda,
21John B. Whitfield,
8Yukinori Okada,
7,22Cathy C. Laurie,
6Andrew P. Morris,
1,23,25,*
and Nora Franceschini
24,25,*
We analyzed genome-wide association studies (GWASs), including data from 71,638 individuals from four ancestries, for estimated glomerular filtration rate (eGFR), a measure of kidney function used to define chronic kidney disease (CKD). We identified 20 loci attain-ing genome-wide-significant evidence of association (p<53108) with kidney function and highlighted that allelic effects on eGFR at
lead SNPs are homogeneous across ancestries. We leveraged differences in the pattern of linkage disequilibrium between diverse popu-lations to fine-map the 20 loci through construction of ‘‘credible sets’’ of variants driving eGFR association signals. Credible variants at the 20 eGFR loci were enriched for DNase I hypersensitivity sites (DHSs) in human kidney cells. DHS credible variants were expression quantitative trait loci forNFATC1andRGS14(at theSLC34A1locus) in multiple tissues. Loss-of-function mutations in ancestral ortho-logs of both genes inDrosophila melanogasterwere associated with altered sensitivity to salt stress. Renal mRNA expression ofNfatc1and Rgs14in a salt-sensitive mouse model was also reduced after exposure to a high-salt diet or induced CKD. Our study (1) demonstrates the utility of trans-ethnic fine mapping through integration of GWASs involving diverse populations with genomic annotation from rele-vant tissues to define molecular mechanisms by which association signals exert their effect and (2) suggests that salt sensitivity might be an important marker for biological processes that affect kidney function and CKD in humans.
Introduction
Chronic kidney disease (CKD) is a major public health
burden and affects nearly 10% of the global population.
1Reduced estimated glomerular filtration rate (eGFR), a
mea-sure of kidney function used to define CKD, is associated
with premature cardiovascular disease and mortality, acute
kidney injury, and progression to end stage renal disease
(ESRD).
2Although individuals of African and Hispanic
descent suffer the largest burden of CKD,
3the largest
genome-wide association studies (GWASs) to search for
kidney-function loci have been undertaken in populations
of European and East Asian ancestry.
4–8Many of these loci
are characterized by common variant association signals
that map to large genomic intervals, which contain
many possible causal genes for eGFR, thereby limiting
un-derstanding of the downstream pathogenesis of CKD.
To address this challenge, we have undertaken a
trans-ethnic meta-analysis of nine GWASs comprising 71,638
individuals from four ancestries (African American,
His-panic, European, and East Asian), each imputed up to
the phase 1 integrated (March 2012 release)
multi-ethnic reference panel from the 1000 Genomes Project
9,
from the Continental Origins and Genetic Epidemiology
1Wellcome Trust Centre for Human Genetics, University of Oxford, Oxford OX3 7BN, UK;2Department of Internal Medicine, University of Texas
South-western Medical Center, Dallas, TX 75229, USA;3Department of Medicine, University of Virginia, Charlottesville, VA 22908, USA;4Department of Pediat-rics, University of California San Diego, La Jolla, CA 92093, USA;5Division of Public Health Sciences, Fred Hutchinson Cancer Research Center, Seattle, WA 98109, USA;6Department of Biostatistics, University of Washington, Seattle, WA 98195, USA;7Laboratory for Statistical Analysis, RIKEN Center for Inte-grative Medical Sciences, Yokohama 230-0045, Japan;8Genetic Epidemiology Laboratory, QIMR Berghofer Medical Research Institute, Brisbane 4006, Australia;9Department of Medical Sciences, Cardiovascular Epidemiology, Uppsala University, Uppsala 751 85, Sweden;10School of Health and Social Studies, Dalarna University, Falun 791 88, Sweden;11National Institute of Diabetes, Digestive, and Kidney Disease, NIH, Bethesda, MD 20892, USA; 12Department of Public Health and Caring Sciences, Molecular Geriatrics, Uppsala University, Uppsala 752 37, Sweden;13Department of Psychiatry,
Washington University in St. Louis, St. Louis, MO 63110, USA;14Laboratory for Genotyping Development, RIKEN Center for Integrative Medical Sciences, Yokohama 230-0045, Japan;15Big Data Institute, Li Ka Shing Centre for Health Information and Discovery, University of Oxford, Oxford OX3 7BN, UK; 16Molecular Epidemiology Laboratory, QIMR Berghofer Medical Research Institute, Brisbane 4006, Australia;17Epidemiology Branch, Division of
Cardio-vascular Sciences, National Heart, Lung and Blood Institute, Bethesda, MD 20892, USA;18Department of Medical Sciences, Molecular Epidemiology and Science for Life Laboratory, Uppsala University, Uppsala 752 37, Sweden;19Department of Medicine, Division of Cardiovascular Medicine, Stanford University School of Medicine, Stanford, CA 94305, USA;20Collaborative Studies Coordinating Center, Department of Biostatistics, University of North Carolina at Chapel Hill, Chapel Hill, NC 27599, USA;21Laboratory of Molecular Medicine, Human Genome Center, Institute of Medical Science, University of Tokyo, Tokyo 108-8639, Japan;22Department of Statistical Genetics, Osaka University Graduate School of Medicine, Osaka 565-0871, Japan; 23Department of Biostatistics, University of Liverpool, Liverpool L69 3GL, UK;24Department of Epidemiology, University of North Carolina, Chapel Hill,
NC 27514, USA
25These authors contributed equally to this work
*Correspondence:[email protected](N.F.),[email protected](A.P.M.) http://dx.doi.org/10.1016/j.ajhg.2016.07.012.
Network (COGENT)-Kidney consortium. With these data,
we aimed to (1) assess the evidence for heterogeneity in
allelic effects on eGFR for lead SNPs at kidney-function
loci across ethnic groups; (2) fine-map these loci by taking
advantage of high-density imputation and by leveraging
differences in the pattern of linkage disequilibrium (LD)
be-tween diverse populations to localize ‘‘credible sets’’ of
var-iants driving eGFR association signals; (3) define potential
molecular mechanisms through which eGFR association
signals at these loci impact kidney function through
over-lap of credible variants with genomic annotation; and (4)
assess possible markers for biological processes that impact
kidney function and CKD in humans through targeted
experimentation in model organisms.
Subjects and Methods
Ethics Statement
All human research was approved by the relevant institutional review boards and conducted according to the Declaration of Hel-sinki. All participants provided written informed consent.
Study Overview
We aggregated five GWASs of individuals of European ancestry (23,553 individuals from Europe, the USA, and Australia), two GWASs of Hispanic Americans (16,325 individuals from the USA), one GWAS of individuals of East Asian ancestry (23,536 individuals from Japan), and one GWAS of African Americans (8,224 individuals from the USA). Study sample characteristics are presented inTable S1.
Genotyping, Quality Control, and Imputation
Samples were genotyped with a variety of GWAS arrays, and qual-ity control was undertaken within each study (Table S2). Sample quality control included exclusions on the basis of genome-wide call rate, extreme heterozygosity, sex discordance, cryptic related-ness, and outlying ethnicity. SNP quality control included exclu-sions on the basis of call rate across samples and extreme deviation from Hardy-Weinberg equilibrium. Non-autosomal SNPs were excluded from imputation and association analysis.
Within each study, the autosomal GWAS genotype scaffold was first pre-phased10,11with genetic maps from the International
HapMap Consortium12to model recombination rates. The scaffold was then imputed up to the phase 1 integrated (March 2012 release) multi-ethnic reference panel from the 1000 Genomes Project9 via IMPUTE211,13or MaCH/Minimac11(Table S2). Imputed
vari-ants were retained for downstream association analyses if they attained established GWAS quality control thresholds:14IMPUTE2
infoR0.4 or MaCH/Minimacr2R0.3.
Calculation of eGFR and Association Analysis
Within each study, eGFR was calculated from serum creatinine (mg/dL), with adjustment for age, sex, and ethnicity by means of the four-variable MDRD (modification of diet in renal disease) equation15to be comparable with published GWASs of kidney
function.4–8Within each study, we tested association of eGFR with each variant passing quality control in a linear regression framework under an additive dosage model and with adjustment for study-specific covariates to account for confounding due to
population structure (Table S2). Association summary statistics were subsequently corrected in each study for residual population structure through a first round of genomic control16where neces-sary (Table S2).
Trans-ethnic Meta-analysis
Association summary statistics were combined across studies via fixed-effects meta-analysis (inverse-variance weighting) imple-mented in the GWAMA software.17Variants passing quality
con-trol in fewer than 50% of the total sample size across studies were excluded from the meta-analysis. Association summary sta-tistics from the meta-analysis were then corrected for a second round of genomic control16(lGC¼1.028). Heterogeneity in allelic effects between studies at each variant was assessed by means of Cochran’s Q statistic.18We extracted association summary statis-tics for eGFR from the trans-ethnic meta-analysis for previously reported lead SNPs at established GWAS loci.
LD Calculations
LD, as measured by the correlation coefficientr2, was calculated on the basis of haplotypes in each ancestry group from the 1000 Genomes Project9via LDlink.19
Conditional Analyses
To assess the evidence for distinct association signals at each locus attaining nominal significance (pCOND<105, Bonferroni
correc-tion for ~5,000 variants per locus) in our trans-ethnic meta-anal-ysis, we performed conditional analysis in a 1 Mb genomic interval flanking the lead SNP. Within each study, we tested association of eGFR with each variant passing quality control in the flanking re-gion in a linear regression framework under an additive dosage model and with adjustment for genotypes at the lead SNP, in addi-tion to other study-specific covariates used in uncondiaddi-tional anal-ysis (Table S2). Association summary statistics were subsequently corrected in each study for residual population structure, via the same genomic control16correction employed for unconditional
analysis (Table S2). These association summary statistics were combined across studies via fixed-effects meta-analysis (inverse-variance weighting) implemented in GWAMA.17Variants passing quality control in less than 50% of the total sample size across studies were excluded from the meta-analysis. Association sum-mary statistics from the conditional meta-analysis were then corrected for a second round of genomic control,16making use
of the same adjustment as defined in the unconditional analysis (lGC¼1.028).
Association with CKD
We defined CKD by an eGFR<60 mL/min/1.73 m2(calculated
and inverse-variance weighting) implemented in METAL20 and GWAMA.17
Association with eGFR in Diabetic Individuals from
the SUMMIT Consortium
We considered the lead eGFR SNP at each locus attaining genome-wide significance in our trans-ethnic meta-analysis. We performed a look-up of association summary statistics for eGFR in 13,158 sub-jects with diabetes (9,197 with type 2 diabetes [T2D] and 3,961 with type 1 diabetes [T1D]) from five studies of individuals of European ancestry from the SUMMIT Consortium. Within each study, the outcome variable was defined as the last measured eGFR, calculated with the MDRD equation (defined above). Each study was imputed up to the phase 1 integrated (March 2012 release) multi-ethnic reference panel from the 1000 Genomes Project.9Estimated allelic effects on eGFR were obtained from a
linear mixed model and implemented in EMMAX21 with an
empirical genetic relationship matrix, assuming an additive dosage of the minor allele and including sex, age at diabetes onset, and duration of diabetes as covariates. Association summary statis-tics for eGFR were combined across studies via fixed-effects meta-analysis (inverse-variance weighting) implemented in GWAMA.17 Combined allelic effect estimates across studies were reported for T1D and T2D subjects, both separately and for all diabetic individ-uals combined. Heterogeneity in allelic effects between T1D and T2D subjects at each variant was assessed by means of Cochran’s Q statistic,18as implemented in GWAMA.17
For lead SNPs, we tested for a difference in the allelic effect on eGFR in the general population (from our trans-ethnic meta-anal-ysis) and in diabetic indivuduals (combined T1D and T2D from the SUMMIT Consortium) by using a two-sample Z-test.
MANTRA Fine Mapping and Credible Set
Construction
We performed trans-ethnic fine mapping of each locus in a 1 Mb genomic interval flanking the lead SNP. Association summary sta-tistics for each variant in the flanking region were combined across studies with a Bayesian hybrid of fixed- and random-effects meta-analysis, as implemented in MANTRA.22 MANTRA allows for heterogeneity in allelic effects between ancestry groups arising as a result of differences in the structure of LD between diverse pop-ulations by assigning studies to clusters according to a Bayesian partition model of relatedness between them, defined by pairwise genome-wide mean allele frequency differences (Figure S1). MANTRA has been demonstrated, both empirically and by simula-tion, to improve fine-mapping resolusimula-tion, as compared to either a fixed- or random-effects meta-analysis.22–24Variants passing
qual-ity control in less than 50% of the total sample size across studies were excluded from the fine-mapping analysis.
We calculated the posterior probability that thejthvariant,pC j, is driving the association signal at each locus by
pCj¼ Lj P
kLk;
where the summation is over all variants in the flanking interval. In this expression,Lj is the MANTRA Bayes factor in favor of association from the trans-ethnic meta-analysis. For each distinct association signal, a 99% credible set25was then constructed by (1) ranking all variants according to their Bayes factor,Lj, and (2) including ranked variants until their cumulative posterior proba-bility exceeds 0.99.
Genomic Annotation
For each locus attaining genome-wide significance in our trans-ethnic meta-analysis, we obtained genomic annotations of all sin-gle-nucleotide variants in a 1 Mb interval flanking the lead SNP. We utilized the Ensembl Variant Effect Predictor (VEP, version 2.7), based on the Ensembl transcript set (version 69). By default, the VEP reports all possible annotations (transcript- and gene-spe-cific) for each variant. We therefore prioritized annotations by considering the most severe consequence of all those reported. We then calculated the total posterior probability of driving asso-ciation signals for each consequence across loci.
Regulatory Annotation
We collected genomic annotations from three sources. First, we ob-tained regulatory chromatin states from the Epigenome Roadmap Project26for 93 cell types after removing five cancer cell lines. For
each cell type, we pooled enhancer (EnhA and EnhWk) and pro-moter (TssA and TssFlnk) elements into one annotation. Second, we obtained 145 non-redundant DNase I hypersensitivity sites (DHSs) from the ENCODE Project27by retaining only one dataset
for cell types with multiple assayed samples. Third, we obtained chromatin immuno-precipitation sequence (ChIP-seq) binding sites for 165 transcription factors: 161 proteins from the ENCODE Proj-ect27and additional factors assayed in primary pancreatic islets.28
This resulted in a total of 403 annotations for downstream enrich-ment analyses. For each annotation, we considered variants passing quality control and mapping within 1 Mb of the lead SNP attaining genome-wide significance in the trans-ethnic meta-analysis.
We first tested the effect of each annotation on the log odds of the posterior probability of driving eGFR association signals in a logistic regression model. For each variant, we encoded overlap with the tested annotation as a binary indicator (1 if variant over-laps annotation, 0 otherwise). The regression model also incorpo-rated binary indicators of genic annotations as covariates, as well as a categorical variable for locus membership. Specifically,
logitpCj
¼aiLijþbkxjkþg30UTRxj30UTRþg50UTRxj50UTRþgEXONxjEXON
þgTSSxjTSS;
wherepCjis the posterior probability that thejthvariant drives the eGFR association;aidenotes an intercept for theithlocus andLijis a binary indicator of membership of thejthvariant in theithlocus; bkdenotes the effect of thekthannotation andxkjis a binary indicator of overlap of thejthvariant with thekthannotation; andg
30UTR, g50UTR,gEXONandgTSSdenote the effects of 30UTRs, 50UTRs, coding
exons, and the region within 1 kb upstream of GENCODE transcrip-tion start site (TSS) annotatranscrip-tions, respectively, andxj30UTR,xj50UTR,
xjEXONandxjTSSare binary indicators of overlap of thejthvariant
with these annotations. The SE of the effect of thekthannotation, bk, was evaluated with a robust sandwich variance estimator.
Using fGWAS software, we then tested for the effect of each annotation by using the Bayes factor in favor of association.29
We included coding exons, 30 UTRs, 50 UTRs, and the region within 1 kb upstream of the TSS in the model for each annotation. We obtained the estimated effect and 95% confidence interval (CI) from this model and considered an annotation enriched if the 95% CI did not overlap zero.
Drosophila melanogaster
Salt-Sensitivity Assay
in rearing vials on standard cornmeal/yeast/molasses food (pre-pared in a central kitchen at University of Texas Southwestern Medical Center). The y1w1 isogenic control, in which all loci had been previously homozygosed, and to whichloco mutants had been backcrossed for six generations, were obtained from Dr. Yongkyu Park (Rutgers New Jersey Medical School).30
Sepa-rately, to obtain highly heterozygous progeny (heterogenic), vir-gin females from the A.R.R. lab’swBerlinstrain were mated with males of genotypesy1w1/Y,y1w1/Y;locoEY-P283/TM3 Sbory1w1/Y; locod06164, as above. Adults were cleared from rearing vials on rearing day eight. Ten female progeny from each vial were collected within 1–3 days of eclosion and placed on food containing various concentrations of added NaCl. Each experi-mental vial contained flies from a single rearing vial. The number of dead flies in each vial was counted daily. Flies were transferred to fresh medium after day five, and again after day ten for the heterogenic flies. For each concentration of experimental me-dium, 225 g Applied Scientific Jazz-MixDrosophilaFood (Fisher, cat. no. AS-153) was added to 500 mL deionized water with con-stant stirring. Flasks were then placed on a hot plate at 350C with constant stirring and heated to a slow boil (about 20– 25 min). The heat was then turned off, 4M NaCl was added to achieve varying concentrations of added NaCl, and total volume adjusted to 900 mL with deinonized water. Medium was dispensed in 3–4 mL aliquots in polystyrene vials. All crosses and assays were performed at room temperature (~22C–23C) and ambient humidity.
We estimated the effect of the mutations on salt sensitivity by applying a Cox proportional hazards model on the fly survival data. The outcome was survival time, and at the end of the follow-up period, all living flies were censored. The data for each genetic background (heterogenic or isogenic) and NaCl concentra-tion were analyzed separately. We estimated the effect on the haz-ard ratio of genotype (each mutation versus control as baseline). To account for intra-vial correlation, we used robust sandwich variance estimators in a generalized estimating equation (GEE)-like model that treats members of each vial as associated with a single cluster. Analyses were performed with the R ‘‘survival’’ package.
Mouse Renal Expression Study
129S6 mice were purchased from Taconic Biosciences and were maintained on a 12 hr light-dark cycle with free access to standard chow and water in the animal facility of the University of Virginia. Only male mice at 12 weeks of age were used. High-salt diet (HSD, 6% NaCl) in pellets was purchased from Harlan Teklad and admin-istered in place of normal chow for two weeks. Experiments were carried out in accordance with local and NIH guidelines. To induce CKD, mice were subjected to sub-total nephrectomy (Nx) under 1.5% isoflurane anesthesia, the right kidney was removed, and the upper branch of the two main branches of the left renal artery were ligated to impede blood supply to the upper half of the kid-ney as previously reported.31
Renal mRNA was extracted at the end of 2 weeks of HSD, or at 12 weeks after sub-total Nx. Real-time RT-PCR was performed as previously described32 with the primers listed in Table S3. Fluorescence detection was accomplished with Sybr Green and the iCYcler system (Bio-Rad). mRNA expression was normalized against mRNA expression of the Hprt housekeeping gene, and the mean at baseline was used as the reference for determination of relative expression across conditions.
Results
Identification of Loci Associated with Kidney
Function across Ancestry Groups
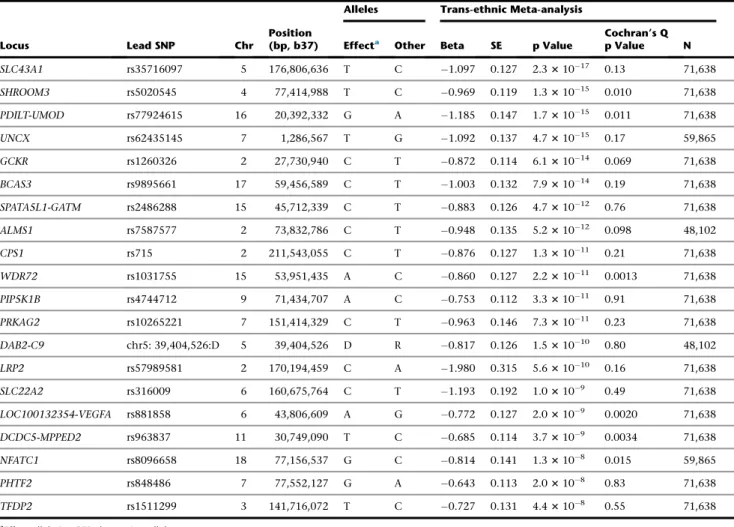
We identified 20 loci attaining genome-wide-significant
evidence of association with eGFR (p
<
5
3
10
8) in
trans-ethnic meta-analysis (
Table 1
,
Figure S2
). These loci
have been previously reported in ethnic-specific GWASs
of individuals with European and East Asian ancestry
4–6,8(
Table S4
). They include two loci discovered in a recently
published meta-analysis of European ancestry GWASs:
LRP2
([MIM: 600073] rs57989581, p
¼
5.6
3
10
10) and
NFATC1
([MIM: 600489] rs8096658, p
¼
1.3
3
10
8).
Pre-viously reported lead SNPs at an additional 21 established
kidney-function loci attained nominal evidence of
associa-tion (p
<
0.05) with eGFR, with consistent direction of
effect (
Table S4
).
As expected, lead SNPs were common across ancestry
groups at all 20 loci, with each displaying modest effects
on eGFR (
Table S5
). Despite substantial variability in allele
frequencies between ancestry groups, we observed no
evi-dence of trans-ethnic heterogeneity in allelic effects on
eGFR for any lead SNP (
Table 1
,
Table S5
). Through
condi-tional analyses (
Table S6
), we observed no evidence of
mul-tiple distinct signals of association for eGFR at any locus
(p
COND<
10
5, Bonferroni correction for ~5,000 variants
per locus). Taken together, these data are consistent with
a single variant driving association signals in each locus;
each variant is shared across ancestry groups and has
homogeneous effects on eGFR in diverse populations.
However, we recognize that larger multi-ethnic samples
will be required to detect lower frequency,
population-spe-cific distinct association signals of modest effect on kidney
function.
Impact of Lead eGFR SNPs on CKD and Kidney
Function in Diabetic Individuals
We assessed the impact on CKD of lead SNPs at the 20
eGFR loci in a subset of individuals (up to 3,976 cases
and 55,904 controls) contributing to our trans-ethnic
meta-analysis (
Table S7
). We defined CKD by eGFR
<
60 mL/min/1.73 m
2and/or incidence of ESRD. For all 20
lead SNPs, the eGFR-decreasing allele was associated with
increased risk of CKD. Eleven of the lead SNPs
demon-strated evidence of association with CKD at nominal
sig-nificance (p
<
0.05), and the strongest signals were
observed at
UNCX
(rs62435145, p
¼
2.2
3
10
7),
ALMS1
([MIM: 606844] rs7587577, p
¼
3.1
3
10
6), and
PDILT-UMOD
([MIM: 191845] rs77924615, p
¼
4.0
3
10
6).
with previous reports,
8,33allelic effects on eGFR in diabetic
individuals and our trans-ethnic meta-analysis of
individ-uals from the general population were homogeneous
(
Figure S3
). There was nominal evidence of association
with eGFR (p
<
0.05), with the same direction of effect,
at seven loci, and the strongest signals were observed at
PDILT-UMOD
(p
¼
6.9
3
10
6),
PRKAG2
([MIM: 602743]
p
¼
0.00013) and
NFATC1
(p
¼
0.00045).
Fine Mapping of eGFR Loci
We next sought to localize variants driving eGFR
associa-tion signals in each of the 20 loci attaining genome-wide
significance in our trans-ethnic meta-analysis. We utilized
trans-ethnic fine mapping implemented in MANTRA,
22taking advantage of increased sample size and the
expecta-tion that patterns of LD vary between diverse populaexpecta-tions.
We derived credible sets of variants
25mapping within
500 kb of the lead SNP at each locus that together account
for 99% of the posterior probability (
pC
) of driving the
as-sociation signal (
Table S9
). Smaller credible sets, in terms of
the number of SNPs they contain, or the genomic interval
that they cover, thus correspond to more precise
fine-mapping. The 99% credible set at the
PDILT-UMOD
locus
included a single variant (rs77924615,
pC
>
0.999), which
maps to an intron of
PDILT
. This variant has previously
been reported as driving the primary association signal
for CKD at the
PDILT-UMOD
locus through whole-genome
sequencing and long-range haplotype imputation into
194,286 Icelandic individuals with serum creatinine
mea-surements.
34We also observed precise localization, defined
by a 99% credible set including no more than five variants
(
Table S10
), at a five additional loci:
NFATC1
(two variants,
mapping to 0.4 kb),
SLC34A1
([MIM: 182309] two
vari-ants, mapping to 0.6 kb),
GCKR
([MIM: 600842] three
variants, mapping to 11.7 kb),
DCDC5-MPPED2
([MIM:
612321, 600911] four variants, mapping to 27.9 kb), and
PIP5K1B
([MIM: 602745] five variants, mapping to 3.5 kb).
Integration of Genetic Fine-mapping and Genomic
Annotation
To gain insight into the mechanisms through which
asso-ciation signals at the 20 GWAS loci attaining genome-wide
significance in our trans-ethnic meta-analysis impact
eGFR, we began by obtaining genomic annotations for
all single-nucleotide variants mapping within 500 kb of
lead SNPs. Across all 20 loci, only 5.4% of the posterior
Table 1. Loci Attaining Genome-wide-Significant Evidence of Association (p<53108) with eGFR in Trans-ethnic Meta-analysis of 71,638Individuals
Locus Lead SNP Chr
Position (bp, b37)
Alleles Trans-ethnic Meta-analysis
Effecta Other Beta SE p Value Cochran’s Qp Value N
SLC43A1 rs35716097 5 176,806,636 T C 1.097 0.127 2.331017 0.13 71,638
SHROOM3 rs5020545 4 77,414,988 T C 0.969 0.119 1.331015 0.010 71,638
PDILT-UMOD rs77924615 16 20,392,332 G A 1.185 0.147 1.731015 0.011 71,638
UNCX rs62435145 7 1,286,567 T G 1.092 0.137 4.731015 0.17 59,865
GCKR rs1260326 2 27,730,940 C T 0.872 0.114 6.131014 0.069 71,638
BCAS3 rs9895661 17 59,456,589 C T 1.003 0.132 7.931014 0.19 71,638
SPATA5L1-GATM rs2486288 15 45,712,339 C T 0.883 0.126 4.731012 0.76 71,638
ALMS1 rs7587577 2 73,832,786 C T 0.948 0.135 5.231012 0.098 48,102
CPS1 rs715 2 211,543,055 C T 0.876 0.127 1.331011 0.21 71,638
WDR72 rs1031755 15 53,951,435 A C 0.860 0.127 2.231011 0.0013 71,638
PIP5K1B rs4744712 9 71,434,707 A C 0.753 0.112 3.331011 0.91 71,638
PRKAG2 rs10265221 7 151,414,329 C T 0.963 0.146 7.331011 0.23 71,638
DAB2-C9 chr5: 39,404,526:D 5 39,404,526 D R 0.817 0.126 1.531010 0.80 48,102
LRP2 rs57989581 2 170,194,459 C A 1.980 0.315 5.631010 0.16 71,638
SLC22A2 rs316009 6 160,675,764 C T 1.193 0.192 1.03109 0.49 71,638
LOC100132354-VEGFA rs881858 6 43,806,609 A G 0.772 0.127 2.03109 0.0020 71,638
DCDC5-MPPED2 rs963837 11 30,749,090 T C 0.685 0.114 3.73109 0.0034 71,638
NFATC1 rs8096658 18 77,156,537 G C 0.814 0.141 1.33108 0.015 59,865
PHTF2 rs848486 7 77,552,127 G A 0.643 0.113 2.03108 0.83 71,638
TFDP2 rs1511299 3 141,716,072 T C 0.727 0.131 4.43108 0.55 71,638
probability of driving association signals was annotated
to coding variants (
Table S11
), the majority of which was
accounted for by
GCKR
p.Pro446Leu (rs1260326,
pC
¼
0.938). This missense variant has been shown,
function-ally, to result in increased de novo triglyceride and
choles-terol synthesis and export and decreased plasma glucose
concentrations, all of which have been associated with
risk of CKD,
35,36making
GCKR
the likely effector transcript
for eGFR at this locus. However, outside of the
GCKR
locus,
variants mapping to non-coding sequence accounted for
more than 99.4% of the probability of driving eGFR
associ-ation, suggesting that these signals are most likely to be
mediated by effects on gene regulation.
We next investigated whether genomic annotations of
regulatory chromatin state for 93 cell types,
26DHSs for
145 cell types,
27and ChIP-seq binding sites for 165
tran-scription factors
27,28were predictive of posterior
probabil-ity of driving association signals across the 20 loci (
Figure 1
,
Table S12
). We observed significant effects (p
<
0.00012,
Bonferroni correction for 403 annotations) on posterior
probability for variants in kidney DHSs, including
adult renal proximal tubular epithelial cells (RPTECs; p
¼
3.4
3
10
8), renal cortical epithelial cells (HRCEs; p
¼
4.7
3
10
7), and fetal kidney cells (p
¼
8.8
3
10
6). We
also observed significant effects on posterior probability
for transcription-factor binding sites, most notably for
HDAC8 (p
¼
1.1
3
10
14). Histone deacetylases (HDACs)
are involved in kidney function and development,
37and
HDAC inhibitors could be promising in the treatment of
kidney disease.
38We repeated our analyses by using
fGWAS
29(
Figure S4
,
Table S12
) and observed strong
corre-lation in the ranking of enriched annotations (
r
2¼
0.93).
These results highlight that variants driving association
signals with eGFR are more likely to be co-localized with
annotated elements in kidney cells, thereby suggesting
that gene regulation in disease-relevant tissues is a likely
mechanism by which GWAS loci impact CKD.
Lead SNPs that, by themselves, accounted for more than
80% of the posterior probability of driving association
signals overlapped an enriched annotation at five loci (
Ta-ble S13
). In particular, at the
SLC34A1
locus, rs35716097
(
pC
¼
0.946) overlapped DHSs in RPTECs and HRCEs, as
well as a binding site for HDAC8, while at the
NFATC1
locus, rs8096658 (
pC
¼
0.877) overlapped fetal kidney
cell DHSs (
Figure S5
). At both of these loci, the lead SNPs
were also expression quantitative trait loci (eQTLs) for
NFATC1
and
RGS14
(MIM: 602513; at the
SLC34A1
locus)
in multiple tissues (
Table S13
), highlighting these genes as
likely effector transcripts through which eGFR association
signals are mediated.
NFATC1
plays a central role in
induc-ible gene transcription during immune response and is a
downstream target of the transplant immunosuppression
drug cyclosporine A.
RGS14
encodes a member of the
regu-lator of G protein signaling family, which modulates
downstream effects of G
a
subunits and has unknown
func-tion in kidneys.
Experimental Data in Model Organisms
To provide insight into the role of
NFATC1
and
RGS14
(at
the
SLC34A1
locus) in kidney physiology, we examined
the function of ancestral orthologs in
Drosophila
mela-nogaster
. The
Drosophila
genome encodes a single member
of the
NFAT
family, and a previous report has
demon-strated that flies with
NFAT
loss-of-function mutations
have increased salt sensitivity, suggesting a role for this
gene in ionic or osmotic regulation.
39The closest
RGS14
ortholog in
Drosophila melanogaster
is
loco
, for which
reduced expression is associated with longer lifespan and
stress resistance.
30We thus conducted experiments aimed
at characterizing a role for
loco
loss-of-function variants
in salt sensitivity. We compared survival of two
inde-pendently derived heterozygous
loco
mutants (
y
1w
1;
loco
d06164/
þ
and
y
1w
1; loco
EY-P283/
þ
) with isogenic
y
1w
1controls after supplementing their diet with varying
NaCl concentrations for 8 days (
Figure 2
). There was very
little mortality of any of the genotypes on
non-NaCl-supplemented food, indicating no baseline differences
in viability over the time period tested. However, we
observed significantly improved survival of the
heterozy-gous
loco
mutants over controls on NaCl-supplemented
food (
Figure 2
,
Table S14
), thereby indicating a role
Figure 1. DNase I Hypersensitivity Sites in Kidney Cells and HDAC8 Binding Sites are Predictive of Posterior Probability of Driving Association Signals at 20 eGFR Loci
for this gene in resistance to salt stress. To exclude the
ef-fects of inbreeding depression on our findings, we also
repeated our experiments with the same strains on a
het-erogenic background. As expected, the hybrid hethet-erogenic
strains were less salt susceptible than the isogenic strains,
but the
loco
mutants remained salt-resistant when
compared to controls of a similar genetic background
(
Figure 2
,
Table S14
).
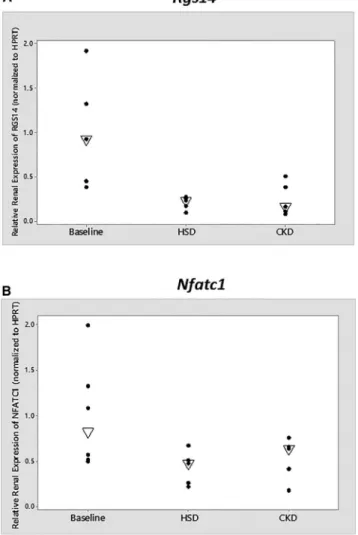
To further investigate the role of
NFATC1
and
RGS14
in
kidney function, we used the 129S6 mouse strain that is
salt-sensitive
31and susceptible to glomerulosclerosis.
40We compared the renal mRNA expression of
Nfatc1
and
Rgs14
at baseline versus (1) after a 2-week exposure to
high-salt diet and (2) at 12 weeks after CKD induced by
sub-total nephrectomy. Compared to baseline condition,
Rgs14
was significantly decreased (~75%, p
¼
0.01) during
high-salt exposure (
Figure 3
). In the CKD model,
Rgs14
expression was also reduced and approached statistical
sig-nificance (p
¼
0.06). The renal mRNA expression of
Nfatc1
was also significantly decreased (~50%, p
¼
0.03) during
high-salt exposure and trended down in CKD (p
¼
0.31).
Although we cannot establish cause and effect, these
data illustrate that the expression of both genes is altered
during disease states.
Discussion
We have undertaken a trans-ethnic meta-analysis of GWASs
of eGFR, supplemented by imputation up to the phase 1
in-tegrated (March 2012 release) multi-ethnic reference panel
from the 1000 Genomes Project.
9With these high-density
imputed data, we identified 20 loci at genome-wide
signifi-cance for eGFR through trans-ethnic meta-analysis. Despite
improved coverage of low-frequency variation offered by
high-density imputation, lead SNPs were common across
ancestry groups at all 20 of these kidney-function loci.
There was also minimal evidence of trans-ethnic
heteroge-neity in allelic effects on eGFR at lead SNPs at
kidney-func-tion loci, thereby arguing against the ‘‘synthetic
associa-tion’’ hypothesis.
41It is highly unlikely that eGFR
association signals at these kidney-function loci reflect
un-observed lower frequency causal alleles with larger effects
because (1) rare variants are unlikely to have arisen before
human population migration out of Africa and thus are
not anticipated to be widely shared across diverse
popula-tions
9,42and (2) LD with these variants is expected to be
highly variable between ethnicities.
Our conditional analyses did not provide evidence for
multiple distinct eGFR association signals, which is
Figure 2. Drosophila RGS14Heterozygous Mutants Are Resistant to Salt Stress
consistent with a single causal variant at each of the 20
eGFR loci. However, we recognize that conditional
ana-lyses evaluate the evidence for residual association at the
locus that cannot be ascribed to the lead SNP and do not
provide a formal framework to test for the presence of
mul-tiple causal variants, for example, that are in strong LD
with each other and reside on the same haplotype.
Further-more, larger sample sizes will be required to detect distinct
association signals defined by common variants of modest
effect or low-frequency variants that might be specific to
particular ethnic groups.
As with most previous GWASs of kidney function, our
study was limited to a single measure of eGFR for each
participant. We also did not adjust for diabetes or
hyper-tension in our analyses given that these conditions
are potential mediators or modifiers of the SNP-eGFR
asso-ciations. However, despite ethnic differences in the
preva-lence of these conditions, we observed no evidence of
het-erogeneity in allelic effects on eGFR between ancestry
groups. Exploration of context-dependent effects should
be considered in future studies, for example, by using
gene-environment interaction or mediation analyses.
Given our observation that eGFR association signals are
shared across ancestry groups, we next sought to take
advantage of the differential patterns of LD across diverse
populations to fine-map kidney-function loci.
Credible-set variants mapped predominantly to non-coding
sequence, suggesting that eGFR association signals are
most likely to be mediated by effects on gene regulation,
in agreement with previous reports for other complex
hu-man traits.
43–45Through integration of genetic
fine-map-ping data with information from regulatory annotation
resources, we have demonstrated significant enrichment
of variants driving eGFR association signals with DHSs in
multiple kidney cell types. Overlap with these enriched
an-notations could be used as a prior model for eGFR
associa-tion signals, genome-wide, to improve power for discovery
of additional kidney-function loci and further enhance
trans-ethnic fine-mapping efforts.
46Lead SNPs at kidney-function loci overlapping enriched
annotations included eQTL for
NFATC1
and
RGS14
(at
the
SLC34A1
locus) in multiple tissues, pointing to likely
effector transcripts through which these eGFR association
signals are mediated. We have established that
loss-of-function mutations in ancestral orthologs of both genes
in
Drosophila melanogaster
are associated with response to
salt stress. Although salt sensitivity has not been directly
correlated with variation in eGFR in humans, it has been
associated with albuminuria,
47,48elevated creatinine,
48and the subsequent development of hypertension,
49sug-gesting the relevance of this trait to kidney function.
Indeed, in animal models, salt sensitivity is tightly linked
with a blunted tubuloglomerular feedback (TGF) or
impaired increase in GFR after salt loading.
50–53Consistent
with this, we demonstrated that renal mRNA expression of
Nfatc1
and
Rgs14
in a salt-sensitive mouse model was
reduced after exposure to a high-salt diet and induced
CKD. In parallel with the findings in
Drosophila
mela-nogaster
, these results are consistent with the hypothesis
that the capacity to reduce expression of
Rgs14
and
Nfatc1
determines the extent of the response to stress. Another
possible mechanism suggested by our results in
Drosophila
is a role for oxidative stress, to which
RGS14
ortholog
mutants are resistant,
30and which has been implicated
in mammalian salt sensitivity.
54,55Establishing the
func-tional role of these genes in salt sensitivity, TGF, GFR,
oxidative stress, and CKD will require targeted in vivo
studies using knockout and/or transgenic mouse models.
In conclusion, our study demonstrates the utility of
trans-ethnic fine mapping through integration of GWASs
of diverse populations with genomic annotation from
relevant tissues to define molecular mechanisms by which
association signals exert their effect, thereby offering an
exciting opportunity to elucidate the pathophysiology of
complex human diseases.
Figure 3. Relative Renal mRNA Expression ofRgs14andNfatc1
Supplemental Data
Supplemental Data include five figures, fourteen tables, and Sup-plemental Acknowledgments and can be found with this article online athttp://dx.doi.org/10.1016/j.ajhg.2016.07.012.
Acknowledgments
A.R.R. and J.N.S. are supported by the US NIH (K08DK091316). T.H.L. is supported by the National Institute of Diabetes and Digestive and Kidney Diseases (1R01DK094907-01). S.P. is sup-ported by the US NIH (R25DK101401). G.W.M. is supsup-ported by the Australian National Health and Medical Research Council Fellowship Scheme. Yukinori Okada was supported by the Japan Society for the Promotion of Science KAKENHI (15H05911, 15H05670, 15K14429), the Japan Science and Technology Agency, Mochida Memorial Foundation for Medical and Pharmaceutical Research, Takeda Science Foundation, Gout Research Foundation, the Tokyo Biochemical Research Foundation, and the Japan Rheu-matism Foundation. A.P.M. is a Wellcome Trust Senior Fellow in Basic Biomedical Science (grant WT098017). N.F. is supported by the US NIH (5R21HL123677-02). The ESRD data reported here have been supplied by the United States Renal Data System. The interpretation and reporting of these data are the responsibility of the authors and in no way should be seen as official policy or interpretation of the US government. Additional acknowledg-ments are provided in the Supplemental Data.
Received: February 17, 2016 Accepted: July 8, 2016 Published: September 1, 2016
Web Resources
1000 Genomes,http://www.1000genomes.org ENCODE,https://www.encodeproject.org/
Ensembl Genome Browser,http://www.ensembl.org/index.html EPACTS,http://genome.sph.umich.edu/wiki/EPACTS
fGWAS,https://github.com/joepickrell/fgwas Gencode,http://www.gencodegenes.org
GWAMA,http://www.geenivaramu.ee/en/tools/gwama
IMPUTE2,http://mathgen.stats.ox.ac.uk/impute/impute_v2.html International HapMap Project,http://hapmap.ncbi.nlm.nih.gov/ LDlink,http://analysistools.nci.nih.gov/LDlink/
METAL,http://www.sph.umich.edu/csg/abecasis/metal/ Minimac,http://genome.sph.umich.edu/wiki/Minimac OMIM,http://www.omim.org/
Roadmap,http://www.roadmapepigenomics.org/
Variant Effect Predictor,http://useast.ensembl.org/Homo_sapiens/ Tools/VEP
References
1. Levey, A.S., and Coresh, J. (2012). Chronic kidney disease. Lancet379, 165–180.
2. Collins, A.J., Foley, R.N., Gilbertson, D.T., and Chen, S.-C. (2015). United States Renal Data System public health surveil-lance of chronic kidney disease and end-stage renal disease. Kidney Int Suppl (2011)5, 2–7.
3. Xue, J.L., Eggers, P.W., Agodoa, L.Y., Foley, R.N., and Collins, A.J. (2007). Longitudinal study of racial and ethnic differences
in developing end-stage renal disease among aged medicare beneficiaries. J. Am. Soc. Nephrol.18, 1299–1306.
4. Ko¨ttgen, A., Pattaro, C., Bo¨ger, C.A., Fuchsberger, C., Olden, M., Glazer, N.L., Parsa, A., Gao, X., Yang, Q., Smith, A.V., et al. (2010). New loci associated with kidney function and chronic kidney disease. Nat. Genet.42, 376–384.
5. Pattaro, C., Ko¨ttgen, A., Teumer, A., Garnaas, M., Bo¨ger, C.A., Fuchsberger, C., Olden, M., Chen, M.-H., Tin, A., Taliun, D., et al.; CARDIoGRAM Consortium; ICBP Consortium; CARe Consortium; Wellcome Trust Case Control Consortium 2 (WTCCC2) (2012). Genome-wide association and functional follow-up reveals new loci for kidney function. PLoS Genet.
8, e1002584.
6. Okada, Y., Sim, X., Go, M.J., Wu, J.Y., Gu, D., Takeuchi, F., Takahashi, A., Maeda, S., Tsunoda, T., Chen, P., et al.; KidneyGen Consortium; CKDGen Consortium; GUGC con-sortium (2012). Meta-analysis identifies multiple loci associ-ated with kidney function-relassoci-ated traits in east Asian popula-tions. Nat. Genet.44, 904–909.
7. Gorski, M., Tin, A., Garnaas, M., McMahon, G.M., Chu, A.Y., Tayo, B.O., Pattaro, C., Teumer, A., Chasman, D.I., Chalmers, J., et al. (2015). Genome-wide association study of kidney function decline in individuals of European descent. Kidney Int.87, 1017–1029.
8. Pattaro, C., Teumer, A., Gorski, M., Chu, A.Y., Li, M., Mijatovic, V., Garnaas, M., Tin, A., Sorice, R., Li, Y., et al.; ICBP Con-sortium; AGEN ConCon-sortium; CARDIOGRAM; CHARGe-Heart Failure Group; ECHOGen Consortium (2016). Genetic associ-ations at 53 loci highlight cell types and biological pathways relevant for kidney function. Nat. Commun.7, 10023. 9. Abecasis, G.R., Auton, A., Brooks, L.D., DePristo, M.A., Durbin,
R.M., Handsaker, R.E., Kang, H.M., Marth, G.T., and McVean, G.A.; The 1000 Genomes Project Consortium (2012). An inte-grated map of genetic variation from 1,092 human genomes. Nature491, 56–65.
10. Delaneau, O., Marchini, J., and Zagury, J.F. (2011). A linear complexity phasing method for thousands of genomes. Nat. Methods9, 179–181.
11. Howie, B., Fuchsberger, C., Stephens, M., Marchini, J., and Abecasis, G.R. (2012). Fast and accurate genotype imputation in genome-wide association studies through pre-phasing. Nat. Genet.44, 955–959.
12. Frazer, K.A., Ballinger, D.G., Cox, D.R., Hinds, D.A., Stuve, L.L., Gibbs, R.A., Belmont, J.W., Boudreau, A., Hardenbol, P., Leal, S.M., et al.; International HapMap Consortium (2007). A second generation human haplotype map of over 3.1 million SNPs. Nature449, 851–861.
13. Howie, B.N., Donnelly, P., and Marchini, J. (2009). A flexible and accurate genotype imputation method for the next gener-ation of genome-wide associgener-ation studies. PLoS Genet. 5, e1000529.
14. Winkler, T.W., Day, F.R., Croteau-Chonka, D.C., Wood, A.R., Locke, A.E., Ma¨gi, R., Ferreira, T., Fall, T., Graff, M., Justice, A.E., et al.; Genetic Investigation of Anthropometric Traits (GIANT) Consortium (2014). Quality control and conduct of genome-wide association meta-analyses. Nat. Pro-toc.9, 1192–1212.
15. National Kidney Foundation (2002). K/DOQI clinical practice guidelines for chronic kidney disease: evaluation, classification, and stratification. Am. J. Kidney Dis.39(2 Suppl 1), S1–S266. 16. Devlin, B., and Roeder, K. (1999). Genomic control for
17. Ma¨gi, R., and Morris, A.P. (2010). GWAMA: software for genome-wide association meta-analysis. BMC Bioinformatics
11, 288.
18. Ioannidis, J.P.A., Patsopoulos, N.A., and Evangelou, E. (2007). Heterogeneity in meta-analyses of genome-wide association investigations. PLoS ONE2, e841.
19. Machiela, M.J., and Chanock, S.J. (2015). LDlink: a web-based application for exploring population-specific haplotype struc-ture and linking correlated alleles of possible functional vari-ants. Bioinformatics31, 3555–3557.
20. Willer, C.J., Li, Y., and Abecasis, G.R. (2010). METAL: fast and efficient meta-analysis of genomewide association scans. Bioinformatics26, 2190–2191.
21. Kang, H.M., Sul, J.H., Service, S.K., Zaitlen, N.A., Kong, S.Y., Freimer, N.B., Sabatti, C., and Eskin, E. (2010). Variance component model to account for sample structure in genome-wide association studies. Nat. Genet.42, 348–354. 22. Morris, A.P. (2011). Transethnic meta-analysis of genomewide
association studies. Genet. Epidemiol.35, 809–822.
23. Franceschini, N., van Rooij, F.J.A., Prins, B.P., Feitosa, M.F., Karakas, M., Eckfeldt, J.H., Folsom, A.R., Kopp, J., Vaez, A., Andrews, J.S., et al.; LifeLines Cohort Study (2012). Discovery and fine mapping of serum protein loci through transethnic meta-analysis. Am. J. Hum. Genet.91, 744–753.
24. Wang, X., Chua, H.X., Chen, P., Ong, R.T., Sim, X., Zhang, W., Takeuchi, F., Liu, X., Khor, C.C., Tay, W.T., et al. (2013). Comparing methods for performing trans-ethnic meta-anal-ysis of genome-wide association studies. Hum. Mol. Genet.
22, 2303–2311.
25. Maller, J.B., McVean, G., Byrnes, J., Vukcevic, D., Palin, K., Su, Z., Howson, J.M., Auton, A., Myers, S., Morris, A., et al.; Well-come Trust Case Control Consortium (2012). Bayesian refine-ment of association signals for 14 loci in 3 common diseases. Nat. Genet.44, 1294–1301.
26.Bernstein, B.E., Stamatoyannopoulos, J.A., Costello, J.F., Ren, B., Milosavljevic, A., Meissner, A., Kellis, M., Marra, M.A., Beau-det, A.L., Ecker, J.R., et al. (2010). The NIH Roadmap Epigenom-ics Mapping Consortium. Nat. Biotechnol.28, 1045–1048. 27. ENCODE Project Consortium (2012). An integrated
encyclo-pedia of DNA elements in the human genome. Nature489, 57–74.
28. Pasquali, L., Gaulton, K.J., Rodrı´guez-Seguı´, S.A., Mularoni, L., Miguel-Escalada, I., Akerman, I., Tena, J.J., Mora´n, I., Go´mez-Marı´n, C., van de Bunt, M., et al. (2014). Pancreatic islet enhancer clusters enriched in type 2 diabetes risk-associated variants. Nat. Genet.46, 136–143.
29. Pickrell, J.K. (2014). Joint analysis of functional genomic data and genome-wide association studies of 18 human traits. Am. J. Hum. Genet.94, 559–573.
30. Lin, Y.R., Kim, K., Yang, Y., Ivessa, A., Sadoshima, J., and Park, Y. (2011). Regulation of longevity by regulator of G-protein signaling protein, Loco. Aging Cell10, 438–447.
31. Cechova, S., Zeng, Q., Billaud, M., Mutchler, S., Rudy, C.K., Straub, A.C., Chi, L., Chan, F.R., Hu, J., Griffiths, R., et al. (2013). Loss of collectrin, an angiotensin-converting enzyme 2 homolog, uncouples endothelial nitric oxide synthase and causes hypertension and vascular dysfunction. Circulation
128, 1770–1780.
32. Yang, Y., Parsons, K.K., Chi, L., Malakauskas, S.M., and Le, T.H. (2009). Glutathione S-transferase-micro1 regulates vascular smooth muscle cell proliferation, migration, and oxidative stress. Hypertension54, 1360–1368.
33. Deshmukh, H.A., Palmer, C.N., Morris, A.D., and Colhoun, H.M. (2013). Investigation of known estimated glomerular filtration rate loci in patients with type 2 diabetes. Diabet. Med.30, 1230–1235.
34. Sveinbjornsson, G., Mikaelsdottir, E., Palsson, R., Indridason, O.S., Holm, H., Jonasdottir, A., Helgason, A., Sigurdsson, S., Jonasdottir, A., Sigurdsson, A., et al. (2014). Rare mutations associating with serum creatinine and chronic kidney disease. Hum. Mol. Genet.23, 6935–6943.
35. Succurro, E., Arturi, F., Lugara`, M., Grembiale, A., Fiorentino, T.V., Caruso, V., Andreozzi, F., Sciacqua, A., Hribal, M.L., Perticone, F., and Sesti, G. (2010). One-hour postload plasma glucose levels are associated with kidney dysfunction. Clin. J. Am. Soc. Nephrol.5, 1922–1927.
36. Reiss, A.B., Voloshyna, I., De Leon, J., Miyawaki, N., and Mat-tana, J. (2015). Cholesterol Metabolism in CKD. Am. J. Kidney Dis.66, 1071–1082.
37. Chen, S., Bellew, C., Yao, X., Stefkova, J., Dipp, S., Saifudeen, Z., Bachvarov, D., and El-Dahr, S.S. (2011). Histone deacety-lase (HDAC) activity is critical for embryonic kidney gene expression, growth, and differentiation. J. Biol. Chem.286, 32775–32789.
38. Brilli, L.L., Swanhart, L.M., de Caestecker, M.P., and Hukriede, N.A. (2013). HDAC inhibitors in kidney development and disease. Pediatr. Nephrol.28, 1909–1921.
39. Keyser, P., Borge-Renberg, K., and Hultmark, D. (2007). The Drosophila NFAT homolog is involved in salt stress tolerance. Insect Biochem. Mol. Biol.37, 356–362.
40. Salzler, H.R., Griffiths, R., Ruiz, P., Chi, L., Frey, C., Marchuk, D.A., Rockman, H.A., and Le, T.H. (2007). Hyper-tension and albuminuria in chronic kidney disease mapped to a mouse chromosome 11 locus. Kidney Int. 72, 1226– 1232.
41. Dickson, S.P., Wang, K., Krantz, I., Hakonarson, H., and Gold-stein, D.B. (2010). Rare variants create synthetic genome-wide associations. PLoS Biol.8, e1000294.
42. Abecasis, G.R., Altshuler, D., Auton, A., Brooks, L.D., Durbin, R.M., Gibbs, R.A., Hurles, M.E., and McVean, G.A.; The 1000 Genomes Project Consortium (2010). A map of human genome variation from population scale sequencing. Nature
467, 1061–1073.
43. Trynka, G., Sandor, C., Han, B., Xu, H., Stranger, B.E., Liu, X.S., and Raychaudhuri, S. (2013). Chromatin marks identify critical cell types for fine mapping complex trait variants. Nat. Genet.45, 124–130.
44. Parker, S.C., Stitzel, M.L., Taylor, D.L., Orozco, J.M., Erdos, M.R., Akiyama, J.A., van Bueren, K.L., Chines, P.S., Narisu, N., Black, B.L., et al.; NISC Comparative Sequencing Program; National Institutes of Health Intramural Sequencing Center Comparative Sequencing Program Authors; NISC Compara-tive Sequencing Program Authors (2013). Chromatin stretch enhancer states drive cell-specific gene regulation and harbor human disease risk variants. Proc. Natl. Acad. Sci. USA110, 17921–17926.
46. Kichaev, G., and Pasaniuc, B. (2015). Leveraging functional-annotation data in trans-ethnic fine-mapping studies. Am. J. Hum. Genet.97, 260–271.
47. Bigazzi, R., Bianchi, S., Baldari, D., Sgherri, G., Baldari, G., and Campese, V.M. (1994). Microalbuminuria in salt-sensitive patients. A marker for renal and cardiovascular risk factors. Hypertension23, 195–199.
48. Bihorac, A., Tezcan, H., Ozener, C., Oktay, A., and Akoglu, E. (2000). Association between salt sensitivity and target organ damage in essential hypertension. Am. J. Hypertens. 13, 864–872.
49.Barba, G., Galletti, F., Cappuccio, F.P., Siani, A., Venezia, A., Versiero, M., Della Valle, E., Sorrentino, P., Tarantino, G., Fari-naro, E., and Strazzullo, P. (2007). Incidence of hypertension in individuals with different blood pressure salt-sensitivity: re-sults of a 15-year follow-up study. J. Hypertens.25, 1465–1471. 50. Thurau, K., and Schnermann, J. (1965). The sodium concen-tration in the macula densa cells as a regulating factor for glomerular filtration (micropuncture experiments). Klin. Wo-chenschr.43, 410–413.
51. Wilcox, C.S., and Welch, W.J. (1996). TGF and nitric oxide: ef-fects of salt intake and salt-sensitive hypertension. Kidney Int. Suppl.55, S9–S13.
52. Persson, A.E.G., Lai, E.Y., Gao, X., Carlstro¨m, M., and Pat-zak, A. (2013). Interactions between adenosine, angiotensin II and nitric oxide on the afferent arteriole influence sensitivity of the tubuloglomerular feedback. Front. Physiol.
4, 187.
53. Lu, Y., Wei, J., Stec, D.E., Roman, R.J., Ge, Y., Cheng, L., Liu, E.Y., Zhang, J., Hansen, P.B., Fan, F., et al. (2016). Macula Densa Nitric Oxide Synthase 1bProtects against Salt-Sensitive Hypertension. J. Am. Soc. Nephrol.27, 2346–2356.
54. Kanbay, M., Chen, Y., Solak, Y., and Sanders, P.W. (2011). Mechanisms and consequences of salt sensitivity and dietary salt intake. Curr. Opin. Nephrol. Hypertens.20, 37–43. 55. Morris, R.C., Jr., Schmidlin, O., Sebastian, A., Tanaka, M., and