Munich Personal RePEc Archive
Why does mutual fund performance not
persist? The impact and interaction of
fund flows and manager changes
Bessler, Wolfgang and Blake, David and Lückoff, Peter and
Tonks, Ian
Pensions Institute
March 2010
Online at
https://mpra.ub.uni-muenchen.de/34185/
DISCUSSION PAPER PI-1009
Why does Mutual Fund Performance not
Persist? The Impact and Interaction of Fund
Flows and Manager Changes
Wolfgang Bessler, David Blake, Peter Lückoff
and Ian Tonks
March 2010
ISSN 1367-580X
The Pensions Institute
Cass Business School
City University
106 Bunhill Row London
EC1Y 8TZ
UNITED KINGDOM
1
Why does Mutual Fund Performance not Persist?
The Impact and Interaction of Fund Flows and Manager Changes
Wolfgang Bessler, David Blake, Peter Lückoff and Ian Tonks1
First version: February 22, 2008 This version: March 15, 2010
1
2
Why does Mutual Fund Performance not Persist?
The Impact and Interaction of Fund Flows and Manager Changes
Abstract
This paper investigates the reasons for the lack of long-term persistence in the investment performance of actively managed equity mutual funds. We document that the responses of investors, fund managers, and investment management companies to past performance have an important impact on future performance. Conditioning on fund flows and manager changes allows us to predict future performance of both past outperforming (winner) and past underperforming (loser) funds. Recent winner funds, experiencing neither high inflows nor the departure of a skilled fund manager, outperform by 3.60 percentage points based on risk-adjusted returns in the following year, relative to winner funds suffering from both effects. We also find that the performance of the worst performing funds experiencing both the replacement of the fund manager (internal governance) and high outflows (external governance) enjoy a subsequent increase in performance of 2.40 percentage points in the following year, relative to loser funds not experiencing these effects. Among loser funds, in particular, both mechanisms appear to interact strongly.
JEL Classification: G28, G29, G32.
3
1 Introduction
It is now widely recognized that equity mutual fund performance does not persist in the long run,
although there is evidence for short-run persistence among both winner and loser funds.2 Berk and Green
(2004) argue that, if there are decreasing returns to scale in active management and investors react to
past performance, the asset base managed by a portfolio manager adjusts to her individual skill level,
driving away previous out- or underperformance. Their model implies that fund flows is one key
mechanism that prevents persistent outperformance, but also removes persistent underperformance.
Large money inflows into recent winners usually reduce future performance through transaction
costs and distorted trading decisions, as reported by Edelen (1999) and Alexander, Cici and Gibson
(2007). However, these studies also report that outflows are as harmful for future performance as
inflows, a finding that is incompatible with Berk and Green (2004)’s claim that underperforming funds
benefit from withdrawals. Chen et al. (2004) report that small funds outperform large funds, an outcome
that is consistent with decreasing returns to scale in fund management. However, they do not relate their
results to past fund flows. We extend this analysis and ask whether the response of fund flows to past
performance is large enough to explain the mean reversion in performance of both winner and loser
funds.
It is not only outside investors who react to past performance. Both the portfolio manager and the
investment management company (IMC) might also react: an alternative mechanism to explain mean
reversion in fund performance is manager changes (Khorana, 1996, 2001). A successful fund manager
can increase her compensation by switching to another fund, while the IMC can replace a poorly
performing manager. Dangl, Wu and Zechner (2008) develop a model in which poorly performing
managers are subject to both “external governance” from investors withdrawing funds and “internal
2
4
governance” associated with the termination of their contracts. It is important to analyze both
mechanisms jointly.
The objective of our research is to investigate how far fund flows and manager changes act as
“equilibrating mechanisms” (as defined by Berk and Green, 2004, p. 1271) to explain mean reversion in
mutual fund returns and, if so, how both mechanisms interact. We analyze these effects for a CRSP
sample of 3,946 actively managed U.S. equity mutual funds over the period from 1992 to 2007. The
performance of decile portfolios formed on the basis of past performance is evaluated, concentrating on
the winner (top-decile) and loser (bottom-decile) portfolios. These winner and loser portfolios are split
into subgroups based on fund flows and manager changes, and we examine the contribution of these
alternative equilibrating mechanisms on performance.
We provide empirical evidence that fund flows and manager changes are important mechanisms
for weakening performance persistence, both individually and in combination. The average four-factor
alpha of winner funds that receive high inflows is reduced by an average of 2.52 percentage points in the
following year compared with winner funds that do not experience extreme inflows. We also find that
manager changes have a significant impact on the performance persistence of past winner funds. Losing
a top-decile manager results in a 1.44 percentage points lower performance in the following year
compared with winner funds that keep their star manager. Moreover, we find that both mechanisms help
to predict future performance, allowing us to identify those winner funds that continue to significantly
outperform a four-factor benchmark. Winner funds not experiencing these mechanisms – having
relatively low net inflows and no change in manager – outperform those winner funds suffering both
effects simultaneously, with a spread of 3.60 percentage points in the following year. This is
approximately equal to the sum of the separate effects, indicating that the effects, in the case of winner
funds, are additive and neither magnify nor offset each other. These results are not driven by differences
5
Our results for losing funds are different. We find that the more important equilibrating
mechanism is internal (manager replacement) rather than external governance (outflows) which conflicts
with the predictions of the Berk and Green (2004) model for loser funds. We find that, even though
loser-fund raw returns benefit from withdrawals, alpha improves only by an insignificant 1.08
percentage points relative to funds without outflows, implying outflows do not allow the existing
managers to improve their performance from managing a smaller asset base. Manager changes, on the
other hand, play an important role in the governance of loser funds both separately and in combination
with fund flows. Firing an underperforming manager significantly improves loser-fund performance by
an average of 0.96 percentage points in the following year relative to loser funds that keep the same
manager. More significantly, internal and external governance mechanisms strongly reinforce each other
and are more effective if applied simultaneously. The combined positive effect of 2.40 percentage points
higher performance compared with funds not benefiting from either governance mechanism is larger
than the sum of the individual effects. This finding indicates that outflows cannot improve performance
on their own, but that outflows strongly contribute to performance reversals and, hence, to mean
reversion if the manager is also replaced. Our results support the conjecture in Dangl, Wu and Zechner
(2008) that it is important to control for manager changes when analyzing the role of external
governance (fund flows).
The rest of the paper proceeds as follows. The next section presents a review of the literature and
our hypotheses. In section 3, we describe our data set and explain our research methodology. Our results
are discussed in section 4: we first analyze funds flows, manager changes and their interaction separately
for winner and loser funds before we perform a robustness check using a pooled regression approach.
6
2 Literature Review and Hypotheses
There is overwhelming empirical evidence that superior mutual fund performance does not persist in the
long run, once survivorship bias is taken into account (Hendricks, Patel and Zeckhauser, 1993; Elton,
Gruber and Blake, 1996a, 1996b; Carhart, 1997; Pastor and Stambaugh, 2002). For outperformers, the
traditional explanations for this phenomenon are the size of management fees and other costs, the
absence of genuine management skill, and the momentum effect in individual stock returns spilling over
into the subsequent evaluation period of fund performance (Carhart, 1997). By contrast, although some
underperformers do improve their performance, the majority continue to underperform significantly their
benchmarks, indicating that any persistence is clustered around loser funds (Brown and Goetzmann,
1995; Carhart, 1997). Recent studies, however, point towards the persistence and predictability of
short-term fund performance (Bollen and Busse, 2005; Busse and Irvine, 2006; Huij and Verbeek, 2007).
These studies challenge the traditional explanations for a lack of performance persistence. Fees are fairly
stable and cannot explain why persistence exists in the short run, but vanishes over longer horizons.
Berk and Green (2004) argue that mutual fund market equilibrium is attained through fund flows.
Several studies show that investors respond to recent superior performance and ratings by investing
additional funds and thus increasing the asset size of winner funds.3 Berk and Green’s argument relies on
there being decreasing returns to scale in active fund management. Chen et al. (2004) and Yan (2008)
provide evidence that transaction costs are positively correlated with fund size and the degree of
illiquidity of the investment strategy. New investments of large funds are typically restricted to a limited
range of liquid stocks and good investment opportunities eventually vanish as funds hit the capacity
constraints on their investment strategies. Pollet and Wilson (2008) show that, rather than generate more
“best ideas”, fund managers instead tend to scale up existing holdings as a response to inflows. Edelen
(1999) and Alexander, Cici and Gibson (2007) argue that excessive fund flows encourage
3
7
motivated, rather than valuation-motivated, investments and induce immediate transaction costs, both of
which are detrimental to fund performance in the short run.4
Consistent with the Berk and Green hypothesis of decreasing returns to scale, Chen et al. (2004)
document that small funds significantly outperform large funds. However, differences in fund sizes are
the result of both differences in the inflows accumulated throughout a fund’s full history since inception
(external growth) and differential performance (internal growth) and so will only be of indirect relevance
for testing the Berk and Green hypothesis. By contrast, our analysis directly investigates the role of
investors’ responses to past performance and the importance of fund flows as an equilibrating
mechanism. We extend the study of Chen et al. (2004), first, by considering differences in capacity
constraints between winner funds and loser funds and, second, by allowing for capacity constraints
relative to initial fund size, but at different levels of absolute fund size. This accounts for the possibility
that capacity constraints differ across funds depending on their investment strategy.
Fund growth is a relevant objective for fee-maximizing IMCs because management fees are
usually a percentage of assets under management (AUM). Large net inflows do not benefit existing
investors, however. To minimize the negative impact of inflows, while simultaneously increasing the
compensation to successful managers, some funds might close to new investors in an attempt to preserve
their superior performance and then increase fees. Empirical evidence, however, suggests that this does
not tend to prevent a subsequent significant deterioration in alpha (Bris et al., 2007). Star fund managers
can extract a larger share of the higher fee income by either moving to a larger fund within the same
organization or to another IMC altogether if they are unable to negotiate an acceptable compensation
4
8
package related to the higher fee income received by the IMC.5 Moreover, a successful manager
anticipating that she will not be able to repeat her outstanding performance in the future, mey decide to
use her current favorable track record to find a higher paid job with a new IMC. In this case, the decision
to stay or to leave will be the result of the manager’s own assessment of her investment skill. Empirical
evidence indicates that promotions, with a successful fund manager subsequently managing a larger
fund, are positively linked to past performance (Hu, Hall and Harvey, 2000; Baks, 2006). In any case, a
winner fund that loses its star manager will need to hire a new manager, presumably with lower skills.
Therefore, we would expect fund performance to deteriorate after the hiring of a new manager. Using a
sample of 393 domestic equity and bond fund managers that were replaced over the period from 1979 to
1991, Khorana (2001) finds that a manager change in outperforming funds results in a deterioration in
post-replacement performance from 1.9 percent in the pre-replacement period to 0.4 percent in the third
year. It appears manager changes can act as an additional curb on performance persistence to that arising
from fund flows.
Building on these arguments, our data set allows us to investigate the following hypotheses and
questions about the joint effects of fund flows and manager changes on performance persistence in
outperforming equity mutual funds:
y Fund flows: Investors chase past performance and future performance suffers from high inflows,
leading to stronger mean reversion for winner funds with higher net inflows.
y Manager changes: A fund manager who leaves a winner fund is replaced with a less skilled
manager, resulting in reduced performance and stronger mean reversion for winner funds with a
change in manager.
5
9
y Which effect has the bigger impact on eliminating performance persistence? Are both effects in
combination additive, magnifying or offsetting?
In terms of Berk and Green (2004), for those winner funds that need to replace a departing fund
manager, the fund size is now too large relative to the skill level of this new manager. These funds
should subsequently underperform compared with winner funds without a manager change. Thus, an
increase in fund size relative to managerial skill is the underlying factor causing both equilibrating
mechanisms to lower performance.
In addition to the long-term effect through an increased fund size, the fund-flow channel also
captures the negative short-term effect of liquidity-induced transactions on performance, which is absent
in the case of a size adjustment through manager change. We would, therefore, expect the
fund-flow channel to act as a stronger curb on performance. On the other hand, the departure of a star fund
manager might have a more negative impact on performance than the transactions costs associated with
increased fund flows. So which effect has the larger impact will be an empirical issue.We would expect
the combination of high inflows and manager changes to result in even more pronounced mean
reversion. But it will also be an empirical issue whether the combined negative impact of inflows and
manager changes on performance is simply the sum of the individual effects or whether the two effects
are reinforcing or offsetting.
In the case of underperforming (i.e., loser) funds, Dangl, Wu and Zechner (2008) consider
alternative strategies for investors and the IMC. Once a fund has been identified as poorly performing,
investors could choose to move their assets to a fund with greater potential: in other words, investors
could exercise external governance and vote-by-feet. Yet, empirical evidence indicates that many
investors in poorly performing funds fail to withdraw their investments (Sirri and Tufano, 1998; Lynch
10
the firing of a poorly performing manager, or because of a disposition effect.6 Transaction costs and the
costs involved in gathering information about alternative funds will further reduce the mobility of
capital. The consequence is that the fund-flow equilibrating mechanism is weak in underperforming
funds and poor performance may persist, at least in the short term (Carhart, 1997; Berk and Tonks,
2007). Large outflows, in particular, result in liquidity-motivated transactions which distort fund
performance in the short term and impose an even stronger cost on loser funds than they do on winner
funds. Coval and Stafford (2007) find that the performance of loser funds in distress and experiencing
large outflows, hence making their trades predictable by others, deteriorates even more. These short-term
liquidity-induced trading effects work in the opposite direction to the long-term effects on returns from
decreasing returns to scale and this makes it more difficult for the performance of loser funds to return to
the mean.7 Consequently, the fund-flow channel will be weaker among losers than winner funds.
Several studies also document an inverse relationship between fund performance and manager
changes (Khorana, 1996; Chevalier and Ellison, 1999b; Gallagher and Nadarajah, 2004). Moreover,
demotions – the manager subsequently manages a smaller fund – are negatively linked to past
performance (Hu, Hall and Harvey, 2000; Baks, 2006).8 For underperforming funds, Khorana (2001)
documents that performance improves post replacement, with abnormal performance improving from
-2.40 percent in the year before replacement to 0.50 percent in the third year after replacement. Hence,
manager changes also appear to place a curb on (poor) performance persistence.
6
Investors are reluctant to realize losses and so stay invested until the fund price returns to the original purchase price (Shefrin and Statman, 1985).
7
Note that in case of winner funds, the short-term effects of liquidity-induced trading and the long-term effects of decreasing returns to scale both operate in the same direction, magnifying the negative impact of inflows on winner-fund performance.
8
11
We will investigate the following hypotheses and questions about the effects of fund flows and
manager changes on performance persistence in underperforming equity mutual funds:
y Fund flows: Investors withdraw their money and performance improves as a result of a smaller
asset base, since managers can concentrate on the most profitable investment opportunities and
this leads to stronger mean reversion for loser funds with higher outflows, although this effect
might be dampened by any investor inertia and by the costs of rearranging portfolios.
y Manager changes: The IMC fires an underperforming fund manager and performance improves
under a newly appointed fund manager, leading to stronger mean reversion for loser funds with a
change in manager.
y Which effect has the bigger impact on eliminating performance persistence? Are both effects in
combination additive, magnifying or offsetting?
Loser funds which replace their underperforming manager with a presumably better manager should
subsequently outperform loser funds without a manager change. We would expect loser funds to benefit
more from a manager replacement than from outflows. This is because the fund-flow channel involves
transaction costs arising from the forced sales of assets. While the new manager will almost certainly
change the asset composition of the fund, this can be done gradually without a market impact. On the
other hand, significant fund outflows will lead to a quicker and more radical restructuring of the
portfolio and consequently a faster return to normal performance. So again it is an empirical matter
about which effect dominates. The question of how both mechanisms interact is also an empirical one.
They are likely to be reinforcing when both mechanisms occur simultaneously, such as where an IMC
fires a poorly performing fund manager in an attempt to stem outflows.9 But their effects would be
neutralized in the case where investors fail to withdraw money from poorly performing funds in
9
12
anticipation of a manager change, but the IMCs delays firing the poorly performing fund manager
because outflows did not materialize.
3 Data and Research Methodology
3.1 Data
The data on mutual funds and the benchmarks are obtained from CRSP. Our sample starts in 1992, the
first year for which reliable information on manager changes becomes available, and it ends in 2007. In
constructing our sample, we follow Pastor and Stambaugh (2002) as closely as possible and select only
actively managed domestic equity funds.10 We aggregate all share classes of the same fund and drop all
observations prior to the IPO date given by CRSP and funds without names in order to account for a
potential incubation bias (Evans, 2010). Our final sample consists of 3,946 funds that existed at some
time during the period from 1992 to 2007 for at least 12 consecutive months. These funds have an
average fund size of 899 million USD (Table 1). Fund size increased over the sample period, whereas
average fees fell from 1.68 percent to 1.56 percent, as a result of economies of scale in direct expenses
involved in asset management.11
[ Please insert Table 1 about here ]
Monthly fund flows are constructed from the change in total net assets adjusted for internal growth due
to investment returns:
(1) flowit =TNAit −TNAit−1 (1+rit)
where TNAit refers to the total net assets of fund i at the end of period t and rit is the return of fund i
between t-1 and t, assuming that all distributions are reinvested and net of fund expenses. Following the
10
Details about the data selection are given in the appendix.
11
13
argument of Berk and Tonks (2007), absolute flows are scaled by TNAit-1(1+rit) in order to obtain
relative flows.12 On average, each fund received 2.70 million USD net inflows per month.
To obtain information on manager changes, we focus on the variable mgr_date in the CRSP
database, instead of using the specific names of the managers.13 This variable provides the date of the
last manager change as reported by the IMC. By using the mgr_date variable, we avoid any problems
associated with different spellings of manager names. Furthermore, as the number of team-managed
funds increased during recent years, the manager date variable has the advantage that IMCs only report
significant changes in manager that might have an impact on performance (Massa, Reuter and Zitzewitz,
2010). A total of 6,492 manager changes occurred during our sample period. On average, 19 percent of
the fund managers are replaced each year which is consistent with other studies.14
3.2 Research Methodology
We use both ranked portfolio tests (Carhart, 1997; Carpenter and Lynch, 1999; Tonks, 2005) and pooled
regressions to investigate the hypotheses in Section 2.
Ranked portfolio tests Funds are first ranked into decile portfolios based on their
previous-year performance.15 Then, a second sorting of the top-decile-10 and the bottom-decile-1 funds is carried
12
If a fund merges with another one, we do not count the incoming assets as fund flows, because there is no additional cash to invest. Thus, the fund manager does not face the immediate problem of investing the inflows, but can adjust the portfolio weights gradually over time to minimize the performance impact.
13
This variable has also been used by Lynch and Musto (2003) and Cooper, Gulen and Rau (2005). In theory, it shows the date that the manager leaves. However, for around 80 percent of observations, this is always the first of January. For the years 1992 and 1993, the variable is evenly distributed over different months. We conclude from this that the variable can only be used as an indicator of the year in which there was a manager change. One implication of this is that our data set is not sufficiently granular to investigate the impact of timing differences between fund flows and manager changes on subsequent fund performance. In other words, we are unable to test whether fund flows pre-date and hence possibly ‘cause’ a manager change or vice versa. We are only able to indicate that there were changes in fund flows as well as a manager change within the same year and then assess what effect these had on a fund’s subsequent performance.
14
Chevalier and Ellison (1999a) report 18 percent and Ding and Wermers (2006) report 14 to 18 percent using a more detailed database on fund managers constructed from various sources.
15
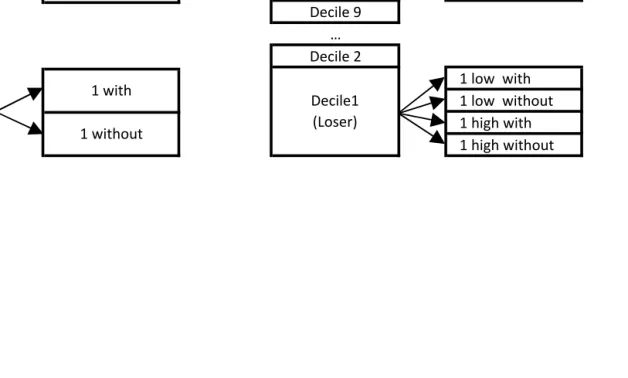
14
out.16 Specifically, we form subgroups of the winner and loser deciles based on a single sorting on fund
flows (high net inflows / low net inflows) or manager change (with manager change / without manager
change), respectively (Figure 1). Furthermore, as we are interested in the interaction effects between
both mechanisms, we form subgroups of the winner and loser decile based on a double sorting on fund
flows and manager change simultaneously (high with / high without / low with / low without). The first
sorting, based on past performance, separates good from bad managers, since we are interested in
whether the same mechanisms that prevent persistent outperformance of skilled managers can also
explain why badly performing managers regress towards the mean. We aim to separate the effects of a
skilled manager leaving the fund or investors allocating large amounts of money to good managers from
the effects of sacking an unskilled manager (i.e., internal governance) or investors withdrawing money
from a bad manager (i.e., external governance). We then analyze the performance of these subgroups of
top and bottom deciles, as well as the performance of spread portfolios to compare alternative
investment strategies.
In Berk and Green (2004), active management suffers from decreasing returns to scale, but it is
an empirical question whether these capacity constraints are absolute or relative. Absolute capacity
constraints arise once a certain threshold of absolute fund size is exceeded and depend on absolute fund
flows. Relative capacity constraints differ across investment strategies and arise after the fund receives a
certain level of inflows relative to the initial fund size. We analyze both absolute and relative net
inflows, but in the presentation of our results we concentrate on absolute flows and only discuss relative
flows when there are additional insights.
[ Please insert Figure 1 about here ]
16
15
Formation The formation of decile portfolios is created by the first sorting and, to do this, we
need to measure the alpha of each fund in the previous year. Specifically, funds are ranked based on
alphas from a Carhart (1997) four-factor model estimated over the previous 12 months (the formation
period). This model incorporates the Fama-French (1993) size (SMB) and value (HML) factors and the
Carhart momentum factor (MOM) in addition to the market excess return (ermt) to explain fund excess
returns and account for different fund styles:
(2) erit =αi +β1iermt +β2iSMBt +β3iHMLt +β4iMOMt +εit
In order to efficiently estimate a four-factor model over such a short horizon, we apply a Bayesian
adjustment (Huij and Verbeek, 2007). This procedure involves the estimation of the Carhart model for
each fund separately using OLS. Then the averages of the parameters of all other funds during the same
period are used as priors. The final alpha and beta parameters for each individual fund are obtained as
weighted averages of the OLS parameters and the prior, where the weights depend on the estimation
efficiency of the OLS parameters.17 Thus, the Bayesian adjustment ‘shrinks’ any extreme parameters
towards a grand mean, taking into account the cross-sectional distribution of the parameters.18 The
intuition behind this Bayesian adjustment is that it is less likely that a fund will genuinely generate high
alphas if all other funds generate relatively low alphas during the same period.19 Using a similar
argument, Cohen, Coval and Pastor (2005) attribute a higher skill level to fund managers who produce
their outperformance with a similar strategy to other skilled fund managers in comparison with managers
who used a completely different strategy. The latter are classified as lucky rather than skilled.
17
Further technical details are given in Huij and Verbeek (2007).
18
This also reduces a potential market-climate-bias of the alpha due to omitted risk factors. We thank Hendrik Scholz for pointing this out.
19
16
Evaluation In the evaluation period, we investigate the investment performance of the deciles
and decile subgroups. Funds that drop out of the portfolios due to merger or closure remain in the decile
until their last month of operation and then the portfolio weights are readjusted accordingly to avoid any
look-ahead bias.20,21 We used three models to evaluate performance. The first is the four-factor Carhart
model as specified in equation (2). The second is a five-factor model that adds a mean reversion factor22
to the Carhart model: if winner funds hold on to winner stocks for another one or two years, these winner
stocks might eventually experience mean reversion in returns (De Bondt and Thaler, 1985, 1987). The
third is a five-factor model that adds a liquidity factor23 to the Carhart model on the grounds that fund
flows might also affect portfolio liquidity. We also analyzed performance based on raw returns as an
additional robustness test in case a potentially omitted factor in the model used for formation and
evaluation biases the results. However, we only present the four-factor model results and comment on
the other specifications if they provide additional insights.
Pooled regressions We also perform a pooled regression with the difference in annualized
performance between the evaluation year and the formation year as the dependent variable. These
performance changes over time are then regressed on a set of control variables, including net inflows and
a manager change dummy. This regression offers insights into the impact of fund flows and manager
changes on fund performance over time. Furthermore, it provides us with the opportunity not only of
20
Carhart (1997) defines look-ahead bias as the bias that results from eliminating funds from the sample that fail to survive a minimum period of time after the ranking period.
21
Assuming, in case of a merger, that all investors of the acquired funds subsequently hold the acquiring funds by “following the money” does not alter our conclusions (the evidence for this is not reported but available from the authors on request).
22
This factor is based on six value-weighted portfolios formed on the size and prior returns of all NYSE, AMEX and NASDAQ stocks. A stock is classified as big (small) if its market capitalization is higher (lower) than the median of all NYSE firms. Past returns are measured over the previous four years lagged by one year, where “high returns” means higher than the 70th percentile and “low returns” means lower than the 30th percentile. The mean reversion factor is then the average of the low-prior-return portfolios minus the high-prior-return portfolios in both size groups. We thank Kenneth French for providing these data on his website.
23
17
separating the effects of fund flows and manager changes, but also of measuring their marginal impact
and their interaction with other fund characteristics.
4 Empirical Results
4.1 Ranked Portfolio Tests
We begin the presentation of our results by discussing the characteristics and performance of the fund
deciles. The three top-ranked fund deciles have significantly positive alphas in the formation year, while
the bottom five deciles significantly underperform the four-factor benchmark (Table 2). The spread
between the top and bottom decile is a significant 1.86 percentage points per month. We find some
evidence of mean reversion in fund performance in both winner and loser funds, particularly the former.
In the evaluation period, the alphas of the three highest deciles are insignificantly different from zero,
while the bottom three deciles continue to significantly underperform, although their performance levels
improve considerably in comparison with the formation period. The monthly performance of winner
funds decreases by an average of 0.81 percentage points between the formation and evaluation periods to
0.07 percent in the evaluation period. Loser-fund performance improves from -0.97 to -0.24 percent per
month between the formation and evaluation periods, a change of 0.73 percentage points. The spread
between winner and loser funds is reduced to 0.32 percentage points in the evaluation period: since this
spread is just statistically significant, we conclude that there is still some degree of performance
persistence after one year. A similar pattern of mean reversion emerges for raw returns (Figure 2).
[ Please insert Table 2 and Figure 2 about here ]
This residual spread of 0.32 percentage points per month can partly be attributed to higher fees
and to potentially higher transaction costs arising from the higher turnover of decile-1 funds compared
with decile-10 funds: see Table 3.24 This table shows that the outperforming deciles, in particular, the
24
18
winner-decile-10 funds, have high net inflows, consistent with investors chasing past performance.
These winner funds have inflows of 14.52 million USD per month in the evaluation period, but they also
experienced high inflows in the formation period, with mean absolute inflows of 10.71 million USD per
month. This suggests that some investors – the more sophisticated ones – have quicker reaction times
than others. Decile-10 funds are amongst the second smallest size groups during the formation period,
with an average size of 757.58 million USD. This is consistent with the results of Chen et al. (2004) that
only small funds are able to beat the benchmark.25 However, as a result of inflows and capital
appreciation, winner funds grow to an average size of 1,059.93 million USD in the evaluation period
which is larger than the average of the funds in any of the bottom five performing deciles. Loser funds,
by contrast, experience only modest average outflows of 1.23 million USD in the formation period and
only slightly larger outflows of 4.05 million USD in the evaluation period, indicating some form of
investor inertia. The average size of loser funds remains virtually unchanged between the formation
period (at 684.31 million USD) and the evaluation period (at 673.59 million USD).
Comparing the fund flows of median winner and loser funds, instead of average funds, reveals
that fund flow levels are roughly equal and opposite between winner and loser funds, especially in the
evaluation period. This suggests that the asymmetric flow response to positive and negative performance
documented in the previous literature might be driven by extreme inflows into a small number of winner
funds.26
Having established that performance persistence is mean reverting amongst both winner funds
and loser funds, we now investigate how fund flows and manager changes influence this.
[ Please insert Table 3 about here ]
25
The fact that decile-1-loser funds are also the smallest funds indicates that being a small fund is not sufficient to beat the benchmark.
26
19
4.2 Winner Funds
The effect of fund flows Winner funds are separated by our second sorting into a subgroup with low
absolute net inflows, averaging -4.50 million USD per month during the formation period, and a
subgroup with high absolute net inflows, averaging 25.78 million USD per month (Table 4). The fraction
of managers leaving winner funds is similar for both subgroups.
[ Please insert Table 4 about here ]
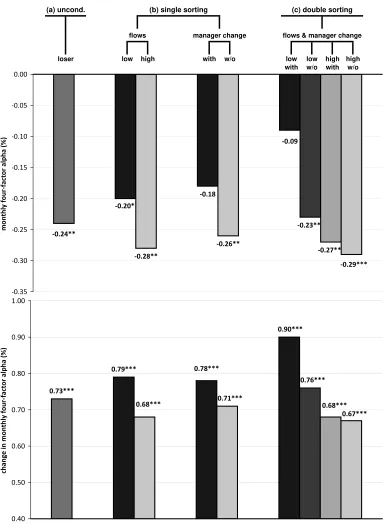
In terms of investment performance, winner funds which suffer from high absolute net inflows
generate negative, though insignificant monthly alphas, of -0.05 percent in the evaluation year (Table 5).
Winner funds which do not experience large absolute inflows have higher, though still insignificant,
alphas in the evaluation year of 0.16 percent. The spread between the two subgroups conditioned on
absolute net inflows is a significant 0.21 percentage points. Moreover, comparing the degree of mean
reversion, defined as the difference in alphas between the formation and the evaluation period, reveals
that the performance of the high-inflow subgroup moves towards the mean by -0.99 percentage points,
while the low-inflow subgroup moves by only -0.67 percentage points. Figure 3 shows that conditioning
on fund flows helps to predict both differences in future performance and in the degree of mean
reversion. More extreme inflows lead to even stronger results.27 We therefore have clear evidence
indicating that fund flows explain the lack of performance persistence among winner funds, confirming
the Berk and Green (2004) hypothesis.
[ Please insert Table 5 and Figure 3 about here ]
27
20
Winner funds with low absolute net inflows have an average size of 507.53 million USD which
is only about half the size of winner funds with high absolute net inflows (1041.47 million USD). Thus,
part of the difference in performance might be explained by differences in size rather than flows.28 To
test this, we analyze the results from a second sorting based on relative fund flows. The two subgroups
are now closer in size and the low-relative-inflow subgroup is actually larger (816.61 versus 733.99
million USD). However, the basic conclusions remain the same: the low-net-inflow subgroup
outperforms the high-net-inflow subgroup by a significant 0.16 percentage points per month. Both,
absolute and relative capacity constraints seem to matter for winner funds.
Bris et al. (2007) report that funds which close to new investors after a period of superior
performance switch from average four-factor alphas of 0.96 percent per month to 0.15 percent, a
significant decrease of 0.81 percentage points. They interpret this result as evidence against their good
stewardship hypothesis which postulates that fund closures are intended to sustain good performance. By
contrast, our results indicate that funds sheltered from inflows significantly outperform those
experiencing inflows in the subsequent year. Thus, even though mean reversion in performance is
present in all funds, the closure of a successful fund to new inflows can still make an important
contribution to sustaining their superior performance (at least for another year).
The effect of manager changes We find evidence supporting the hypothesis relating to
manager changes. Winner-decile-10 funds that lose their skilled manager generate an insignificant
average monthly alpha of -0.02 percent. By contrast, winner funds that keep the same manager deliver
positive, although still insignificant, alphas of 0.10 percent (see Figure 3). The spread of 0.12 percentage
points, however, is statistically significant.29 The degree of mean reversion is also higher at -0.89
28
Note, however, that funds in the two smallest size groups of Chen et al. (2004) have an average fund size of only 4.7 and 22.2 million USD, respectively, indicating that sorting on absolute fund flows leads to quite different results from sorting on fund size.
29
21
percentage points in the case where the manager changes, compared with -0.79 percentage points for the
subgroup without a manager change. Thus, manager change can also partly explain mean reversion
among winner funds. But the magnitude of the manager-change channel in inducing mean reversion is
slightly smaller than that for the inflow channel, consistent with the hypothesis in Section 2 above.
Interaction effects To examine the joint effect of fund flows and manager changes, we perform
a double sort on both equilibrating mechanisms resulting in four subgroups. Table 6 reports the alphas
for winner-decile subgroups conditioned on both mechanisms and the resulting spread portfolios.
Winner funds experiencing neither inflows nor a manager change (weakly) significantly outperform the
four-factor benchmark by 0.18 percentage points per month. This corresponds to a mean reversion of
only -0.65 percentage points per month. By contrast, winner funds suffering from both high inflows and
a manager change generate negative, although, insignificant alphas of -0.12 percent per month, a degree
of mean reversion of -1.02 percentage points per month. The statistically significant spread of 0.30
percentage points per month30 is only slightly lower than the sum of the individual effects.31 These
results indicate that, in the case of winner funds, the two effects are additive and neither magnify nor
offset each other in combination.
[ Please insert Table 6 about here ]
The double sorting also allows us to analyze marginal effects. The occurrence of a manager
change seems to be independent of fund flows, since, on average, 22 percent of managers change each
year in both subgroups with high and low net inflows (Table 4). The difference in fund flows between
might simply retire and be replaced by a new younger successor in the normal course of events and the IMCs of successful funds might be able to attract an above-average replacement in such circumstances.
30
This is the evaluation-period alpha on the “10 low without – 10 high with” spread portfolio (Table 6).
31
22
winner funds without and those with a manager change is statistically significant but economically small
at 4.49 million USD. As both mechanisms appear to be independent of each other, we would expect that
controlling for one mechanism would not alter the impact of the other. This is indeed the case.
Irrespective of whether the manager changes or not, fund flows have a significantly negative impact on
performance of between 0.21 and 0.22 percentage points per month.32 When there is a manager change,
alpha declines to an insignificant 0.07 percent for the low-inflow subgroup and to an equally
insignificant 0.09 percent for the high-inflow subgroup.33 Comparing the subgroups “10 low with” and
“10 high without” allows a comparison of the strength of both mechanisms. The statistically significant
monthly spread of 0.13 percentage points again confirms that, among winner funds, fund flows is a more
important equilibrium mechanism than manager change. Figure 3 also reveals a monotonic decrease in
alphas between the two extreme subgroups, with fund flows again having the stronger impact on
performance than manager changes.
To summarize, the results for winner funds lend strong support to the hypothesis of Berk and
Green (2004) that fund flows is a key mechanism bringing active mutual fund outperformance back into
equilibrium where expected abnormal returns are zero. However, another equilibrating mechanism,
manager changes also contribute to this effect. As expected, winner funds subject to both mechanisms
simultaneously experience the largest performance deterioration. Conditioning on both mechanisms
explains 37 percent34 of the unconditional mean reversion of winner funds. Fund flows are, however, a
more important equilibrating mechanism than manager changes. Nevertheless, the two effects are
additive.
32
This result is based on a comparison of the “10 low without” and “10 high without” subgroups and a comparison of the “10 low with” and “10 high with” subgroups, respectively.
33
In unreported results, we find that, for the high-relative-net-inflow subgroup, the spread between funds without and with a manager change is a significant 0.15 percentage points per month.
34
23
4.3 Loser funds
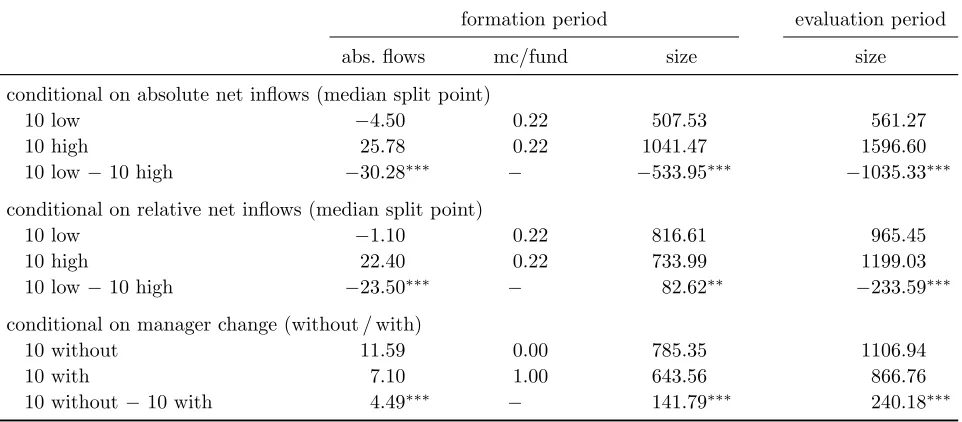
The effect of fund flows The second sorting on absolute net inflows divides loser funds into a
subgroup with low net inflows, experiencing average monthly net inflows of -10.72 million USD, and a
subgroup with high net inflows of 8.15 million USD (Table 7). The low-net-inflow funds are larger than
the high-net-inflow funds during the formation period, 792.06 million USD compared with 593.03
million USD. This difference is evened out by subsequent differences in fund flows, resulting in a
difference in size of only 20.62 million USD in the evaluation period. There are no notable differences in
characteristics between the subgroups with and without a manager change.
[ Please insert Table 7 about here ]
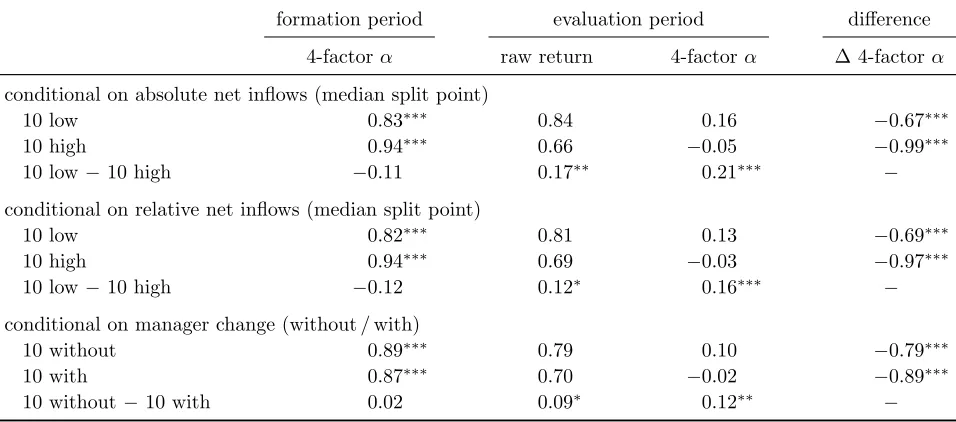
Conditioning on absolute fund flows, we find that loser funds with outflows have significant 0.12
percentage points per month higher raw returns in the evaluation period than loser funds with inflows,
revealing the impact of external governance (Table 8). However, comparing raw returns with four-factor
and five-factor alphas reveals that this spread is partly explained by differences in risk exposures: loser
funds with outflows appear to hold on to both momentum loser stocks, which continue to underperform,
and long-term winner stocks, which exhibit mean reversion, to a much smaller extent than loser funds
without significant outflows, i.e., manager inertia is much more prevalent in the latter case.35 Further,
Figure 4 shows that the alphas of loser funds that benefit from outflows are only slightly higher than the
alphas of loser funds without significant outflows and both subgroups continue to significantly
underperform.36 Consequently, the predictions of Berk and Green (2004) on the fund-flow mechanism
operating amongst loser funds do not find strong support in our data.
[ Please insert Table 8 and Figure 4 about here ]
35
These results are not reported in the tables but are available from the authors on request.
36
24
A standard explanation for the weak support for the Berk and Green (2004) hypothesis for loser
funds is that a large fraction of investors are reluctant to withdraw money (Berk and Tonks, 2007).
Indeed, the difference in average fund flows between the low- and high-fund-flow subgroups of loser
funds is only about two-thirds as large as the same difference for winner funds (18.87 million USD
versus 30.28 million USD).37 Therefore, the external incentive for poorly performing fund managers to
change their portfolios and improve performance is not a powerful one.38 This behavior is consistent
with the disposition effect, whereby investors are hesitant to realize losses and so stay invested in the
hope that the fund price eventually returns to the original purchase price. Investors perhaps hope that the
equilibrating mechanisms will work without them having to incur any additional effort or costs. In the
presence of transaction costs and some degree of mean reversion, few investors will be willing to be
early sellers. But, our results show that staying invested in loser funds is a sub-optimal strategy, since
performance remains negative, while investors could alternatively earn 0.18 percent abnormal monthly
returns by switching to previous-year winner funds with lower inflows and no manager change, an
additional return likely to be sufficient to cover switching costs.
To test whether a stronger response by investors would improve loser-fund performance even
more, we repeat the above analysis, but focus only on loser funds being in the highest or lowest
net-inflow quintiles instead of using the median as a split point. The general conclusion remains the same.39
Thus, even if investors do withdraw significant amounts of money from loser funds, we find little
support for the Berk and Green (2004) hypothesis. The reason seems to be a failure of the manager to
37
Median differences are not reported in the tables but reveal a similar picture.
38
Berk and Tonks (2007) compare this with the repayment behavior of mortgage borrowers. Some borrowers are sensitive to changes in the interest rate and refinance their mortgage whenever it is beneficial, while a significant proportion is reluctant to refinance.
39
25
take appropriate actions, rather than the reluctance of fund investors to withdraw money. In addition, the
higher transaction costs associated with forced asset sales is likely to contribute to the weak performance
reversal after outflows. Moreover, this implies that the underperformance of loser funds is explained by
a lack of good ideas, rather than the level of average transaction costs, because the latter should be
reduced after a decrease in fund size.
The effect of manager changes Turning to manager changes, our hypothesis that bottom funds
which sack their fund manager can improve their performance in the following year compared with
bottom funds which stick with their presumably unskilled manager is strongly supported by our findings.
While loser funds without a change of manager continue to significantly underperform by -0.26 percent
per month in the subsequent year, loser funds that replace their manager have insignificant alphas of
-0.18 percent per month (see Figure 4). This leads to a significant spread in alpha of 0.08 percentage
points per month due to the exercise of internal governance and implies that internal governance is
effective among loser funds.40 The spread in raw returns is even larger – a highly significant 0.11
percent. A new manager, therefore, might contribute to stronger mean reversion of fund performance
towards equilibrium levels by selling off loser stocks and realigning the portfolio. This evidence
suggests that manager changes are an important equilibrating mechanism that has both a statistically and
economically significant impact on fund performance.
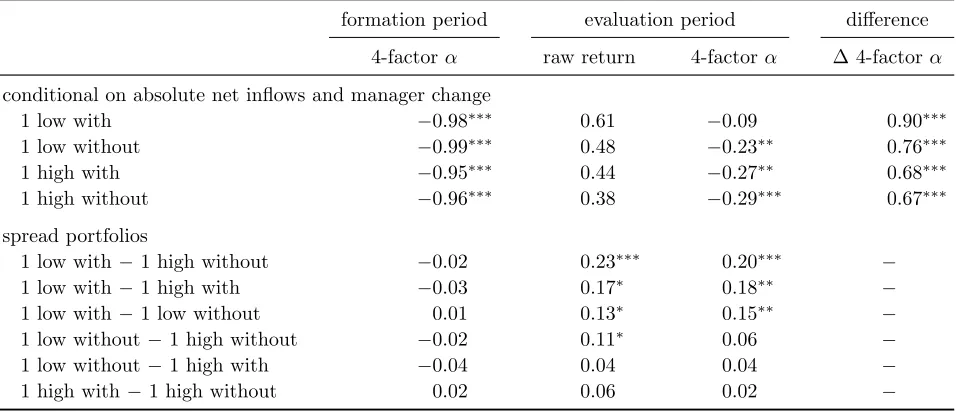
Interaction effects An IMC might fire an underperforming manager to avoid the risk of
investors withdrawing funds. Table 9 investigates the interaction and dependency between the two
equilibrating mechanisms and fund performance. A comparison of the characteristics of the subgroups
reveals that the internal and external governance mechanisms interact positively: funds with outflows
have a higher fraction of manager changes than funds with positive net inflows and funds with a
manager change have larger outflows than funds without (Table 7). If internal and external governance
40
26
were independent of each other, we would expect their combined impact on fund performance to be the
sum of the individual effects. However, funds that benefit from both mechanisms have insignificant
alphas of -0.09 percent per month in the evaluation period. This corresponds to an impressive degree of
mean reversion of 0.90 percentage points per month. Funds without either form of governance
mechanism continue to significantly underperform by -0.29 percent per month, regressing to the mean
by only 0.67 percentage points per month. The spread between both subgroups is a highly significant
0.20 percentage points per month41 which is larger than the sum of the individual effects.42 This implies
that the internal and external governance mechanisms are magnified when they operate jointly in loser
funds, as can be seen from an examination of Figure 4.43
[ Please insert Table 9 about here ]
Turning to marginal effects, within the subgroup of funds with outflows, those with a manager
change have a significant 0.15 percentage points higher average alpha than those without a manager
change, while the difference for the funds without outflows is close to zero. Fund managers who stay on
do not seem to use the outflows to reorganize their portfolio, but merely to scale down existing
investments. Again, an explanation for this behavior could be a disposition effect among loser-fund
managers. Even more interestingly, within the group of loser funds with a manager change, those funds
that experience large absolute outflows have alphas that are significantly higher by 0.18 percentage
points per month than those without outflows. Thus, the poor effectiveness of the fund-flow channel
based on the single sorting is almost entirely explained by the subgroup without a manager change.
41
This is the evaluation-period alpha on the “1 low with – 1 high without” spread portfolio (Table 9).
42
The sum of the individual effects is 0.17 and is given by the sum of the evaluation-period alpha of 0.09 on the “1 low – 1 high” spread portfolio (using absolute net inflows) and the evaluation-period alpha of 0.08 on the “1 with – 1 without” spread portfolio (see Table 8). Figure 4 shows this graphically: 0.20 is the difference between the first and fourth columns in the double-sorting segment of the “alpha” panel; 0.09 is the difference between the two columns in the sorting-by-flows segment of the “alpha” panel; and 0.08 is the absolute sum of the two columns in the single-sorting-by-manager-change segment of the “alpha” panel.
43
27
In summary, we do not find much support for the Berk and Green (2004) hypothesis for loser
funds when considering fund flows as the sole equilibrating mechanism. However, manager changes
both separately and jointly with outflows play an important role in the governance process, leading to a
significant improvement in the performance of loser funds. Applying internal and external governance at
the same time not only brings performance levels back to equilibrium (-0.09) in the evaluation period,
but also explains 27 percent44 of the unconditional mean reversion among loser funds. Manager changes
are a much more effective governance tool than withdrawing money, especially when transactions cost
associated with the latter are taken into account, and, when used in combination, the effects are
magnified.
4.4 Impact of fees
The evidence we have presented above in the case of winner funds is consistent with efforts by
winner-fund managers to maximize their fees by increasing their AUM either at the same winner-fund (i.e.,
higher-than-median inflows) or by moving to another fund (i.e., manager change), as discussed in Section 2. But
winner-fund managers might also strategically adjust fee levels to past performance. By contrast, loser
funds experiencing a high degree of both internal and external governance might charge lower fees to
reflect their lower skills.45 To investigate this, we repeated the above analysis using pre-fee returns.46
However, our conclusions based on either single or double sorting on fund flows and manager changes
do not change in the case of either winner or loser funds.
We conclude that winner-fund managers do not attempt to maximize their fee income by actively
adjusting the fee levels to their expected performance and that the benefits of outflows and manager
44
This is the ratio of the evaluation-period alpha of 0.20 on the “1 low with – 1 high without” spread portfolio (Table 9) to the absolute degree of mean reversion of 0.73 on loser funds between the formation and evaluation periods (Table 2).
45
In addition to fees, cross-sectional differences in trading costs might explain part of the spreads between the different deciles and decile subgroups. However, even though we have information on portfolio turnover, we do not know the differences in the levels of transaction costs and these might be large across funds depending on the investment style, especially with respect to a small cap tilt. Thus, the data does not allow us to control for cross-sectional differences in total trading costs. However, we control for differences in turnover in our regression tests.
46
28
changes among loser funds are not related to differences in fees. This demonstrates that the performance
impact of the equilibrating mechanisms documented in the previous section is robust to potential
differences in fee levels. Furthermore, based on a comparison of gross and net returns and the magnitude
of the performance impact of both equilibrating mechanisms, we conclude that the equilibrating
mechanisms are more relevant in explaining below-average performance than the impact of fees.
4.5 Regression Analysis
Model specification In this section, we examine the output from a pooled regression of the change in
annualized Bayesian four-factor alphas between the formation and evaluation periods on relative net
inflows, manager changes and a set of other control variables documented in the literature as having an
impact on performance.47 We focus on relative flows in this section because they are more comparable
across funds. The aims are threefold: first, by controlling for other determinants of mutual fund
performance, we are able to measure the marginal impact of fund flows and manager changes, as well as
the interaction with other control variables; second, it allows us to analyze the performance impact of
both equilibrating mechanisms over time (i.e., whether they lead to mean reversion), in contrast with the
cross-sectional results in the previous sections using ranked portfolio tests; and third, it serves as a
robustness check.
In our first model, we include the following additional control variables: fund size (total net
assets), fund fees, fund age and the portfolio turnover ratio.48 49 Because there is a strong tendency for
the extremes in fund performance to revert to the mean, we add to our regression two dummy variables
47
Following French (2008), we winsorize all variables at the 1st and 99th percentile to avoid any bias resulting from extreme outliers.
48
The portfolio turnover ratio is defined as the minimum of aggregated sales and aggregated purchases of securities, divided by the average 12-month total net assets of the fund. It measures the fraction of the portfolio traded over the previous 12 months.
49
29
that indicate whether a fund is currently in decile 10 or decile 1 based on previous-year performance.
These dummies capture the pure mean reversion effect and ensure that the other coefficients are not
biased. The key variables of interest are net inflows and the manager change dummy. We also include an
interaction term between fund flows and the decile-10 and decile-1 dummies in order to analyze the
differential effects of fund flows on performance in the top and bottom funds. Similarly, we use a
manager-change dummy indicating whether the fund manager has been replaced during the previous
year and an interaction term between manager change and the decile-10 and decile-1 dummies.
In a second model, we analyze the impact of being a small-cap or a sector fund on performance
and the marginal impact of fund flows on winner and loser funds that belong to these two
investment-style categories. We anticipate that capacity constraints are more prevalent in narrow and illiquid
markets and, as a result, fund flows have a stronger impact on performance in these investment
categories. A third model investigates the interaction effect between a change in the manager of a winner
or loser fund and the fund being a member of a large fund family. Gervais, Lynch and Musto (2005)
argue that the replacement of an underperforming manager in a large fund family reveals more
information than the replacement of a manager in a small fund family. We assign a fund to the
large-family group if the number of funds offered by its fund large-family at the end of the previous year is higher
than the 70th percentile. A fourth model assesses the interaction between the manager-change and
fund-flow mechanisms. Specifically, we include a dummy for winner funds that have higher-than-median net
inflows and a change in manager and a dummy for loser funds that have lower-than-median net inflows
(i.e., high net outflows) and a change in manager.50
Empirical Results As we measure the change in performance between consecutive years, a
significant coefficient on one of the control variables would indicate that there was a trend in
50
30
performance over time. An examination of the first four regressors in Table 10 indicates that, across all
models, only fund size (as measured by total net assets) is statistically significant. The decile-1 and
decile-10 dummies are both highly significant and indicate that loser funds improve their alphas by
between 7.93 and 7.94 percentage points in the following year, depending on the model, while the alphas
of winner funds deteriorate by between 8.21 and 8.31 percentage points in the following year, before
conditioning on any other variable. These findings indicating strong mean reversion are consistent with
the results of the portfolio tests.
[ Please insert Table 10 about here ]
In line with the hypothesis of Berk and Green (2004), we document a significant negative
relationship between relative net inflows and subsequent performance. A one percent increase in relative
net inflows during the previous year decreases four-factor alphas for all funds by 1.06 percentage points
on average in the following year. Model 1 reveals that the decrease becomes 1.48 percentage points for
winner funds which confirms the results of the ranked portfolio test. Controlling for a fund’s market
segment shows that performance decreases by an additional 0.86 percentage points if the winner fund is
a small-cap or sector fund and receives high inflows (Models 2-4). This supports the notion that capacity
constraints are partly driven by transaction costs.
A manager change does not have a significant impact on the average fund, but if the manager of
a winner-decile-10 fund changes, performance subsequently deteriorates by a significant 1.15 to 1.30
percentage points in the following year, according to Models 1-3. The more sophisticated Model 4
shows that the effect operates through fund flows: winner funds that lose their manager, while also
experiencing above-median net inflows, experience an average deterioration in performance of 2.29
percentage points in the following year. If the star manager of a large fund family leaves, the effect is not
31
not even large fund families have access to the fund management skills that would prevent the
deterioration in performance following the loss of a talented manager.
For loser funds, the improvement in alpha following an increase in relative outflows is not
significantly different from the general performance improvement for average-performing funds (Model
1), implying that the performance of loser funds is less sensitive to a change in net flows of the same
magnitude than the performance of winner funds. Further, being a small-cap or sector fund has little
effect on the relationship between outflows and subsequent performance (Model 2). The improvement in
performance following a manager change, although positive, is insignificant for a typical loser fund,
according to Models 1 and 2. However, the more sophisticated Models 3 and 4 reveal that replacing an
underperforming manager in a fund belonging to a large fund family improves performance significantly
by an additional 2.71 to 2.92 percentage points in the following year. This result supports the predictions
of Gervais, Lynch and Musto (2005) that manager replacement in a large family contains more
information, particularly if it is associated with an underperforming manager. Model 4 additionally
shows a strong interaction between the two equilibrating mechanisms: if loser funds sack their manager,
while also experiencing above-median outflows, they experience an aggregate performance
improvement of 3.00 percentage points the following year – although this is attenuated by a deterioration
of 1.80 percentage points as a result of the pure effect of a change in manager in a bottom-performing
fund. This supports the findings from the ranked portfolio tests
Thus, the results in this section strongly confirm the Berk and Green (2004) hypothesis for fund
flows as a predictor of mean reversion in performance over time for winner funds (and, indeed, the
average fund), but not for loser funds. The effect of manager change is driven by the interaction with
high net inflows for winner funds, and by the interactions with outflows and fund family size for loser
funds. These interaction effects suggest that a change in manager has a magnified impact on
performance in combination with fund flows, again reinforcing the evidence from the ranked portfolio
32
performance: it is only in combination with fund flows (and, additionally, in the case of loser funds, with
fund family size) that a change in manager has an impact. By contrast, relative fund flows have an
independent (negative) impact on performance.
5 Conclusions and Implications
We have examined the role of fund flows and manager changes in explaining the lack of persistence in
mutual fund performance. Using a CRSP sample of 3,946 actively managed U.S. equity mutual funds
over the period from 1992 to 2007, we find that around 37 percent of the mean reversion in winner funds
and 27 percent of the mean reversion in loser funds can be explained by these two equilibrating
mechanisms. They are much more important in explaining below-average performance than, say, the
impact of fees.
In the case of winner funds, we provide support for the Berk and Green (2004) hypothesis that
inflows of new money have a large impact on inducing mean reversion, and are more important than
manager changes. Both methods combined can explain a spread in risk-adjusted performance of 0.30
percent per month (3.60 percent per year). On the other hand, the impact of fund flows on performance
is much weaker in the case of loser funds. Manager replacement is a more effective equilibrating
mechanism than fund outflows, especially when transactions costs associated with the latter are taken
into account. Indeed, the weak results for fund flows based on the single sorting of the data are almost
entirely due to the subgroup without a manager change. In contrast, fund flows and manager changes
acting together complement each other in the case of loser funds. When both governance mechanisms
operate jointly, risk-adjusted performance of loser funds improves by 0.20 percent per month (2.40
percent per year) compared to the subgroup of loser funds without any governance. This is greater than
the sum of the individual effects.
What are the potential implications of these findings? First of all, investors should pay close
33
fund managers amongst different funds: our results show that past performance is only an indicator of
future performance if the manager is not replaced and fund flows do not eliminate the persistence. It
would be valuable for investors if IMCs were required to publish information on fund flows on a regular
basis and on manager changes immediately.
Second, IMCs should make their best efforts to retain skilled managers. While this is an obvious
statement to make, it implies that a stronger alignment of performance with remuneration might be
necessary to avoid the high turnover of talented managers. Das and Sundaram (2002) have questioned
the usefulness of US restrictions permitting only fulcrum fees as performance-related fee contracts.
Hedge fund industry practice, which typically combines asymmetric performance fees with personal
stakes by the fund manager, provides valuable lessons for the mutual fund industry. After a fund has
been soft-closed by the IMC after a period of excessive inflows, it might be appropriate to allow the fund
to switch from size-based fees to performance-based fees. Nohel, Wang and Zheng (2010) discuss the
implications of allowing side-by-side management of hedge funds and mutual funds by the same
manager as a way of retaining star fund managers. This privilege is usually only granted to the best
performing managers and any agency conflicts do not seem to reduce mutual fund performance. Still,
any improvement in the rewards to star fund managers will be at the expense of investors, again making
it difficult for investors to benefit from any performance persistence. An important message from our
findings is that star fund managers extract their skill-rents one way or another, even if that means
changing jobs.
Finally, with respect to loser funds, the IMC needs to respond more promptly in the face of poor
performance. Since losing fund managers seem to be incapable of extricating themselves from their
losing positions, the IMC needs to replace them much sooner than hitherto: the fund-flow mechanism is