Submitted27 April 2016
Accepted 14 July 2016
Published18 August 2016
Corresponding author
Stephen A. Karl, [email protected]
Academic editor
James Reimer
Additional Information and Declarations can be found on page 13
DOI10.7717/peerj.2330
Copyright
2016 Cros et al.
Distributed under
Creative Commons CC-BY 4.0
OPEN ACCESS
Population genetic structure between
Yap and Palau for the coral
Acropora
hyacinthus
Annick Cros1
, Robert J. Toonen1
, Sarah W. Davies2,3
and Stephen A. Karl1 1Hawai‘i Institute of Marine Biology, University of Hawai‘i, M¯anoa, K¯ane‘ohe, HI, United States 2Department of Integrative Biology, University of Texas, Austin, TX, United States
3Department of Marine Science, University of North Carolina, Chapel Hill, NC, United States
ABSTRACT
Information on connectivity is becoming increasingly in demand as marine protected areas are being designed as an integral part of a network to protect marine resources at the ecosystem level. Larval dispersal and population structure, however, remain very difficult to assess. Here, we tested the predictions of a detailed oceanographic connectivity model of larval dispersal and coral recruitment within Palau and between Palau and Yap, which was developed to support the review of the existing network of marine protected areas in Palau. We used high throughput microsatellite genotyping of the coralAcropora hyacinthusto characterize population genetic structure. Pairwise F0ST values between Palau and Yap (0.10), Palau and Ngulu (0.09) and Yap and Ngulu
(0.09) were all significant and similar to pairwiseF0ST values of sites within Palau (0.02–
0.12) and within Yap (0.02–0.09) highlighting structure at island scale and indicating that recruitment may be even more localized than previously anticipated. A bottleneck test did not reveal any signs of a founder effect between Yap and Palau. Overall, the data supports the idea that recovery ofA. hyacinthusin Palau did not come exclusively from a single source but most likely came from a combination of areas, including sites within Palau. In light of these results there seems to be very little connectivity around the barrier reef and management recommendation would be to increase the number or the size of MPAs within Palau.
SubjectsGenetics, Marine Biology
Keywords Genetic connectivity, Gene flow, Coral colonization, Reef conservation
INTRODUCTION
of ecosystem processes, MPA networks build resilience by spreading risk in the case of localized disasters, climate change, failures in management or other hazards, and overall, help protect biodiversity and fisheries resources (IUCN, 2008;Walton et al., 2014). These networks also allow for building upon existing MPAs by maintaining structures that are already in place and enhancing resilience to these areas (McLeod et al., 2009).
As a member of the Micronesia Challenge, Palau is one of the nations to have adopted resilient MPA networks as part of their strategy to effectively conserve at least 30% of the near-shore marine resources across Micronesia. Palau is an archipelago that suffered heavy bleaching mortality during the 1998 El Niño bleaching event and in response to that mortality, established a network of marine protected areas to encourage reef recovery. The initial MPAs, however, were not designed with the specific purpose of maintaining connectivity between reefs and there has been a national effort to review the design of their MPA network to provide regional resilience to both local and global scale stressors (Golbuu et al., 2005).
In practice, implementing MPA networks that are interconnected and thus resilient faces the challenge of understanding connectivity of marine communities. Many marine organisms reproduce via minute pelagic larvae that are difficult to track and the barriers and drivers influencing their dispersal are not always obvious, making information on connectivity difficult to determine (reviewed in Levin, 2006;Cowen & Sponaugle, 2009). To address such issues, researchers have taken two main approaches: first, developing oceanographic models of the dispersal of particles forced with physical data (e.g., wind and tides) or second, indirect/direct tagging via molecular (i.e., DNA) or chemical markers (i.e., otolith/statolith chemistry) to study gene flow between populations (Hellberg, 2007;
Cowen & Sponaugle, 2009).
In the most detailed oceanographic connectivity model for Palau to date,Golbuu et al. (2012)incorporated reef architecture at 500 m scales with over 30 years of oceanographic data to predict larval dispersal and coral recruitment both within Palau and between Palau and Yap, a neighboring Micronesian archipelago 452 km from Palau. They concluded that Palau recovered quickly after the mass 1998 bleaching mortality due to a pulse event of larval dispersal from Yap in 1999. The model also predicted considerable local retention at all sites in the Palau archipelago on a short time scale (<3 days), which changed at longer time scale (>3 days) with the northern lagoon showing the most flushing. The model also indicated a directional dispersal from densely populated areas (i.e., the southern lagoon) to less densely populated areas (i.e., the northern lagoon). Based on the results of their dispersal modeling,Golbuu et al. (2012)recommend building a network of MPAs at a regional and national scale that would link Yap and Palau, and Palau’s northern and southern reefs.
Figure 1 Example of a colony ofAcropora hyacinthuscollected in Palau.
throughput microsatellite genotyping of the coralAcropora hyacinthusto characterize population genetic structure between Yap and Palau to test the predictions made by the dispersal modeling ofGolbuu et al. (2012).
METHODS
Study species
Acropora hyacinthuswas an abundant tabular coral found on the reef slopes of Palau prior to the 1998 bleaching event. During their 2001 assessment,Bruno et al. (2001)estimated a near complete loss of this coral in the areas they sampled. By 2005,Golbuu et al. (2007)
observed that the same species was dominant in the shallow reef slopes, raising the question of where the larvae originated from to allow for such a successful recovery and thereby makingA. hyacinthusand ideal candidate to study coral connectivity.
A. hyacinthusis usually found between 3 and 10 m deep on barrier reefs and is readily identifiable by the rosette formation of its calices (Fig. 1).A. hyacinthusis a hermaphrodite broadcast spawning coral that produces feeding larvae (Toh, Peh & Chou, 2013) with a pelagic larval duration of approximately 90 days under laboratory conditions (Márquez et al., 2002). Little is known, however, about the pelagic duration or swimming behavior of larvae in the field, which makes realistic incorporation of biological parameters into oceano-graphic models difficult (Paris, Chérubin & Cowen, 2007;Woodson & McManus, 2007).
Sampling locations and methodology
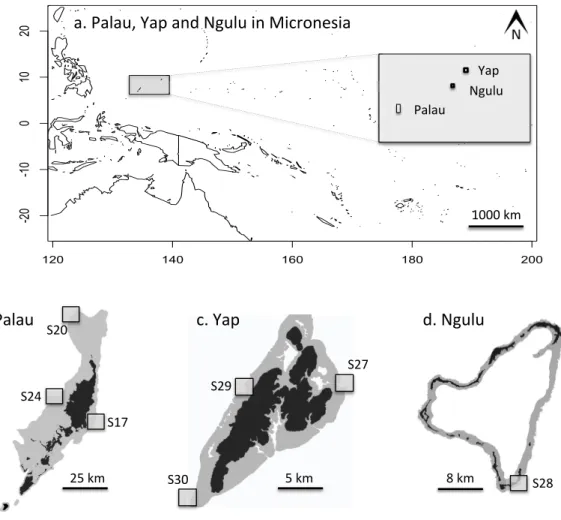
In May 2012, three sites on the outer barrier reef of Palau were sampled at a shallow depth (<10 m) using SCUBA (Figs. 2Aand2B). Sites were selected to represent a range of habitats, exposures and management categories found on the barrier reef: S17 ‘‘West Palau’’ within a fully protected no-take area on the west side, S20 ‘‘North Palau’’ at the tip of the northern lagoon in a less strictly protected area and S24 ‘‘East Palau’’ on the east coast in a reef impacted by anthropogenic stressors (Golbuu et al., 2012). At each of these three sites, 48 colonies ofA. hyacinthuswere collected haphazardly in a 4×200 m
Figure 2 Maps of sampling locations: (A) overview of location of Yap, Ngulu and Palau in Micronesia; (B) sample sites in Palau; (C) sample sites in Yap; (D) sample sites in Ngulu.
cut and preserved in salt-saturated DMSO at room temperature (Gaither et al., 2010). In addition, a total of 132 samples were collected from three different sites around Yap, and another 46 colonies were sampled from a single site at Ngulu as described inDavies et al.
(2015,Table 1,Figs. 2A,2Cand2D). Importation was permitted by the Convention on International Trade in Endangered Species of Wild Fauna and Flora permit #FW 12-091.
DNA extraction and sequencing
For colonies from Palau, Genomic DNA was isolated following the DNeasy 96 Blood & Tissue Kit (Qiagen, Valencia, CA, USA) protocol. Two sites with 48 colonies each were extracted on a 96 well plate. For each colony, a 2 mm3piece of coral from the tips of one branch was ground and incubated overnight at 55◦C in 180µl of Qiagen Lysis buffer and 20µl of Qiagen Proteinase K (600 mAU/ml). DNA was eluted in 200µl of PCR grade water, with 100µl frozen until amplified and 100µl saved for future use at−20◦C. A
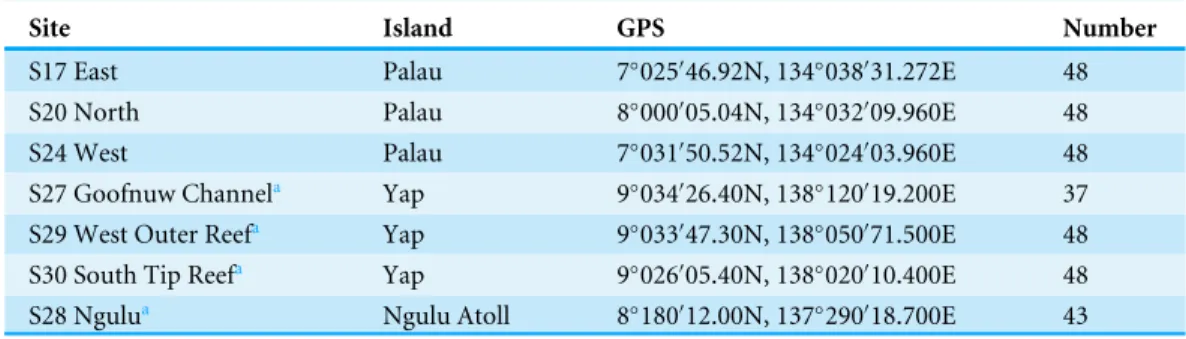
Table 1 GPS coordinates, main island group and number of samples genotyped for each site.
Site Island GPS Number
S17 East Palau 7◦025046.92N, 134◦038031.272E 48
S20 North Palau 8◦
0000
05.04N, 134◦
0320
09.960E 48
S24 West Palau 7◦
0310
50.52N, 134◦
0240
03.960E 48 S27 Goofnuw Channela Yap 9◦034026.40N, 138◦120019.200E 37
S29 West Outer Reefa Yap 9◦
0330
47.30N, 138◦
0500
71.500E 48 S30 South Tip Reefa Yap 9◦
0260
05.40N, 138◦
0200
10.400E 48 S28 Ngulua Ngulu Atoll 8◦180012.00N, 137◦290018.700E 43
Notes.
aSamples previously collected byDavies et al. (2015).
ranging from 5 to 10 ng/µl. The DNA of colonies originating from Yap and Ngulu were isolated according toDavies et al. (2015).
Eighteen microsatellite loci developed byWang, Zhang & Matz (2009)were selected for this study (Table S1). We designed short tags according toFaircloth & Glenn (2012)to create 48 unique colony IDs on the forward primer for each microsatellite locus (Table S2). Polymerase chain reactions (PCRs) for each colony were performed in a 25µl reaction volume containing 12.5 µl of MyTaqTMRed Mix (Bioline, Taunton, MA, USA), 1µl of each forward and reverse primer at 5µM, 1µL of genomic DNA (5–10 ng/µl) and 9.5µl of water. Thermal cycling followed a touch-down protocol with an initial denaturation at 95◦C for 3 min followed by 20 cycles of 95◦C for 15 s, 63–55◦C for 15 s (annealing temperature reduced 0.4◦C each cycle), 72◦C for 30 s followed by 20 cycles of 95◦C for 15 s, 55◦C for 15 s, 72◦C for 30 s with a final elongation at 72◦C for 3 min.
Twoµl of each uniquely barcoded amplicon were pooled by site for subsequent library construction and sequencing. The pooled samples were concentrated by reducing the total volume using Amicon Ultra 0.5 mL centrifugal filters (EMD Millipore, Darmstadt, Germany) and cleaned using Agentcourt Ampure XP (Beckman Coulter Inc., Brea, CA, USA) to eliminate traces of dye and unincorporated dNTPs and primers. Genomic libraries were generated using the KAPA Hyper Prep kit (Kapa Biosystems, Wilmington, MA, USA). A unique Illumina adaptor (Illumina Inc., Hayward, CA, USA) was ligated to each pool of individually barcoded amplicon samples, creating a site-specific tag (ID) and generating the following unique structure: siteID-colonyID-FWDprimer-flankingregion-tandemrepeats-flankingregion-RVSprimer. Libraries were sequenced on an Illumina MiSeq at the Hawai‘i Institute of Marine Biology (HIMB) Evolutionary Genetic core facility.
Bioinformatics (Table S3)
Low quality trimming
Illumina adaptors and barcodes were removed and sequences were demultiplexed by site through the Illumina MiSeq Reporter (MSR) software (Illumina, Inc). Forward and reverse sequences were merged usingpear(Paired-End reAd mergeR) (Zhang et al., 2014). Sequences were then further demultiplexed according to primer and colony barcodes using
groomer/). Low quality sequences and reverse primers were trimmed usingtrimmomatic (Bolger, Lohse & Usadel, 2014). Cleaning resulted in sequences consisting of flanking region, tandem repeats and flanking region. Identical sequences were then collapsed into unique sequences and counted (=depth; the number of times a given sequence was repeated in
the library).
Filtering
A set of filters developed in python (
https://github.com/annickcros/Ahyacinthus-filters.git) was then applied to the sequences to eliminate PCR and sequencing artifacts. A length filter was applied to eliminate sequences that were less than 15 base pairs and sequences that were greater than 190 base pairs. This maximum length was determined by adding 4 additional repeats to the longest microsatellite sequence in the data set (Table S1). The file with the rejected sequences was checked by eye. None of the sequence rejected were true microsatellites. Two depth filters were applied to the sequences of the entire dataset, which were pooled by locus. The first eliminated any sequences with fewer than 10 reads the second eliminated any sequence that was present in less than two individual colonies regardless of sequencing depth (see below).
Scoring
To score microsatellite alleles, for each colony at each locus, the sequence with the highest depth was initially selected. Any sequence that had a depth greater than half of the depth of the most frequent sequence was also selected. This approach resulted in colonies with one (homozygote), two (heterozygote), or in some cases, more than two alleles per locus (see below).
More than 2 alleles
After filters and scoring, there were still a large number of colonies that had more than two apparent alleles among the sequence reads (i.e., multiple sequences were represented at least half as often as the most common allele in the amplicon library). These alleles typically varied either by a single nucleotide difference or by an indel in the repeat region, and could have derived from somatic mutations, individual chimerism, PCR or sequencing errors, or some combination of these factors.
For colonies in which more than two alleles passed the initial filters, we selected the two alleles used for analysis in two different ways. In both cases, we first selected the sequence with the highest depth as the first allele. The second allele was then selected either by: (1) the allele with the next highest sequencing depth (selection by depth), or (2) at random from all the available alternative choices (random selection). In a few cases of selection by depth, there were multiple alternative alleles that were equally frequent, therefore the second allele was selected at random from among the tied second-highest depth reads. Random selection with replacement of the second allele was repeated 10 times to generate 10 independent files.
Splitting flanking region sequences and simple tandem repeats
We separated simple tandem repeats (STR) from their flanking regions usingemboss:
Table 2 Alleles and allelic richness per locus and per site.Number of alleles (in white) per locus and per site. Allelic richness (in grey) based on 24 colonies per locus and per site.
Site 17 Site 20 Site 24 Site 27 Site 28 Site 29 Site 30 Total
loc1 2 2.00 2 2.00 2 2.00 2 2.00 2 2.00 2 1.99 2 2.00 2 2.00
loc3 5 3.94 5 4.74 6 5.50 5 4.99 6 5.52 6 5.49 6 5.46 7 5.27
loc4 15 12.75 18 15.49 13 11.51 13 12.51 16 13.71 13 10.97 16 13.99 21 14.88
loc5 8 6.77 6 5.46 6 4.53 4 3.88 7 5.38 6 4.50 4 4.00 10 5.09
loc6 2 2.00 3 2.97 4 3.98 4 3.98 4 3.04 3 2.56 4 3.49 4 3.46
loc8 10 8.37 11 9.55 13 12.14 9 8.51 13 11.22 11 10.30 13 11.36 15 10.99
loc11 7 6.02 5 4.96 7 6.48 7 6.55 5 4.78 6 5.91 7 6.72 8 6.65
loc12 13 10.27 17 13.83 12 10.94 13 11.77 12 10.93 11 9.35 14 11.51 20 11.69
loc13 5 4.25 5 4.75 6 5.36 7 6.59 4 3.52 5 4.75 6 5.79 7 5.41
loc14 8 6.25a 7 6.20 11 9.39 6 5.48 8 7.26 10 8.40 5 4.54 13 7.69
loc16 1 1.00 2 1.98 6 4.92 5 4.78 2 2.00 5 4.38 6 4.99 7 4.15
Analysis genodivefiles
Datasets were converted togenodivev. 2.0b27 (Meirmans, 2009) file format. Individual genotypes were created using two different methods. First, we used sequence length similar to peak calling in a microsatellite fragment analysis, such that all sequences of the same length, regardless of underlying sequence variation, would be scored as the same allele (se-quence length). Second, we identified alleles by their se(se-quence (ID) so that only two exactly identical alleles had the same ID, whereas alleles with the same length but differing in nucleotide composition would have different IDs (unique ID).
Only loci with less than 15% missing data and colonies with less than 35% missing data were used for the analysis. The final dataset analysis was carried out on 11 loci (Table S3). The final number of colonies for each locus for each site varies between 37 and 48. The number of allels and allelic richness is reported inTable 2.
Comparison of datasets
To compare the different datasets created by alternate strategies of filtering and scoring, we looked for bias in population differentiation using AMOVA ingenodiveto calculateFST,
F0STandFISand corresponding significance values among and within populations. Indices
of genetic diversity, including observed heterozygosity (HO), expected heterozygosity
within populations (HE), corrected total heterozygosity (H0T) and Nei’s corrected fixation
index G0ST, were used to quantify the population diversity (Table 2) and check for any
potential bias between datasets created using different strategies.
Population differentiation
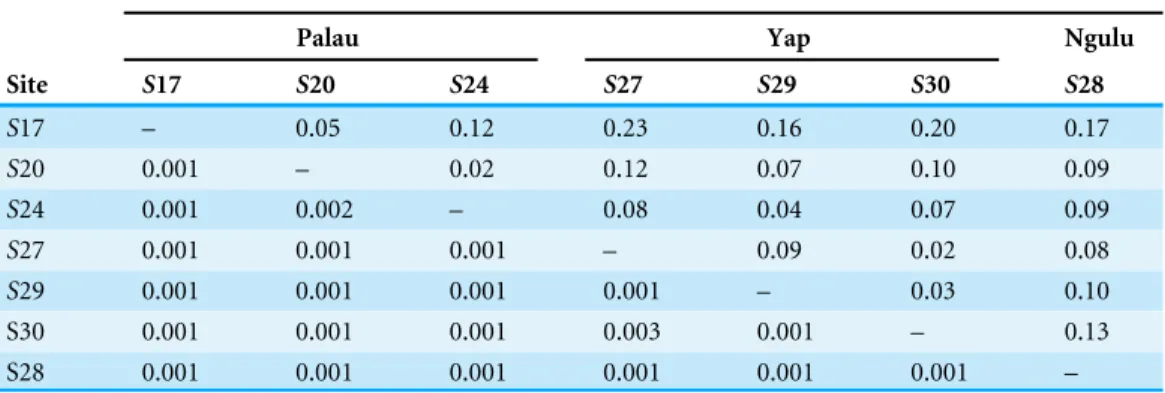
Table 3 F0
ST(above the diagonal) and significance values (below) of exact test of population
differen-tiation (100,000 steps).
Island
Palau Yap Ngulu
Site S17 S20 S24 S27 S29 S30 S28
S17 – 0.05 0.12 0.23 0.16 0.20 0.17
S20 0.001 – 0.02 0.12 0.07 0.10 0.09
S24 0.001 0.002 – 0.08 0.04 0.07 0.09
S27 0.001 0.001 0.001 – 0.09 0.02 0.08
S29 0.001 0.001 0.001 0.001 – 0.03 0.10
S30 0.001 0.001 0.001 0.003 0.001 – 0.13
S28 0.001 0.001 0.001 0.001 0.001 0.001 –
Bottleneck
To test the hypothesis that A. hyacinthuson Palau has recovered from a pulse event of larval dispersal following the 1998 bleaching mortality, we looked for evidence of a recent bottleneck or founder effect usingbottleneck1.2.02 (Piry, Luikart & Cornuet, 1999). In populations that have experienced such an event, rare alleles are the first to be lost, lowering the mean number of alleles per locus. Heterozygosity is less affected, however, producing a transient excess in heterozygosity relative to that expected given the resulting number of alleles (Cornuet & Luikart, 1996). We used the graphical test fromLuikart et al. (1998)based on a mode shift away from an L-shaped distribution of allelic frequencies to assess whether evidence of recent population bottlenecks could be detected, which is most appropriate for these types of data (Chaïr et al., 2011). Because we scored fewer than 20 microsatellite loci, we used the Wilcoxon signed-rank test (10,000 iterations) using both a two-phase (TPM incorporated 70% stepwise and 30% multistep mutations) and an infinite allele (IAM) mutational model.
Population structure
A Principal Component Analysis (PCA) was performed ingenodivev. 2.0b27 (Meirmans,
2009), both on individuals and on sites using a covariance matrix with 10,000 permutations. The graphs were plotted in Excel (Microsoft, Redmond, Washington, 2010,Figs. 3and4).
RESULTS
Comparison of datasets
We detected no evidence that alternate strategies of filtering and scoring showed bias in our inference of population differentiation (Table 4). The overallFST andF0ST values as well as
the indices of diversity were almost identical for the 10 datasets generated. Genotypes with alleles identified by sequence length gave slightly lowerF0ST and heterozygosity because
length masks some of the underlying sequence variation relative to unique IDs, reducing the mean within population heterozygosity and F0ST (Hedrick, 2005;Jakobsson, Edge &
Figure 3 Principal component analysis on individuals for all sites.Results were color coded to show the island at which individuals were found. PCA axis 1 explains 7.2% of the variation and axis 2 explains an additional 5.7%.
conservative approach, we selected the first dataset generated by randomly selecting the second allele when there were more than two choices (random000_len). In each case, however, the differentiation among sites was significant (p<0.001), and there are no cases in which inferences would differ because of this variation in magnitude. Because the different strategies for filtering reads produce qualitatively similar results in all cases we believe that the approach of selecting the second allele does not bias our interpretations.
Population differentiation
Population differentiation was significant among all sites, with a globalF0ST=0.11. The
pairwise differentiation test between islands show thatF0ST values between Yap and Ngulu
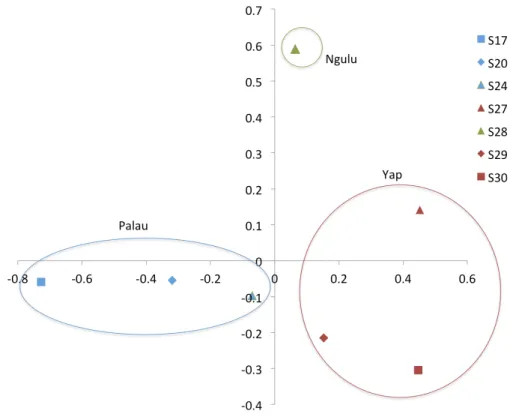
Figure 4 Principal component analysis on sites (populations).The first axis explains 38% of variation and second axis explains 24% of variation.
Table 4 Comparison of the different datasets created by alternate strategies of filtering and scoring using AMOVA and indices of genetic
di-versity including number of individuals (N), effective number of individuals (NE) expected (HE) and observed (HO) heterozygosities, corrected
total heterozygosity (H0
T) globalFSTandF0STvalues, significance levels (p), and Nei’s corrected fixation indexG0STand significance level (p).
Random_000 was generated by randomly selecting the second allele when there were more than two choices; topdepth was generated by selecting the two alleles with the highest number of representation among all colonies, random_min 10 was generated by randomly selecting the second allele of the dataset retaining only alleles that were present in more than 10 colonies, depth_min 10 was generated selecting the two alleles with the highest number of representation among all colonies on the dataset retaining only alleles that were present in more than 10 colonies. Two sets of files were generated: alleles were given a unique identification (_ID) or were identified by their length (_len).
N NE HE HO H0
T FST F0ST p FIS p G0ST p
N=321,Loci=11
random000_ID 27.55 4.95 0.70 0.46 0.73 0.04 0.13 0.001 0.31 0.00 0.04 0.001 topdepth_ID 23.73 4.28 0.67 0.47 0.71 0.05 0.16 0.001 0.25 0.00 0.06 0.001
N=318,Loci=10
random_min10_ID 12.80 4.20 0.66 0.44 0.70 0.04 0.13 0.001 0.30 0.00 0.05 0.001 depth_min10_ID 12.20 3.62 0.64 0.45 0.68 0.06 0.16 0.001 0.26 0.00 0.06 0.001
N=321,Loci=11
random000_len 10.40 3.69 0.64 0.43 0.67 0.04 0.11 0.001 0.32 0.00 0.05 0.001 topdepth_len 9.90 3.28 0.62 0.44 0.65 0.06 0.14 0.001 0.27 0.00 0.06 0.001
N=318,Loci=10
Bottleneck
The graphical test for bottlenecks, which does not require data to be in Hardy–Weinberg equilibrium, is robust to a small number of loci (fewer than 20) and detects bottlenecks that occurred within a few dozen generations (Luikart et al., 1998). All of the sites had normal L-shaped distributions and the test showed no evidence of bottlenecks for the sites around Palau.
Population structure
Principal component analysis
All samples are distributed more or less evenly along the first and second axis with a slight partition along the first axis such that Palau and Yap sites each cluster together (Fig. 3). Very little of the overall variation is explained, with the first axis explaining only 7.2% and the second axis explaining an additional 5.7% of the variation.
When individuals are grouped by sampling location, sites partition along the first and second axis of the PCA into three quadrants, with Ngulu site S28 standing alone, Palau sites S17, S20 and S24 in the left quadrant and Yap sites S27, S29 and S30 in the right quadrant (Fig. 4). This PCA accounts for 43% of variation along the first axis and the second axis explains an additional 21% of variation.
DISCUSSION
Connectivity features as a key component of the design of networks of MPAs to increase re-silience of both habitats and resources. Larval dispersal and population structure, however, are difficult to measure in the marine environment and different approaches may convey different results to managers. Here, we tested the predictions made by the oceanographic model developed byGolbuu et al. (2012)using high throughput microsatellite genotyping of the coralA. hyacinthusand found no evidence that Yap was a significant source of larvae for the recolonization ofA. hyacinthusafter the 1998 bleaching event.
Microsatellite sequencing
Genotyping microsatellite loci using high throughput sequencing has become cheaper and faster than traditional fluorescent fragment length analysis. To our knowledge, however, there have been very few published papers using this technique (Roberts, Schwartz & Karl, 2004) and no standardized protocol has yet been developed to obtain the best results. The main challenge with sequenced microsatellites is to define a genotype for each colony. There were cases where regardless of the objective filtering criteria applied, more than two alleles were possible, yet corals are diploid organisms. To ensure that our results were robust to decisions about how to select among alternate possible alleles, we tested different methods of allele selection, including selecting two alleles at random from among all sequence variants within an individual. We find that the data are robust to filtering and allele selection criteria, because although the exact values differed, with consistently lower values for selection by depth, none of the indices of heterozygosity,HO,HE,G0ST, or
genetic structure, includingFST,F0ST andFIS, fundamentally changed by using different
structure and diversity is driven by the most common alleles in the population (Selkoe & Toonen, 2006;Toonen & Grosberg, 2011). This is consistent with our data because neither of the selection criteria impacted the most common alleles in the populations. This robust finding indicates that scoring microsatellites using high throughput technology can give consistent and reliable results that, being based on the underlying sequence rather than length polymorphisms, can allow comparisons of the repeat motif itself and variable flanking regions and be combined reliably among labs and studies. The selection of alleles among several possibilities, however, may prove problematic for applications such as parentage analysis where the genetic pool for parentage assignment will be affected and could lead to false parentage exclusion.
Connectivity between Palau, Yap and Ngulu
Golbuu et al. (2012)show oceanographic connectivity between Palau and Yap, and argue that the reefs of Palau recovered surprisingly quickly from the mass mortality following the 1998 bleaching event due to a pulse of coral larvae from Yap (including the atoll of Ngulu) in 1999.Bruno et al. (2001)describe populations ofA. hyacinthusin Palau as having suffered virtually 100% mortality in areas that were surveyed. Given the generation time ofA. hyacinthus(Wallace, 1985), we would expect roughly three generations in the 14 years between this mortality and our sampling in 2012. If Palau had recovered from a pulse recruitment from Yap after such a widespread and dramatic loss, we would expect evidence of a bottleneck in the recovering population, and should be able to observe a significant founder effect such that Palau would contain a strict subset of the total diversity of Yap and Ngulu from which it was recolonized. Instead, we did not observe signs of a bottleneck, contradicting the hypothesis that A. hyacinthuson Palau recovered from a pulse recruitment of larvae from a single source. These data, however, do not exclude the possibility that Palau received a larval pulse from Yap and/or Ngulu, or from more distant populations such as Phoenix Island as demonstrated by Davies et al. (2015), which then mixed with larvae from surviving local populations.
The pairwise comparisons between islands and among sites show similarF0ST values,
highlighting the fact that there is as much differentiation among sites within a single island as among sites on different islands. Although all pairwiseF0ST values are significant
(p<0.01) and there is clear population structure among all sites sampled in this study, it is important to note thatF0ST values are small enough to reflect some degree of gene flow
Structure of sites within Palau
Sites within Palau separated by as little as 5 km show as much population genetic differentiation as sites between islands separated by as much as 452 km. Both the pairwise and PCA analyses show that Palau’s site S24 (West Palau) is as close to Yap sites S27, S29 and S30 or Ngulu site S28 as it is to Palau site S17 (East Palau). It is interesting to also note that site S17 shows the most differences with other Palau sites S20 and S24 and even greater differences with Yap and Ngulu sites. The eastern lagoon and reef of Palau has historically been impacted by development such as the construction of the airports and roads (Maragos & Cook, 1995) and has been described as being impacted from sediment run-off (Golbuu, 2011; Golbuu et al., 2012). These anthropogenic impacts may have triggered similar population changes to those observed in terrestrial habitats when there is habitat degradation and fragmentation in terrestrial habitats which lead to an erosion of genetic variation and increased genetic divergence between populations due to increased random genetic drift, elevated inbreeding, and reduced gene flow (Young, Boyle & Brown, 1996).
Implications for conservation
We show that populations ofA. hyacinthuson Palau did not recover from a single pulse recruitment of larvae, and that mortality was likely less widespread than originally thought, with at least some pockets of surviving colonies within the Palauan archipelago that pre-served unique genetic diversity there. Furthermore, there are significant differences among sites around Palau indicating that if there is exchange, it is insufficient to homogenize the populations, supporting the larval dispersal simulations ofGolbuu et al. (2012)that there is a high level of self-recruitment among sites. In terms of conservation, these data support increasing the area of conservation by either increasing the number of MPAs or increasing the size of existing MPAs around Palau to protect a wide array of the genetic diversity.
ACKNOWLEDGEMENTS
We are grateful to M Belcaid and Y Cros for assistance with raw data processing and to the following University of Hawaii undergraduates for help in the lab: I Buffenstein, G Ciszek, B Haun, K Kaneshiro, M Keliipuleole, H Lim, K Niimoto, A Sifrit and T Whitman. We also thank M Iacchei for help with the analysis and manuscript. Special thanks to The Nature Conservancy and Palau International Coral Reef Center for enabling the fieldwork and shipping permits. We also thank the HIMB NSF-EPSCoR Core Genetics Lab Facility (NSF, EPS-0903833). This is the Hawai‘i Institute of Marine Biology contribution # 1664 and The School for Ocean and Earth Science and Technology contribution # 9697.
ADDITIONAL INFORMATION AND DECLARATIONS
Funding
OCE 12-60169 to RJT. The funders had no role in study design, data collection and analysis, decision to publish, or preparation of the manuscript.
Grant Disclosures
The following grant information was disclosed by the authors: Disney Wildlife Conservation Fund.
Graduate Women in Science Adel Lewis Grant Fellowship. Founder Region Fellowship.
Ecology Evolution Conservation Biology Watson T. Yoshimoto grant. Colonel Willys E. Lord Scholarship Award.
National Science Foundation grant: OCE 12-60169.
Competing Interests
Rob Toonen is an Academic Editor for PeerJ.
Author Contributions
• Annick Cros conceived and designed the experiments, performed the experiments,
analyzed the data, contributed reagents/materials/analysis tools, wrote the paper, prepared figures and/or tables, reviewed drafts of the paper.
• Robert J. Toonen analyzed the data, contributed reagents/materials/analysis tools, wrote
the paper, reviewed drafts of the paper.
• Sarah W. Davies reviewed drafts of the paper, samples.
• Stephen A. Karl conceived and designed the experiments, analyzed the data, contributed
reagents/materials/analysis tools, wrote the paper, prepared figures and/or tables, reviewed drafts of the paper.
Field Study Permissions
The following information was supplied relating to field study approvals (i.e., approving body and any reference numbers):
Importation was permitted by Convention on International Trade in Endangered Species of Wild Fauna and Flora #FW 12-091.
DNA Deposition
The following information was supplied regarding the deposition of DNA sequences: Sequences are provided inTable S1.
Data Availability
The following information was supplied regarding data availability:
DNA sequence data is deposited at the National Center for Biotechnology Information Sequence Read Archive accession numberSRP076262.
Individual genotype information is available at Dryadhttp://dx.doi.org/10.5061/dryad. m4q9f.
Supplemental Information
REFERENCES
Bolger AM, Lohse M, Usadel B. 2014.Trimmomatic: a flexible trimmer for Illumina
sequence data.Bioinformatics30:2114–2120DOI 10.1093/bioinformatics/btu170.
Bruno J, Siddon C, Witman J, Colin P, Toscano M. 2001.El Niño related coral bleaching
in Palau, Western Caroline Islands.Coral Reefs20:127–136
DOI 10.1007/s003380100151.
Chaïr H, Duroy PO, Cubry P, Sinsin B, Pham JL. 2011.Impact of past climatic and
recent anthropogenic factors on wild yam genetic diversity.Molecular Ecology
20:1612–1623DOI 10.1111/j.1365-294X.2011.05041.x.
Cornuet JM, Luikart G. 1996.Description and power analysis of two tests for detecting
recent population bottlenecks from allele frequency data.Genetics144:2001–2014.
Cowen RK, Sponaugle S. 2009.Larval dispersal and marine population connectivity.
Annual Review of Marine Science1:443–466
DOI 10.1146/annurev.marine.010908.163757.
Davies SW, Treml EA, Kenkel CD, Matz MV. 2015.Exploring the role of Micronesian
islands in the maintenance of coral genetic diversity in the Pacific Ocean.Molecular Ecology 24:70–82DOI 10.1111/mec.13005.
Faircloth BC, Glenn TC. 2012.Not all sequence tags are created equal: designing and
validating sequence identification tags robust to indels.PLoS ONE7x
DOI 10.1371/journal.pone.0042543.
Gaither MR, Toonen RJ, Robertson DR, Planes S, Bowen BW. 2010.Genetic evaluation
of marine biogeographical barriers: perspectives from two widespread Indo– Pacific snappers (Lutjanus kasmira and Lutjanus fulvus).Journal of Biogeography
37:133–147DOI 10.1111/j.1365-2699.2009.02188.x.
Golbuu Y. 2011.Responses of Palau’s coral reefs to disturbances at multiple scales. PhD
thesis, Southern Cross University, Lismore, NSW.
Golbuu Y, Bauman A, Kuartei J, Victor S. 2005.The state of coral reef ecosystems
of Palau.The State of Coral Reef Ecosystems of the United States and Pacific Freely Associated States2005:488–507DOI 10.4135/9781452274447.n337.
Golbuu Y, Victor S, Penland L, Idip D, Emaurois C, Okaji K, Yukihira H, Iwase A, Van
Woesik R. 2007.Palau’s coral reefs show differential habitat recovery following the
1998-bleaching event.Coral Reefs26:319–332DOI 10.1007/s00338-007-0200-7.
Golbuu Y, Wolanski E, Idechong JW, Victor S, Isechal AL, Oldiais NW, Idip D,
Rich-mond RH, Van Woesik R. 2012.Predicting coral recruitment in Palau’s complex
reef archipelago.PLoS ONE7:1–10DOI 10.1371/journal.pone.0050998.
Hedrick PW. 2005.A standardized genetic differentiation measure.Evolution
59:1633–1638DOI 10.1111/j.0014-3820.2005.tb01814.x.
Hellberg ME. 2007.Footprints on water: the genetic wake of dispersal among reefs.Coral
Reefs26:463–473DOI 10.1007/s00338-007-0205-2.
IUCN. 2008.Establishing resilient marine protected area networks—making it happen.
Jakobsson M, Edge MD, Rosenberg NA. 2013.The relationship between FST and the frequency of the most frequent allele.Genetics193:515–528
DOI 10.1534/genetics.112.144758.
Johnson DE, Martinez C, Vestergaard O, Duval-Diop D, Romani M, Mcconnell MC,
Beatty C, Jumeau R, Brown K. 2014.Building the regional perspective: platforms
for success.Aquatic Conservation: Marine and Freshwater Ecosystems24:75–93
DOI 10.1002/aqc.2515.
Levin LA. 2006.Recent progress in understanding larval dispersal: new directions and
digressions.Integrative and Comparative Biology46:282–297 DOI 10.1093/icb/icj024.
Luikart G, Allendorf FW, Cornuet JM, Sherwin WB. 1998.Distortion of allele frequency
distributions provides a test for recent population bottlenecks.Journal of Heredity
89:238–247DOI 10.1093/jhered/89.3.238.
Maragos JE, Cook CW. 1995.The 1991–1992 rapid ecological assessment of Palau’s coral
reefs.Coral Reefs14:237–252 DOI 10.1007/BF00334348.
Márquez LM, Van Oppen MJH, Willis BL, Miller DJ. 2002.Sympatric populations of the
highly cross-fertile coral speciesAcropora hyacinthusandAcropora cythereaare ge-netically distinct.Proceedings of the Royal Society: Biological Sciences269:1289–1294
DOI 10.1098/rspb.2002.2014.
McLeod E, Salm R, Green A, Almany J. 2009.Designing marine protected area networks
to address the impacts of climate change.Frontiers in Ecology and the Environment
7:1–10DOI 10.1890/070211.
Meirmans PG. 2009.GenoDive version 2.b14. C software distributed by the author.
Available athttp:// www.bentleydrummer.nl/ software/ software/ GenoDive.html.
Paris CB, Chérubin LM, Cowen RK. 2007.Surfing, spinning, or diving from reef to
reef: effects on population connectivity.Marine Ecology Progress Series347:285–300
DOI 10.3354/meps06985.
Piry S, Luikart G, Cornuet JM. 1999.BOTTLENECK: a computer program for detecting
recent reductions in the effective population size using allele frequency data.Journal of Heredity90:502–503DOI 10.1093/jhered/90.4.502.
Raymond M, Rousset F. 1995.GENEPOP (Version 1.2): population genetics software for
exact tests and ecumenicism.Journal of Heredity86:248–249.
Rice P, Longden I, Bleasby A. 2000.EMBOSS: the European molecular biology open
software suite.Trends in Genetics16:276–277DOI 10.1016/S0168-9525(00)02024-2.
Roberts MA, Schwartz TS, Karl SA. 2004.Global population genetic structure and
male-mediated gene flow in the green sea turtle (Chelonia mydas): analysis of microsatellite loci.Genetics166:1857–1870DOI 10.1534/genetics.166.4.1857.
Rousset F. 2008.GENEPOP’007: a complete re-implementation of the GENEPOP
software for Windows and Linux.Molecular Ecology Resources8:103–106
DOI 10.1111/j.1471-8286.2007.01931.x.
Selkoe KA, Toonen RJ. 2006.Microsatellites for ecologists: a practical guide to using and
evaluating microsatellite markers.Ecology Letters9:615–629
Toh TC, Peh J, Chou LM. 2013.Early onset of zooplanktivory in equatorial reef coral recruits.Marine Biodiversity43:177–178DOI 10.1007/s12526-013-0156-5.
Toonen RJ, Grosberg RK. 2011.Causes of chaos: spatial and temporal genetic
hetero-geneity in the intertidal anomuran crab Petrolisthes cinctipes.Phylogeography and Population Genetics in Crustacea75–107.
Wallace CC. 1985.Reproduction, recruitment and fragmentation in nine sympatric
species of the coral genus Acropora.Marine Biology 88:217–233
DOI 10.1007/BF00392585.
Walton A, White AT, Tighe S, Aliño PM, Laroya L, Dermawan A, Kasasiah A, Hamid
SA, Vave-Karamui A, Genia V, De Jesus Martins L, Green AL. 2014.Establishing
a functional region-wide coral triangle marine protected area system.Coastal Management 42:107–127DOI 10.1080/08920753.2014.877765.
Wang S, Zhang L, Matz M. 2009.Microsatellite characterization and marker
devel-opment from public EST and WGS databases in the reef-building coralAcropora millepora(Cnidaria, Anthozoa, Scleractinia).Journal of Heredity100:329–337
DOI 10.1093/jhered/esn100.
Woodson CB, McManus MA. 2007.Foraging behavior can influence dispersal of marine
organisms.Limnology and Oceanography 52:2701–2709
DOI 10.4319/lo.2007.52.6.2701.
Young A, Boyle T, Brown T. 1996.The population genetic consequences of habitat
fragmentation for plants.Trends in Ecology & Evolution11:413–418
DOI 10.1016/0169-5347(96)10045-8.
Zhang J, Kobert K, Flouri T, Stamatakis A. 2014.PEAR: a fast and accurate Illumina
Paired-End reAd mergeR.Bioinformatics30:614–620