INCOME DISTRIBUTION IN INTELLECTUAL PROPERTY RIGHTS PROTECTION
Aisling Winston
A dissertation submitted to the faculty at the University of North Carolina at Chapel Hill in partial fulfillment of the requirements for the degree of Doctor of Philosophy in the Department
of Economics.
Chapel Hill 2018
Approved by: Gary Biglaiser Simon Alder
c
2018
ABSTRACT
Aisling Winston: Income Distribution in Intellectual Property Rights Protection (Under the direction of Gary Biglaiser)
This paper proposes a general model of the government’s choice of intellectual property rights protection given the structure of the import market and the distribution of consumers’ incomes. The model shows that the optimal level of protection chosen by the government, while most heavily influenced by institutional structures, differs depending on whether there is a competitive domestic fringe or a single domestic firm and on whether consumers’ incomes are relatively equally or unequally distributed. Measures of de facto and de jure intellectual property rights protection are used to test the implications of the models.
The model is then extended to include local governments in trying to explain the divergence between the formal level of protection and the reality of protection in different localities.
Localities, in response to their constituents and their preferences for foreign actors, will choose to deviate from the federal level of protection, subject to the level of autonomy. The federal
government will take the chosen deviations and international obligations into consideration when choosing the federal level of protection. These deviations are affected by the objective of domestic production: local consumption or export.
TABLE OF CONTENTS
List of Tables . . . vi
List of Figures . . . vii
List of Abbreviations . . . ix
1 Introduction . . . 1
1.1 Introduction . . . 1
1.2 Literature Review . . . 3
1.2.1 IPR Protection as a Determinant of Growth, Innovation, and Investment . . 4
1.2.2 Other Related Literature . . . 5
2 A Model of the Choice of Intellectual Property Rights Protection . . . 7
2.1 A Basic Model of Consumers and Firms in a Country with IPR Protection . . . 8
2.1.1 Set-Up . . . 8
2.1.2 Competitive Domestic Fringe . . . 11
2.1.3 Single Domestic Firm . . . 12
2.1.4 Comparing the Cases of the General Model . . . 15
2.2 Applications of the Model to Specific Distributions . . . 17
2.2.1 Triangular Distribution . . . 18
2.2.2 Weibull Distribution . . . 21
2.3 Empirical Analysis . . . 24
2.3.1 Data . . . 25
2.3.2 Descriptive Statistics . . . 29
2.3.3 Results . . . 31
3 Extension - Local Governments . . . 37
3.1 Consumers . . . 38
3.2 Firms . . . 38
3.2.1 Competitive Domestic Fringe . . . 39
3.2.2 Single Domestic Firm . . . 40
3.3 Local Governments . . . 41
3.3.1 Competitive Domestic Fringe . . . 41
3.3.2 Single Domestic Firm . . . 42
3.4 Federal Government . . . 43
3.4.1 Competitive Domestic Fringe . . . 43
3.4.2 Single Domestic Firm . . . 44
3.5 Discussion . . . 44
3.6 Conclusion . . . 46
4 Country Study - Jordan . . . 48
4.1 History of Intellectual Property Rights Protection in Jordan . . . 50
4.1.1 IPR Protection before 2000 . . . 51
4.1.2 Increase in IPR Protection . . . 52
4.1.3 IPR Protection after 2000 . . . 53
4.1.4 Discussion of the Increase in Protection . . . 54
4.2 IPR Protection in Comparison Countries . . . 58
4.2.1 Egypt . . . 58
4.2.2 Iraq . . . 59
4.2.3 Lebanon . . . 61
4.2.4 Morocco . . . 61
4.2.5 Syria . . . 62
4.2.6 Tunisia . . . 63
4.2.7 Yemen . . . 63
4.3 Brief Economic Overview of Comparison Countries . . . 64
4.4.1 Market Structure . . . 67
4.4.2 Distribution of Income . . . 71
4.4.3 Local Government . . . 73
4.5 Conclusion . . . 74
5 Conclusion . . . 76
A Explanation of Model Results . . . 78
A.1 General Model . . . 78
A.1.1 Competitive Domestic Fringe . . . 78
A.1.2 Single Domestic Firm . . . 81
A.2 Application: Triangular Distribution . . . 85
A.2.1 Competitive Domestic Fringe . . . 86
A.3 Application: Weibull Distribution . . . 88
A.3.1 Competitive Domestic Fringe . . . 88
A.3.2 Single Domestic Firm . . . 91
B Additional Tables . . . 94
LIST OF TABLES
2.1 General Model - Key Results . . . 15
2.2 General Model - Responses to Changes in Protection . . . 16
2.3 Triangular Distribution with Competitive Domestic Fringe . . . 20
2.4 Triangular Distribution with Single Domestic Firm . . . 21
2.5 Weibull Distribution with Competitive Domestic Fringe . . . 23
2.6 Weibull Distribution with Single Domestic Firm . . . 24
2.7 Descriptive Statistics by Income Classification . . . 30
2.8 Descriptive Statistics by Government Type . . . 30
2.9 Descriptive Statistics before and after TRIPS . . . 31
2.10 Regressions on Formal IPR Protection . . . 32
2.11 Regressions on De Facto IPR Protection . . . 32
2.12 Regressions on De Facto IPR Protection . . . 34
2.13 Regressions on Formal IPR Protection . . . 35
B.1 Regressions on Formal and De Facto IPR Protection . . . 94
B.2 Regressions on Formal and De Facto IPR Protection . . . 95
B.3 Regressions on Formal IPR Protection in Developing Economies . . . 95
B.4 Regressions on De Facto IPR Protection in Developing Economies . . . 96
B.5 Regressions on De Facto IPR Protection in Developing Economies . . . 97
B.6 List of Included Countries . . . 98
B.7 Deviation of De Facto IPR Protection from Formal IPR Protection . . . 99
LIST OF FIGURES
4.1 Formal IPR Protection in MENA . . . 50
4.2 De Facto IPR Protection in MENA . . . 51
4.3 Formal IPR Protection in Comparison Countries . . . 68
4.4 De Facto IPR Protection in Comparison Countries . . . 68
4.5 Intensity of Local Competition in Comparison Countries . . . 69
4.6 Extent of Market Dominance in Comparison Countries . . . 70
LIST OF ABBREVIATIONS
GDP Gross Domestic Product
GNI Gross National Income
GP Index Ginarte and Park Index IPR Intellectual Property Rights
TRIPS Agreement on Trade-Related Aspects of Intellectual Property Rights
WEF World Economic Forum
CHAPTER 1: INTRODUCTION
1.1 Introduction
Despite the international community’s demand for ever increasing protection of intellectual property rights (IPR), divergence in the protection of IPR persists. While a number of countries have continued to strengthen protection over time, mandating IPR protection clauses in bilateral and multilateral agreements and instituting and strictly enforcing patent laws, others have been persistent in their non-protection, both within the formal legal sphere and in terms of actual enforcement. Given the recent emphasis in international agreements on increased and somewhat homogenized enforcement of IPR protection, it is interesting to examine why governments persist in choosing low levels of IPR enforcement, even in the face of potential retaliation from trading partners or potential loss of investment. This paper argues that governments, especially those in developing economies, take into consideration the structures of their import markets, levels of inequality, and institutions in determining their optimal levels of IPR protection.
will help to elucidate incentives to raise or lower protection despite the influence of institutions. The general model takes institutions as exogenously determined. The case in which the
institutions are determined by the consumers and firms themselves is left for a later extension. The model shows that, in the case of the competitive domestic fringe, higher levels of
protection benefit only the foreign firm and hurt all consumers (the domestic firms are ultimately unaffected). In the case of a duopoly, higher levels of protection benefit the foreign firm and the consumers of the foreign good but hurt the consumers of the domestic good. Higher protection first benefits then hurts the domestic firm. It is also shown that more inequality (specifically a majority of consumers of the poorest type) encourages the government to choose a lower level of protection, all else equal.
The model in its current form is inherently simplistic in its conception of the government with the intention of highlighting the role of the distribution of income in influencing the government’s behavior. It cannot, therefore, fully explain why governments deviate from the optimal level of protection. An extension of the model explored in Chapter 3 introduces one reason for this deviation: local governments. The extension considers the impact of local governments with objectives that might either align with or contradict those of the federal government in explaining the deviation between the formal and de facto levels of protection. The chosen deviation of the local government is dependent upon the interests of the domestic actors and the local government’s preferences for domestic versus foreign actors. It is further affected by whether the foreign and domestic firms are producing for consumption in the locality,
consumption in other localities, or export. Local governments are constrained in their deviations by the level of autonomy. The federal government chooses its level of protection by weighing the chosen levels of deviation and international obligations.
explain the levels of protection in Jordan before and after this change as compared to a group of countries with similar religious make-up, colonial and legal history, per capita incomes, and cultures.
The order of this paper is as follows: Chapter 1 introduces the model and looks at the related literature, Chapter 2 lays out the base model, Chapter 3 gives the extension with local
governments, Chapter 4 examines the case of Jordan, and Chapter 5 concludes.
1.2 Literature Review
Very little of the economic literature on IPR protection tries to predict protection itself. The most closely-related attempts to explain IPR protection in the economic literature are those of Ginarte and Park (1997), in the same article in which they introduce their measure of IPR protection, and that of Chen and Puttitanun (2005). While both look at the role of per capita income on predicting IPR, neither looks at the distribution of income.
Ginarte and Park attempt to explain the level of IPR protection by looking at per capita GDP, openness to trade, political and market freedom, and investment in innovation. They predicted that increases in all of the aforementioned factors would increase the incentive to protect IPR. They found that different factors were more or less important depending upon the per capita GDP. For example, investment in innovation was only an important driver of
protection if the country was sufficiently wealthy to be creating new technologies when investing, and openness was only an important driver of protection in the poorer countries, ostensibly because most of the wealthier countries were already relatively open. An alternative explanation to the co-occurrence is that poorer countries are more vulnerable to outside pressures to adopt neo-liberal policies, including openness to trade.
GDP and other explanatory variables is important. It is possible that GDP per capita is obscuring or reflecting the importance of other institutions, as there appears to be a relatively strong link between colonial and institutional history and GDP per capita.
Instead of trying to predict IPR protection, much of the related literature looks at the impact of IPR protection on growth, innovation, and foreign investment. The below sections consider some of the literature that uses IPR as a determinant of other measures of development and related literature that is not specific to IPR protection.
1.2.1 IPR Protection as a Determinant of Growth, Innovation, and Investment Until recently, conventional wisdom, reflected in the stance of the World Trade Organization and other international organizations, has dictated that stronger enforcement of IPR should lead to an increased level of international investment in a country. In contrast, however, we have seen foreign investment grow in countries with relatively weak enforcement of IPR (Zhao 2006). Zhao argues that companies that are able to effectively protect their valuable intellectual property through internal structures are likely to continue to invest abroad to take advantage of lower costs, despite low protection of IPR. If companies are able to use their internal structures to provide the protection a country cannot or will not provide, then the necessity of strong formal protection is alleviated, encouraging foreign investment.
imitation effects supports the frequently seen argument of a quadratic relationship between development, as illustrated by GDP per capita, and IPR protection.
Other literature in the field examines the relationship between patents, their enforcement, and innovation. Again, conventional wisdom dictates that stronger IPR protection promotes innovation. Moser (2013) showed that the historical record does not necessarily support this view. The ability to keep trade secrets, not effective legal IPR protection, has mattered more
historically to innovation. However, Moser did note that IPR protection has had a notable impact on the direction of technological change. Countries with effective IPR regimes have a wider breadth of innovation, especially in manufacturing industries. This being said, Moser shows, based on a survey of firms, that most sectors do not perceive patents as an effective means of IPR protection, preferring secrecy. The notable exceptions to this are the chemical and
pharmaceutical sectors. Lerner (2009) found a striking relationship between patents and IPR protection, namely that while foreign patent applications in a country increased steeply following an increase in IPR protection, patent applications by the residents of that country decreased following the same increase in protection. This lends support to the idea that better protection encourages foreign involvement in a country, but certainly also casts doubt on the idea that better protection fosters innovation. The experience of countries such as Lebanon and Jordan have demonstrated that increased protection at least correlates with additional foreign investment and confidence, and while rhetoric in both countries extols the potential benefits of increased
protection for domestic innovation, it is still too early to see if that benefit has been realized.
1.2.2 Other Related Literature
most important determinant on modern levels of development. Geographical variables, such as distance to the equator and settler mortality rates, as posited by Acemoglu et al. (2001), influence modern GDP per capita through their influence on the development of institutions.
CHAPTER 2: A MODEL OF THE CHOICE OF INTELLECTUAL PROPERTY RIGHTS PROTECTION
This model of the choice of the level of IPR protection assumes a developing country importing a good with exogenously-determined quality from a developed country. The general form of this model has two cases: 1) the import sector has a competitive domestic fringe
attempting to imitate and sell their own versions of the foreign good, and 2) the import sector has a single domestic firm attempting to imitate and sell its own version of the good. In both cases, the timeline is as follows: first, the government chooses the level of IPR protection, then the firms choose their prices (the domestic price will be equal to the marginal cost, assumed to be zero, in the case of the competitive domestic fringe), and finally consumers choose to purchase 0 or 1 unit of the good (either the domestic or the foreign). The government’s choice of IPR protection will ultimately depend on institutions, but the application of the model to two income different distributions will help to elucidate other elements affecting the choice of IPR.
The model shows that, in the case of the competitive domestic fringe, higher levels of
protection benefit only the foreign firm and hurt all consumers (the domestic firms are ultimately unaffected). In the case of a duopoly, higher levels of protection benefit the foreign firm and the consumers of the foreign good but hurt the consumers of the domestic good. The utility of the domestic firm is first increasing then decreasing in protection. The model also shows that more inequality (specifically a majority of consumers of the poorest type) encourages the government to choose a lower level of protection, all else equal.
The model in its current form is inherently simplistic in its conception of the government with the intention of highlighting the role of the distribution of income in influencing the government’s behavior. It cannot, therefore, fully explain why governments deviate from the optimal level of protection.
Section 3 uses data to test the implications of the model, and Section 4 concludes.
2.1 A Basic Model of Consumers and Firms in a Country with IPR Protection
This model aims to explain the impact on a government’s optimal choice of IPR protection of a country’s distribution of consumer incomes, market structure, and government preferences. The model is of vertically differentiated goods in which consumers purchase either 0 or 1 units.
2.1.1 Set-Up
In this model, a foreign firm and a single domestic firm or competitive domestic fringe sell a product. The foreign firm creates the product outside the country of interest, and the domestic firm or firms attempt to imitate the product. The government first chooses the level of IPR protection. The foreign firm and the domestic firm or firms then choose their prices. Finally, consumers make their purchasing decisions.
For ease of exposition, both the lowest consumer type (consumer income) and the costs of production are assumed to be zero.
Firms
The model assumes vertically differentiated goods produced by a foreign firm that has created a product outside the country and a single domestic firm or competitive fringe that attempts to imitate the foreign good. The quality of the foreign good,µF, is determined
exogenously; that is, the quality of the foreign good sold in the country of interest is taken to be the same as the quality of that same good in any other market. It is assumed that the foreign firm will not intentionally reduce (or raise) the quality of the good.
protection.
With any positive level of intellectual property rights protection, the domestic firm can produce a good of quality equal to, at most,µD = (1−α)µF. With no intellectual property rights protection, the domestic firm can, at best, produce a good of the same quality as the foreign firm. Therefore, µD ∈[0, µF]. It is assumed that the domestic firm’sinability to imitate is increasing in intellectual property rights protection.
For ease of exposition, domestic and foreign firms are assumed to face the same fixed cost of entry, and this cost is taken to be zero. In the case with the competitive domestic fringe,
therefore, the market will be covered as the domestic firms will compete, driving prices to equal marginal cost, which is also assumed to be zero. In the case with a single domestic firm, the market will not be covered.
Consumers
In this model, the “type” of the consumer is assumed to be the consumer’s income. The assumption here is that consumers with higher incomes have more utility from the consumption of the good, especially the foreign good, as they are more quality-conscious than are lower-income consumers. The distribution of utilities obtained from consumption therefore resembles that of the income distribution. Henceforth, “the distribution of consumers” will refer to the distribution of consumer incomes. The distributions of consumer incomes are assumed to be log-concave, distributed according toh(x) along [0, b]. This is consistent with research on income distribution.
Consumers purchase either 0 or 1 unit of a good. If consumers do not purchase either the foreign or the domestic good, they receive zero utility. If a consumer purchases a unit of the good, she receives a utility of µix−pi, where µi is the quality of the good,pi is the price of the good, i∈ {F, D} represents the firm (foreign or domestic), andx is the consumer’s type.
A consumer will only purchase a good if x≥ pi
µi. Since the model assumes that the quality of
the foreign good is higher than the quality of the domestic good, this implies that the lowest type consumer,xL, will only purchase the good if xL≥ p
D
µD and that every consumer x≥ pD µD will
purchase one unit of a good. All else equal, a consumer who receives zero utility from purchasing would prefer to have the good to not having the good, so consumers of type x= µpDD will purchase
The “indifferent consumer” is the consumer who is indifferent between the purchase of the foreign good and the purchase of the domestic good. The indifferent consumer is characterized as having type ˆx such that ˆx= µpFF−−µpDD > xL. All else equal, consumers prefer the foreign good to the
domestic good due to its higher quality. Therefore, every consumer with type x≥ µpFF−−pµDD will
purchase the foreign good.
Government
The government chooses the level of IPR protection,α, to maximize its own welfare function, G:
G=ρ(CUF +CUD+πD) + (1−ρ)πF,
in which ρ represents the government’s preference for domestic actors,CUi represents the consumer surplus from consumption of the domestic or foreign good, andπi represents the profit earned by the domestic or foreign firm.
The government’s preference for domestic actors can be thought of as illustrative of the government type - democratic governments may be more responsive to voters and therefore may be more likely to respond to the interests of domestic consumers and firms, whereas autocratic governments may benefit more from deals made with foreign firms and may therefore be more likely to respond to the interests of foreign firms. The government therefore faces a trade-off between the well-being of domestic actors and the well-being of the foreign actor.
Structuring the government’s welfare function such that it faces a trade-off between consumers and firms (both domestic and foreign) to examine differences between governments more and less responsive to the needs of its domestic consumers affects the size of the incentives it faces to increase or decrease protection but not the general conclusions of the model. The form of this welfare function would be:
2.1.2 Competitive Domestic Fringe
In this first case, there is a competitive domestic fringe. Because the domestic fringe is competitive, the domestic firms will compete until profits are zero and prices are equal to marginal cost, that is,pD = 0. The quality of the domestic good is given by µD = (1−α)µF.
Because the domestic price is 0, in this case, the market will be covered. The identity of the type of the indifferent consumer is given by ˆx= αµpFF.
Without specifying a distribution, it is impossible to explicitly state the foreign price, as the identity of the type of the indifferent consumer is itself a function of the foreign price. However, the foreign price is unique and can be expressed as pF = 1−hH(ˆx(ˆ)x)αµF, and it is possible to show that for all log-concave distributions the foreign price is everywhere increasing inα. The resulting condition is ∂p∂αF =λ(ˆx)µF >0, in which λ(x) represents the reciprocal of the hazard function,
1−H(x)
h(x) . Given this characterization of the foreign price, it can be shown that for all distributions the indifferent consumer is characterized by ˆx=λ(ˆx). The demand for the foreign good is given by 1−H(ˆx) and the demand for the domestic good is given byH(ˆx). The type of the indifferent consumer is not changing in protection; therefore, the demands for the foreign and domestic goods are not changing in protection.
Due to the increasing price and constant demand, the consumer surplus from the consumption of the foreign good is falling in protection:
∂CUF ∂α =−µ
Fλ(ˆx)(1−H(ˆx))<0
The consumer surplus from the consumption of the domestic good is also falling in protection due to the worsening quality of the domestic good under increased protection:
∂CUD ∂α =µ
F[ Z xˆ
0
H(x)dx−λ(ˆx)H(ˆx)]<0
The foreign profit, however, is everywhere increasing in protection:
∂πF
∂α =λ(ˆx)µ
F(1−H(ˆx))>0
The government choice of IPR protection leads to a trade-off between the well-being of consumers and that of the foreign firm. Its optimal level of protection depends upon how much it cares for each set of actors. In the case of a competitive domestic fringe, a government will choose to either protect completely or not protect at all depending on its institutions. If the government cares primarily for the well-being of the domestic actors, the government’s objective function will be everywhere decreasing in α, and it will want to minimize its level of protection, choosing a completelack of protection of IPR. If the government cares primarily for the well-being of the foreign firms, the government’s objective function will be everywhere increasing in α, and it will want to maximize its level of protection, choosing to protect completely.
∂G
∂α = (1−2ρ)µ
Fλ(1−H(ˆx))
2.1.3 Single Domestic Firm
Now assume that, instead of a competitive domestic fringe, there is a single domestic firm with the ability to choose its price, pD, and its quality, µD ≤(1−α)µF. Because the domestic price might not be zero (and it will be demonstrated that in this scenario it will not be), the market will not necessarily be covered.
The identity of the type of the indifferent consumer is given by ˆx= µpFF−−pµDD. The identity of
the lowest-type consumer who consumes a good is given byxL= p D
µD ≥0. Any consumer with
type belowxLwill consume zero units. Consumers with types between xL, inclusive, and ˆx will
consume one unit of the domestic good. Consumers with types between ˆx and binclusive will consume one unit of the foreign good.
The domestic firm maximizes its profit by choosingpD andµD subject to µD ≤(1−α)µF:
max
pD,µD Z ˆx
xL
If the constraint were not to bind, then it would be the case that either pD = 0, which requires ˆ
x=xL, or µhF(ˆ−x)ˆµxD =
−h(xL)xL
µD . The latter is only possible if both prices equal zero, given that the
price of the domestic good must be less than or equal to the price of the foreign good and that both prices must be non-negative. Both preclude the possibility of two firms participating in the market. Therefore, it is assumed that the constraint binds, µD = (1−α)µF, and that the domestic firm will choose the following price:
pD = H(ˆx)−H(xL) (1−α)h(ˆx) +αh(xL)
α(1−α)µF
As before, the foreign firm’s problem is to maximize its profit by choosingpF:
max
pF Z b
ˆ
x
pFh(x)dx
resulting in:
pF = 1−H(ˆx) h(ˆx) (µ
F −µD)
Given this, the two prices can be given by the following:
pF =αλ(ˆx)µF
pD =α(1−α)Λ(ˆx, xL)µF
Whereλ(ˆx) = 1−hH(ˆx(ˆ)x) and Λ(ˆx, xL) = (1−Hα(ˆ)xh)(ˆ−x)+H(αhxL()x
L). This gives ˆx=λ(ˆx)−(1−α)Λ(ˆx, xL) and
xL=αΛ(ˆx, xL), and thus, since ˆx > xL,λ(ˆx)>Λ(ˆx, xL).
The type of the indifferent consumer is not changing in protection; however, the type of the lowest-type consumer is increasing in protection. Therefore, both the foreign and domestic prices are increasing in protection:
∂pF ∂α =µ
Fλ(ˆx)>0
∂pD
∂α = (1−α)µ
FΛ(ˆx, x L)>0
protection. As a result, the consumer surplus from the consumption of the foreign good and the consumer surplus from the consumption of the domestic good are both falling in protection:
∂CUF ∂α =−µ
Fλ(ˆx)(1−H(ˆx))<0
∂CUD ∂α =µ
F[ Z xˆ
xL
H(x)dx+ Λ(ˆx, xL)H(xL)−λ(ˆx)H(ˆx)]<0
At the same time, the constant demand for the foreign good and the rising price of the foreign good mean that the profit earned by the foreign firm is increasing in protection:
∂πF ∂α =µ
Fλ(ˆx)(1−H(ˆx))>0
The impact on the domestic profit of a change in protection is less straightforward. On the one hand, the domestic firm can charge higher prices as protection increases, putting upward pressure on its profits. On the other hand, the demand for the domestic good is decreasing in protection, putting downward pressure on its profits. Domestic profit is therefore first increasing then decreasing in protection:
∂πD ∂α =µ
FΛ(−αΛh(x
L) + (1−α)(H(ˆx)−H(xL)))≷0
As in the case of a competitive domestic fringe, the government’s choice of IPR protection leads to a trade-off between the well-being of consumers and the domestic firm and that of the foreign firm. Its choice of the optimal level of protection will therefore depend primarily upon the relative weights on the domestic and foreign actors, bearing in mind that domestic profit is first rising then falling in protection. The government will choose α such that the following equals zero, given ρ:
∂G ∂α =ρµ
F [
Z ˆx xL
H(x)dx−λ(ˆx) + Λ(ˆx, xL)((1−α)H(ˆx) +αH(xL))−αΛ(ˆx, xL)h(xL)] + (1−ρ)µFλ(ˆx)(1−H(ˆx))
Thisα is given by:
α= ρ[
Rxˆ
xLH(x)dx−λ(ˆx) + Λ(ˆx, xL)H(ˆx)] + (1−ρ)λ(ˆx)(1−H(ˆx))
ρΛ(ˆx, xL)[(H(ˆx)−H(xL)) +h(xL)]
government’s objective function will be everywhere increasing in α, so the government will choose to maximize its protection. More specifically, the government will always choose a positive level of protection if 1−ρρ < λ(ˆx)−Λ(ˆx,xL)H(ˆx)−
Rˆx
xLH(x)dx
λ(ˆx)(1−H(ˆx)) . Forρsufficiently close to one, that is, for sufficient weight placed on the domestic actors, the government’s objective function will be everywhere decreasing inα, so the government will choose to minimize its protection.
2.1.4 Comparing the Cases of the General Model
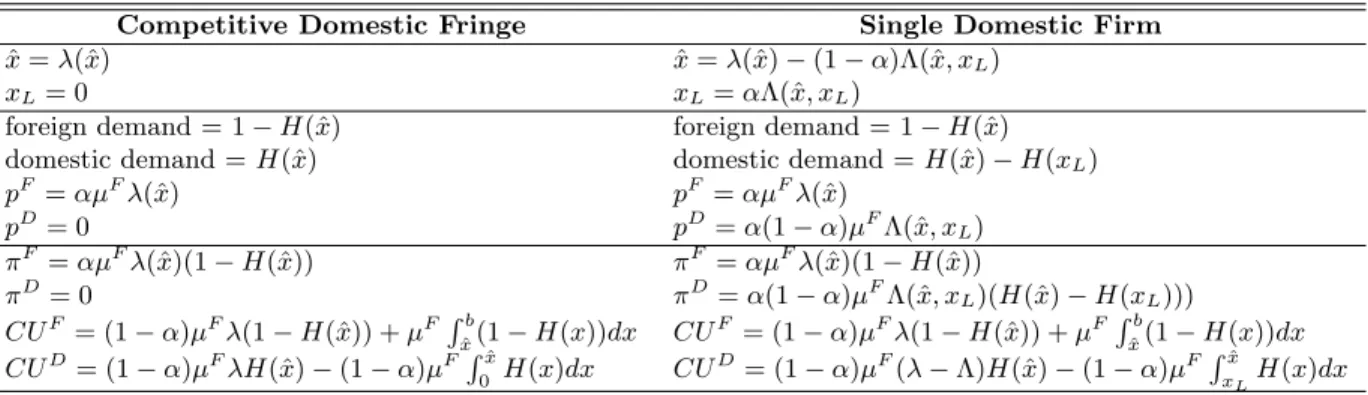
Table 2.1 shows the results from the two models, side-by-side. Table 2.1: General Model - Key Results
Competitive Domestic Fringe Single Domestic Firm
ˆ
x=λ(ˆx) xˆ=λ(ˆx)−(1−α)Λ(ˆx, xL)
xL= 0 xL=αΛ(ˆx, xL)
foreign demand = 1−H(ˆx) foreign demand = 1−H(ˆx) domestic demand =H(ˆx) domestic demand =H(ˆx)−H(xL) pF =αµFλ(ˆx) pF =αµFλ(ˆx)
pD= 0 pD=α(1−α)µFΛ(ˆx, xL)
πF =αµFλ(ˆx)(1−H(ˆx)) πF =αµFλ(ˆx)(1−H(ˆx))
πD= 0 πD=α(1−α)µFΛ(ˆx, xL)(H(ˆx)−H(xL))) CUF = (1−α)µFλ(1−H(ˆx)) +µFRb
ˆ
x(1−H(x))dx CU F
= (1−α)µFλ(1−H(ˆx)) +µFRb ˆ
x(1−H(x))dx CUD= (1−α)µFλH(ˆx)−(1−α)µFRˆx
0 H(x)dx CU
D= (1−α)µF(λ−Λ)H(ˆx)−(1−α)µFRxˆ
xLH(x)dx
As can be seen in Table 2.1, while the forms of the foreign demand, foreign price, foreign profit, and consumer surplus from the consumption of the foreign good are the same in both models, the form of the type of the indifferent consumer differs between the two models. The impact on foreign variables depends only upon the value of the indifferent consumer’s type.
Much of the difference between the two models is driven by the domestic firm. The type of the lowest-type consumer is higher under a single domestic firm, so, whereas under a competitive domestic fringe the market is covered, the market is not covered with a single domestic firm (unless there is no protection of IPR). Under a single domestic firm, the demand for the domestic good is smaller, but the price is higher, so the domestic firm earns some profit and, for sufficiently low levels of protection, has incentive to pressure the government to increase protection. As a result of this increased domestic profit, the consumer surplus from the consumption of the domestic good under a single domestic firm is lower.
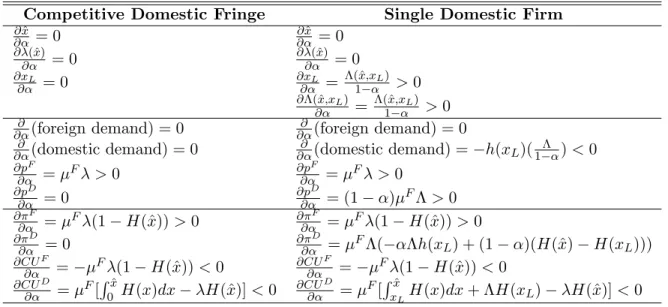
Table 2.2: General Model - Responses to Changes in Protection Competitive Domestic Fringe Single Domestic Firm
∂xˆ
∂α = 0
∂xˆ
∂α = 0 ∂λ(ˆx)
∂α = 0
∂λ(ˆx)
∂α = 0 ∂xL
∂α = 0
∂xL ∂α =
Λ(ˆx,xL)
1−α >0 ∂Λ(ˆx,xL)
∂α =
Λ(ˆx,xL)
1−α >0 ∂
∂α(foreign demand) = 0
∂
∂α(foreign demand) = 0 ∂
∂α(domestic demand) = 0
∂
∂α(domestic demand) =−h(xL)(
Λ 1−α)<0 ∂pF
∂α =µ
Fλ >0 ∂pF
∂α =µ Fλ >0 ∂pD
∂α = 0
∂pD
∂α = (1−α)µ
FΛ>0 ∂πF
∂α =µ
Fλ(1−H(ˆx))>0 ∂πF ∂α =µ
Fλ(1−H(ˆx))>0 ∂πD
∂α = 0
∂πD ∂α =µ
FΛ(−αΛh(x
L) + (1−α)(H(ˆx)−H(xL))) ∂CUF
∂α =−µ
Fλ(1−H(ˆx))<0 ∂CUF ∂α =−µ
Fλ(1−H(ˆx))<0 ∂CUD
∂α =µ F[Rxˆ
0 H(x)dx−λH(ˆx)]<0
∂CUD ∂α =µ
F[Rxˆ
xLH(x)dx+ ΛH(xL)−λH(ˆx)]<0
As can be seen in Table 2.2, the impacts on the foreign variables of an increase in protection are the same for the two cases (the relative sizes of ˆxand λ(ˆx) not withstanding). The variation comes from the domestic variables. The type of the lowest-type consumer under a single domestic firm is increasing in protection, causing the size of the demand for the domestic good to decrease in protection. Additionally, the price of the domestic good in a single domestic firm is increasing in protection. Both the type of the lowest-type consumer and the domestic price are unchanging in protection under a competitive domestic fringe.
In the case of the competitive domestic fringe, the consumer surplus from the consumption of the domestic good is falling in protection due only to the decreasing quality of the domestic good as protection rises, as neither the domestic price nor the size of demand for the domestic good is changing in protection. However, in the case of a single domestic firm, the domestic price is rising and the size of the demand for the domestic good is falling, in addition to the quality of the domestic good falling. The fact that the consumer surplus from the consumption of the domestic good is necessarily falling in both cases gives the following two conditions.
For the competitive domestic fringe,
λH(ˆx)>
Z ˆx
0
For the single domestic firm,
λH(ˆx)>
Z xˆ
xL
H(x)dx+ ΛH(xL)
With a competitive domestic fringe, domestic firm profits are zero, and this is not changing with protection. However, the domestic firm profits under a single domestic firm are positive. When protection is low, the domestic firm has a low price and high demand. The impact of an increase in protection is therefore an increase in profit, as the benefit of an increase in price outweighs the detriment of a decrease in demand. When protection is already high, the demand for the domestic good is much smaller. Therefore, the detrimental impact of a decrease in demand that results from a further increase in protection outweighs the beneficial impact of an increase in price, and the profit decreases in protection.
The impact on the government surplus of an increase in protection differs between cases in three ways (the relative sizes of ˆx and λ(ˆx) notwithstanding): 1) the expected type of the consumer of either good, 2) the impact on the consumer surplus from the domestic good, and 3) the impact on the domestic profit.
∂GCDF ∂α =ρµ
F[ Z xˆ
0
H(x)dx−λ] + (1−ρ)µFλ(1−H(ˆx))
∂GSDF ∂α =ρµ
F[ Z xˆ
xL
H(x)dx−λ+ Λ ((1−α)H(ˆx) +αH(xL))−αΛh(xL)
] + (1−ρ)µFλ(1−H(ˆx))
In the case of the competitive domestic fringe, the government chooses either complete protection or a complete lack of protection. The presence of the domestic firm and the uncovered market adds additional complexity in the case of the single domestic firm, complexity that allows for the possibility of an interior solution forρ insufficiently extreme.
2.2 Applications of the Model to Specific Distributions
distribution and the Weibull distribution. The shape of the triangular distribution moves from uniform at one extreme to linearly decreasing to a mass of zero on the highest-type consumer at the other extreme. The shape of the Weibull distribution moves from everywhere decreasing at one extreme to an increasing concentration about a mode located away from the lower bound as the shape parameter increases.
Inequality varies with the shape parameter in both cases, though the extent of the variety is much more pronounced in the case of the Weibull distribution. Inequality here refers to the relative proportions of income and population. Perfect equality therefore means that 10% of the population accounts for 10% of the income and 90% of the population accounts for 90% of the income, etc. Perfect inequality means that no one but the highest-type consumer accounts for any income, and the highest-type consumer accounts for 100% of the income.
In the case of the triangular distribution, the difference in inequality between the two extremes is quite small, so the main effect of an increase in the shape parameter is a shift of consumers toward the lower bound. In the case of the Weibull distribution, the effect of an increase in the shape parameter is a concentration of consumers about the mode, away from the lower bound. Therefore, the results suggested by the model for the different distributions are somewhat different. As the shape parameter for the Weibull distribution falls, it begins to look more like the triangular distribution with the shape parameter at its maximum. Looking at these two distributions therefore paints two different pictures describing two different behaviors.
2.2.1 Triangular Distribution
This example uses a triangular distribution with a parameter,c, that allows it to vary from uniform to downward-sloping with no weight on the highest-type consumer. The triangular distribution does not accurately depict the reality of distributions of consumer incomes; however, much of the theoretical literature assumes uniform distributions of consumers. Using this
The pdf for the triangular distribution is as below:
h(x) = 2
b2(1−c)x+ c b
for which the support is [0, b] and bis the highest-type consumer. The parameterc∈(1,2] controls the slope, withc= 1 representing a uniform distribution. It is important to note that there is a discontinuity atc= 1 in the characterization of the indifferent consumer, so the distribution can never be perfectly uniform.
Ascincreases, the weight on the lowest-type consumer is increased and inequality increases. Asb increases, the type of the highest-type consumer increases, reducing the slope of the
distribution.
Competitive Domestic Fringe
Under a competitive domestic fringe, the indifferent consumer is decreasing inc. As a country becomes relatively more unequal, as consumers become increasingly concentrated at the bottom of the income distribution, the price chosen by the foreign firm falls, and so the type of the indifferent consumer decreases.
At the same time, as type of the indifferent consumer falls, the domestic demand falls and the foreign demand rises. However, the decrease in foreign price dominates the increase in demand for the foreign good, so the foreign firm sees its profits fall as inequality rises. The drop in foreign price and increase in demand for the foreign good mean that consumer surplus from the consumption of the foreign good is rising inc. The consumer surplus from the consumption of the domestic good is falling inc as the domestic demand falls.
Forc sufficiently close to 1 or 2, that is, for perfect uniformity or if there is a sufficient mass of consumers of the lowest type, the government will always choose not to protect IPR. However, ascapproaches 32, such that there is enough weight on the highest-type consumers that the utility earned from the consumption of the foreign good is an important driver of the government’s objective function, a government’s choice to fully protect or not protect will depend upon the value of ρ, its institutions.
Table 2.3: Triangular Distribution with Competitive Domestic Fringe
Variables Responses to Changing Parameters ˆ
x=λ(x) = bc−b √
c2+3−3c
3(c−1)
∂xˆ
∂c <0 ∂xˆ
∂b >0
xL= 0
1−H(ˆx) = c(6+ √
c2+3−3c)−c2−6
9(c−1)
∂(1−H(ˆx))
∂c =−h(ˆx) ∂xˆ
∂c >0 ∂(1−H(ˆx))
∂b =−h(ˆx) ∂xˆ
∂b <0
H(ˆx) = c2+c(3− √
c2+3−3c)−3
9(c−1)
∂H(ˆx)
∂c =h(ˆx) ∂xˆ
∂c <0 ∂H(ˆx)
∂b =h(ˆx) ∂xˆ
∂b >0
pF =αµF(bc−b √
c2+3−3c
3(c−1) )
∂pF
∂c =αµF ∂
ˆ
x ∂c <0 ∂pF
∂b =αµ F ∂ˆx
∂b >0
pD = 0
πF =αµF(bc−b √
c2+3−3c
3(c−1) )(
c(6+√c2+3−3c)−c2−6
9(c−1) )
∂πF ∂c <0 ∂πF
∂b >0
πD = 0
∂CUF ∂c >0 ∂CUF
∂b <0 ∂CUD
∂c <0 ∂CUD
∂b >0
by the benefit to those consuming the foreign good. As a result, as consumers are increasingly concentrated at the bottom of the income distribution, the incentive for the government to protect IPR increases, even if it’s final decision is still not to protect at all.
Asbincreases, all else equal, the slope of the distribution is reduced, and so the effect is similar to reducing c. Therefore, the impact on the variables of an increase inbis opposite that of an increase in c.
Single Domestic Firm
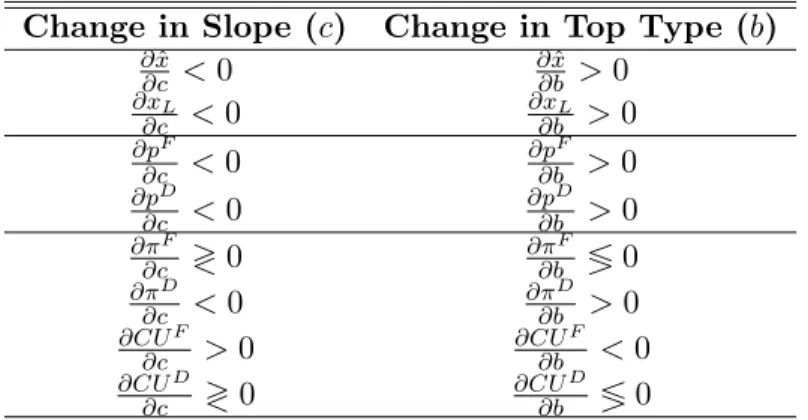
In the case of a single domestic firm, an increase inc, an increase in inequality as consumers are increasingly concentrated at the bottom of the income distribution, or a decrease inb causes the prices of both goods to fall, causing the types of the indifferent and low-type consumers to decrease. The difference between the indifferent and low-type consumers falls asc increases orb decreases. Therefore, demand for the foreign good increases in inequality while demand for the domestic good decreases in inequality.
Table 2.4: Triangular Distribution with Single Domestic Firm Change in Slope (c) Change in Top Type (b)
∂xˆ
∂c <0
∂xˆ
∂b >0 ∂xL
∂c <0
∂xL ∂b >0 ∂pF
∂c <0
∂pF ∂b >0 ∂pD
∂c <0
∂pD ∂b >0 ∂πF
∂c ≷0
∂πF ∂b ≶0 ∂πD
∂c <0
∂πD ∂b >0 ∂CUF
∂c >0
∂CUF ∂b <0 ∂CUD
∂c ≷0
∂CUD ∂b ≶0
decrease when the it does not. Domestic profits fall in inequality. Consumer utility from the consumption of the foreign good increases, but consumer utility from the consumption of the domestic good first increases then decreases in inequality. Incentives for the government to raise or lower IPR protection therefore depend both uponc itself and upon the weights placed on the domestic and foreign actors.
2.2.2 Weibull Distribution
The Weibull distribution is a more accurate representation of the distribution of consumer incomes than is the triangular distribution. Indeed, Bandourian, et al. (2003) show that the Weibull distribution is the best-fitting two-parameter distribution among the countries in their sample. This example uses a Weibull distribution with a scale parameter,b∈(0,∞), and a shape parameter, c∈(1, e). The PDF and CDF for this distribution are (for x≥0):
h(x) = c b(
x b)
c−1exp[−(x b)
c]
H(x) = 1−exp[−(x b)
c]
upon the size ofc, specifically, its relation to Euler’s constant. Since most estimates of the shape parameters of income distributions using the Weibull distribution are less than 2.5, the
assumption will be thatc is less than Euler’s constant. The Weibull distribution is only log-concave for values of the shape parameter greater than 1. Most estimates of the shape parameters of income distributions using the Weibull distribution are greater than 1, so the assumption will be thatc is also greater than 1.
Competitive Domestic Fringe
Under a competitive domestic fringe, the foreign price is decreasing in c, that is, as
consumers are more concentrated about the mode and inequality is decreasing, the price of the foreign good falls. Since the price of the domestic good is zero, this means that the type of the indifferent consumer is also falling inc. As a result, the demand for the foreign good is rising inc, and the demand for the domestic good is falling.
The profit earned by the foreign firm is falling inc, that is, it falls as inequality falls, as the drop in price has a larger impact than the increase in demand for the foreign good. The increase in demand combined with the drop in price means that the utility from the consumption of the foreign good is increasing as inequality decreases. The decreasing demand for the domestic good means that the utility from the consumption of the domestic good is decreasing as consumers are more concentrated about the mode.
For sufficient weight placed on the domestic actors, that is, for 1−ρρ > 1−−lnlncc, the government objective function is increasing in c, and vice versa. The optimal choice of IPR protection follows the same pattern. For sufficient weight placed on the domestic actors, the incentive to increase protection is increasing as consumers are more clustered about the mean since the utility from the consumption of the foreign good is increasing.
As the scale parameter,b, increases, the distribution spreads out. This reduces the
protection of a change inb is much more straightforward, depending only upon the changes in the foreign variables. For sufficient weight on the domestic actors, that is, forρ > 12, the government’s objective function and its incentive to protect IPR are decreasing in b, and vice versa.
Table 2.5: Weibull Distribution with Competitive Domestic Fringe Variables Responses to Changing Parameters ˆ
x=λ(x) = b
c1c
∂xˆ
∂c =bc
−1
c −2(lnc−1)<0 ∂xˆ
∂b = (
1
c) 1 c >0
xL= 0
1−H(ˆx) = exp[−1c] ∂(1−∂cH(ˆx)) = c12exp[−c1]>0 ∂(1−H(ˆx))
∂b = 0
H(ˆx) = 1−exp[−1
c]
∂H(ˆx)
∂c =−
1
c2 exp[
−1
c ]<0 ∂H(ˆx)
∂b = 0
pF =αµF b
c1c
∂pF ∂c =αµ
Fbc−c1−2(lnc−1)<0
∂pF ∂b =αµ
F(1
c) 1 c >0
pD = 0
πF =αµFb(1c)1cexp[−1 c]
∂πF ∂c =αµ
Fbc−c1−2exp[−1
c] lnc <0 ∂πF
∂b =αµF(
1
c) 1
c exp[−1 c]>0
πD = 0
∂CUF ∂c >0 ∂CUF
∂b <0 ∂CUD
∂c <0 ∂CUD
∂b = 0
Single Domestic Firm
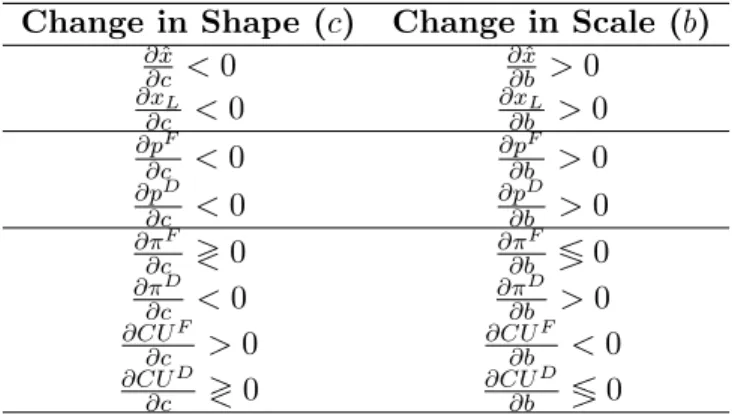
In the case of a single domestic firm, an increase inc, which represents a decrease in inequality as consumers are increasingly concentrated about the mode, causes the types of both the indifferent and the low-type consumers to fall. The difference between the indifferent and low-type consumers is decreasing inc, that is, the type of the indifferent consumer is falling faster than is the type of the low-type consumer. An increase in b, the scale parameter, both increases the mode and spreads out the distribution. Therefore, the types of the indifferent and low-type consumers respond in the opposite direction to an increase inb: both increase.
Both the foreign and domestic prices fall as inequality decreases and rise as the mode and inequality increase. Demand for the foreign good is increasing as inequality decreases, but
Table 2.6: Weibull Distribution with Single Domestic Firm Change in Shape (c) Change in Scale (b)
∂xˆ
∂c <0
∂xˆ
∂b >0 ∂xL
∂c <0
∂xL ∂b >0 ∂pF
∂c <0
∂pF ∂b >0 ∂pD
∂c <0
∂pD ∂b >0 ∂πF
∂c ≷0
∂πF ∂b ≶0 ∂πD
∂c <0
∂πD ∂b >0 ∂CUF
∂c >0
∂CUF ∂b <0 ∂CUD
∂c ≷0
∂CUD ∂b ≶0
foreign good is increasing and domestic profits are decreasing as inequality decreases.
While at first glance it appears that these two applications give opposite predictions about the relationship between inequality and pressures for IPR protection, they are actually telling different stories entirely. The Triangular distribution is demonstrating the response of actors to an increasing mass of consumers at the bottom of the income distribution, with a relatively (when compared to the Weibull distribution) small loss of consumers higher along the income
distribution. The Weibull distribution demonstrates the response of actors to an increasing mass of consumers at some income away from the bottom of the distribution, with a relatively (when compared to the Triangular distribution) large loss of consumers at both the bottom and the top of the income distribution. Since the changes in the shape parameters of these two distributions tell different stories, it is reasonable that the responses to ”increased inequality” in the two cases be different.
2.3 Empirical Analysis
This section aims to test the central claims of the model, namely that IPR protection is changing in income distribution, market structure, and institutions, taking into consideration the importance of development, as defined by GDP per capita.
2.3.1 Data
Quantitative measures of IPR protection, income distribution, development, and political institutions are notoriously fraught with controversy. While it is possible to measure components for each of these, it is often argued that these components provide an incomplete or potentially misleading picture. However, including a number of countries from different income classes and with different government types necessitated the use of these more frequently used, though potentially incomplete, measures, even if more holistic metrics existed.
Intellectual Property Rights Protection
Two measures of IPR protection were used for this analysis. The Ginarte and Park (GP) Index was used to represent formal protection of IPR, while the World Economic Forum IPR score was used to represent de facto protection of IPR.
The GP Index measures a country’s formal IPR protection. This index was developed by Ginarte and Park in 1997 and then updated by Park in 2008, with data through 2010 available on his website. The GP Index includes information on 130 countries for the period 1960-2010. An index measure is given every five years.
The index is created by summing the weighted averages of indicators in five categories: the extent of patent coverage, membership in international agreements, provisions for loss of
protection, enforcement mechanisms, and duration of protection. The index ranges from 0 to 5, with higher values representing stronger levels of protection.
In the literature, the biggest complaint about the GP Index, common to many measures of IPR protection, is that it is a better measure of formal, legal protection than of actual enforced protection. Since there are certainly instances in which governments have laws on the books which are inconsistently enforced, it is not clear that the behavior seen in the GP Index is the same behavior demonstrated by the model, nor is it clear that the GP Index is actually an
accurate representation of protection. It is therefore prudent to examine a different measure of de facto IPR protection.
with some exceptions. The measure was created as part of the WEF’s Executive Opinion Survey. The question asked was, ”In your country, to what extent is intellectual property protected?” A score of 1 represents no protection. A score of 7 represents exceptional protection.
This measure is somewhat more volatile than the GP Index. However, it arguably provides a more realistic measure of de facto protection than does a measure that is based on the existence of IPR protection laws.
A comparison between the two measures is only possible between 2005 and 2010. To do this, data for the missing years was linearly interpolated for both measures. This interpolated data was used when attempting to directly compare the two measures, not when running regressions on the measures independently. A list of countries included in each measure can be found in Appendix B.
Income Distribution
Income distribution was measured using the Gini coefficient. The Gini coefficient ranges from 0 to 1, with 0 representing perfect income equality and 1 representing perfect income inequality. As it is derived from the shape parameter of income distributions, it is independent of the mean or median income. Changes in the Gini coefficient, therefore, are analogous to changes in the shape of the income distributions and do not illustrate the impacts of increases in income.
The primary concern with using the Gini coefficient is that datat is not available for all countries in all years. To address this, a linearly-interpolated measure of the Gini coefficient was used in regressions.
Institutions
In order to get a sense of how incentives differ across rough institutional lines, institutions are represented by government type. It should be expected that the broad government type is an imperfect representation of institutions, especially as there is so much variation of institutions within each of these government types between countries.
hereditary monarchy and 10 representing a consolidated democracy. Based on the suggested classifications, countries receiving scores of 6 or higher was classified as democracies, countries receiving scores between 1 and 5 were classified as open anocracies, countries receiving scores between -5 and 0 were classified as closed anocracies, and countries receiving scores of -6 or lower were classified as autocracies.
The Polity IV process, like other oft-used measures of democracy such as the ones put forth by the Economist Intelligence Unit and Freedom House, looks primarily at the executive branch. It takes into consideration executive recruitment, constraints on executive authority, and the presence or lack of political competition. Other measures, such as the Democracy and
Dictatorship data put forth by Cheibub, Gandhi, and Vreeland (2009), are somewhat more full, including information on legislative selection and power in addition to the information about the executive. However, the Democracy and Dictatorship dataset ended in 2008 and did not cover all countries for the time period. That being said, the correlation between the Democracy and Dictatorship classification and the Polity IV classification was fairly high, 0.81, suggesting that not much was lost in using the Polity IV classification instead.
In addition to Polity IV, Political Constraints data was used for supplemental regressions. This index aims to measure the extent to which changes in the preferences of single political actors lead to changes in government policy. The index ranges from 0 to 1, with higher scores representing more constraint, and thus a smaller likelihood of policy change due to the preferences of a single actor. The index takes into consideration the number of independent branches of the government with veto power, the extent of party alignment across branches of the government, and the extent to which preferences within branches of government are aligned. Regressions using this data can be found in Appendix B.
different way to conceptualize institutions. Representing institutions with Polity IV assumes that preferences are based on executive (and legislative) power derived from voting. Using taxes, however, assumes that preferences are based on sources of revenue. These two ways of
conceptualizing institutions should be interpreted as substitutes for each other. They are two different ways of understanding how the government makes decisions.
Other measures of institutions used include the origin of the legal structure and colonizing country, both of which from the Quality of Government Institute Standard Dataset. Countries were also grouped according to their regions, as there can be religious and institutional
similarities between countries in the same region. Regional groupings were according to the World Bank regional groupings, and include East Asia and Pacific, Europe and Central Asia, Latin America and Caribbean, Middle East and North Africa, North America, South Asia, and Sub-Saharan Africa.
Market Structure
For the years covered by the WEF measure of IPR, the WEF also provided two measures of market structure. The first is a measure of local competition: respondents were asked to rate the intensity of local competition, in which 1 represents local competition that was not intense at all and 7 represents local competition that was extremely intense. The second is a measure of the extent of market dominance, in which 1 represents a market dominated by a few businesses and 7 represents a market spread among many firms. The question for the first was, “In your country, how intense is competition in the local markets?” The question asked for the second was, “In your country, how do you characterize corporate activity?” Unsurprisingly, these two measures are closely correlated.
Income
capita may be larger in developing economies, the same economies with the higher instances of missing GNI per capita data, but also the same economies which are the focus of this model.
Countries were grouped into four development classes: low income, lower-middle income, upper-middle income, and high income. Low income is defined as a GNI per capita less than $1006. Lower-middle income is defined as a GNI per capita between $1006 and $3955.
Upper-middle income is defined as a GNI per capita between $3956 and $12235. High income is defined as a GNI per capita above $12235.
There is a question of reverse-causality when using GDP per capita in regressions, as it may be argued that the level of IPR protection is a driver of GDP per capita. To address this
question, the distance from the equator was used instead of GDP per capita in some regressions. Acemoglu et al. (2001) and Rodrik et al (2004), among others, have used this measure as well as a measure of European settler deaths in trying to determine current levels of GDP per capita. Both appear to be closely tied to current levels of GDP per capita through other institutions, including legal origins and colonizing power. These measures were used in regressions on average levels of protection prior to 1990.
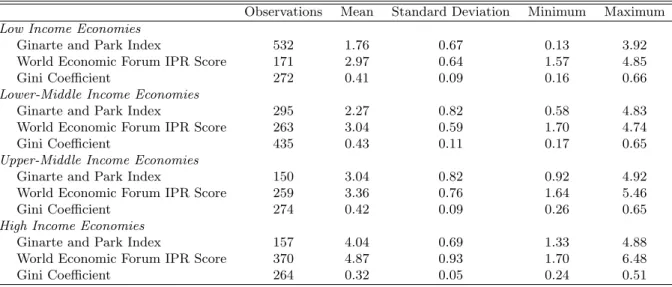
2.3.2 Descriptive Statistics
Descriptive statistics for the variables used in regressions can be seen in Tables 2.7-2.9. Observations are country-year.
Income distribution was quite similar across development groups, with high income economies demonstrating slightly more equal income distribution than the rest of the
development groups. Formal IPR protection is quite similar for the middle two income groups, notably lower in the lowest income group, and notably higher in the highest income group. De facto IPR protection appears to increase as income increases. In each development group, at least a few countries had higher de facto protection than formal protection, but most had higher formal protection than de facto protection. This tendency to have formal protection in excess of de facto protection increases, predictably, in formal protection. Despite this, formal and de facto
protection are quite positively correlated.
Income distribution is slightly lower for autocracies, but fairly similar across other
Table 2.7: Descriptive Statistics by Income Classification
Observations Mean Standard Deviation Minimum Maximum Low Income Economies
Ginarte and Park Index 532 1.76 0.67 0.13 3.92
World Economic Forum IPR Score 171 2.97 0.64 1.57 4.85
Gini Coefficient 272 0.41 0.09 0.16 0.66
Lower-Middle Income Economies
Ginarte and Park Index 295 2.27 0.82 0.58 4.83
World Economic Forum IPR Score 263 3.04 0.59 1.70 4.74
Gini Coefficient 435 0.43 0.11 0.17 0.65
Upper-Middle Income Economies
Ginarte and Park Index 150 3.04 0.82 0.92 4.92
World Economic Forum IPR Score 259 3.36 0.76 1.64 5.46
Gini Coefficient 274 0.42 0.09 0.26 0.65
High Income Economies
Ginarte and Park Index 157 4.04 0.69 1.33 4.88
World Economic Forum IPR Score 370 4.87 0.93 1.70 6.48
Gini Coefficient 264 0.32 0.05 0.24 0.51
Table 2.8: Descriptive Statistics by Government Type
Observations Mean Standard Deviation Minimum Maximum Autocracy
Ginarte and Park Index 320 1.67 0.64 0.13 4.83
World Economic Forum IPR Score 101 3.98 0.94 1.96 5.98
Gini Coefficient 101 0.36 0.09 0.16 0.61
Closed Anocracy
Ginarte and Park Index 163 2.01 0.81 0.20 4.83
World Economic Forum IPR Score 132 3.37 1.05 1.57 6.28
Gini Coefficient 98 0.41 0.09 0.23 0.61
Open Anocracy
Ginarte and Park Index 108 2.15 0.81 0.20 3.76
World Economic Forum IPR Score 110 2.86 0.63 1.63 5.20
Gini Coefficient 128 0.41 0.08 0.24 0.60
Democracy
Ginarte and Park Index 535 2.90 1.11 0.13 4.92
World Economic Forum IPR Score 670 3.89 1.17 1.70 6.48
Gini Coefficient 856 0.40 0.10 0.22 0.66
but de facto protection is similar. However, de facto protection and formal protection move in opposite directions for the mixed government types. As with the development groups, at least a few countries had higher de facto protection than formal protection, but most had higher formal protection than de facto protection.
Table 2.9: Descriptive Statistics before and after TRIPS
Observations Mean Standard Deviation Minimum Maximum Before TRIPS
Ginarte and Park Index 737 1.85 0.80 0.13 4.92
World Economic Forum IPR Score N/A
Gini Coefficient 201 0.42 0.12 0.19 0.63
After TRIPS
Ginarte and Park Index 122 3.35 0.87 0.20 4.88
World Economic Forum IPR Score 1067 3.74 1.14 1.57 6.48
Gini Coefficient 578 0.38 0.09 0.24 0.65
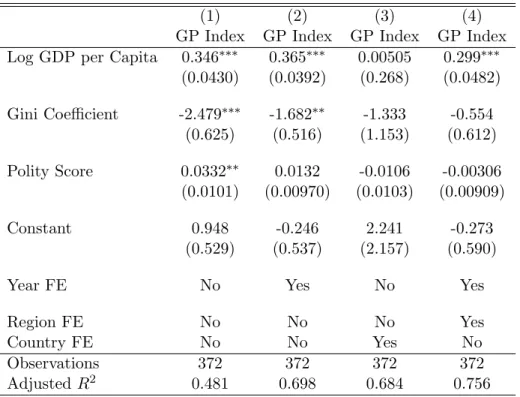
2.3.3 Results
Regressions were run on formal protection (the GP Index) and de facto protection (the WEF IPR score). Standard errors have been clustered by country. In all regressions, income, as
measured by GDP per capita, seemed to be the most important determinant of IPR protection. However, it is possible that the GDP per capita is absorbing some of the explanatory power of the shape of the distribution of income, as measured by the Gini coefficient. Finally, there are
potential endogeneity and reverse causality issues with GDP per capita. To address this, distance from the equator is used instead of GDP per capita in one set of regressions.
Table 2.10: Regressions on Formal IPR Protection
(1) (2) (3) (4)
GP Index GP Index GP Index GP Index Log GDP per Capita 0.346∗∗∗ 0.365∗∗∗ 0.00505 0.299∗∗∗
(0.0430) (0.0392) (0.268) (0.0482) Gini Coefficient -2.479∗∗∗ -1.682∗∗ -1.333 -0.554
(0.625) (0.516) (1.153) (0.612) Polity Score 0.0332∗∗ 0.0132 -0.0106 -0.00306
(0.0101) (0.00970) (0.0103) (0.00909)
Constant 0.948 -0.246 2.241 -0.273
(0.529) (0.537) (2.157) (0.590)
Year FE No Yes No Yes
Region FE No No No Yes
Country FE No No Yes No
Observations 372 372 372 372
AdjustedR2 0.481 0.698 0.684 0.756
Standard errors in parentheses
∗
p <0.05,∗∗ p <0.01,∗∗∗ p <0.001
Table 2.11: Regressions on De Facto IPR Protection
(1) (2) (3) (4)
WEF IPR WEF IPR WEF IPR WEF IPR Log GDP per Capita 0.603∗∗∗ 0.606∗∗∗ 1.650∗∗∗ 0.781∗∗∗
(0.0563) (0.0566) (0.270) (0.0635)
Gini Coefficient -0.472 -0.549 0.854 -0.766
(0.811) (0.821) (1.298) (1.135)
Polity Score -0.0160 -0.0157 -0.0150 -0.00714
(0.0164) (0.0165) (0.0237) (0.0176) Constant -1.262∗ -1.368∗ -10.83∗∗∗ -2.580∗∗∗ (0.594) (0.600) (2.492) (0.666)
Year FE No Yes No Yes
Region FE No No No Yes
Country FE No No Yes No
Observations 721 721 721 721
AdjustedR2 0.584 0.587 0.286 0.693
Standard errors in parentheses
∗
The negative coefficient on the Gini coefficient indicates that as countries become relatively less equal, IPR protection decreases. This is consistent with the incentives described by the application of the Weibull distribution.
In both cases, the Polity measure does not seem to play a very important role, though again it is possible that GDP per capita and/or the region indicator is absorbing some of the
explanatory power of this as well. It also suggests that although government preferences are important, the style of government does not do a great job of elucidating these preferences.
It should be noted that the year and region are often significant. The former supports the conclusion that as time has progressed, international pressure to increase protection has become increasingly important in understanding why protection has risen and suggests that the model may be better at explaining differences between countries than changes over time. The second supports the conclusion that there are regionally-similar institutions that help to explain differences in protection, perhaps better than the style of government, and that other
considerations, such as regional trading agreements, might have an impact on the choice of level of protection.
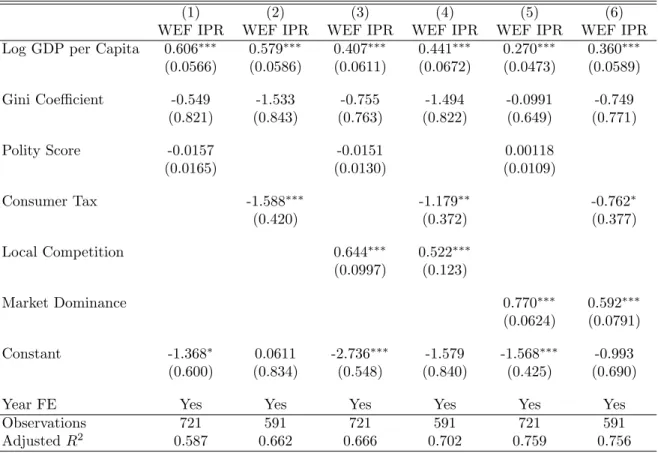
The second set of regressions on the de facto measure of IPR (Table 2.12) introduces the alternative conception of institutions and measures of market structure. Since this data is not available prior to 2006, these regressions cannot be run on the GP Index. Using this data
constitutes a different interpretation of institutions, one in which the government’s preference for actors is dependent upon the revenue they generate rather than the influence they hold. In this case, the tax on consumers is used to represent a preference for consumers, as traded off with a preference for firms, both domestic and foreign. This variable was derived by taking the income from taxes on consumers divided by the sum of the incomes from consumers and producers. An increase in the tax on consumers is analogous to increasing weight placed on the consumers, as it means that a greater portion of the government revenue is derived from consumers. The negative coefficient suggests that as the weight on consumers increases, the level of protection decreases, which is consistent with the model.
Table 2.12: Regressions on De Facto IPR Protection
(1) (2) (3) (4) (5) (6) WEF IPR WEF IPR WEF IPR WEF IPR WEF IPR WEF IPR Log GDP per Capita 0.606∗∗∗ 0.579∗∗∗ 0.407∗∗∗ 0.441∗∗∗ 0.270∗∗∗ 0.360∗∗∗
(0.0566) (0.0586) (0.0611) (0.0672) (0.0473) (0.0589)
Gini Coefficient -0.549 -1.533 -0.755 -1.494 -0.0991 -0.749 (0.821) (0.843) (0.763) (0.822) (0.649) (0.771)
Polity Score -0.0157 -0.0151 0.00118 (0.0165) (0.0130) (0.0109)
Consumer Tax -1.588∗∗∗ -1.179∗∗ -0.762∗ (0.420) (0.372) (0.377)
Local Competition 0.644∗∗∗ 0.522∗∗∗ (0.0997) (0.123)
Market Dominance 0.770∗∗∗ 0.592∗∗∗ (0.0624) (0.0791)
Constant -1.368∗ 0.0611 -2.736∗∗∗ -1.579 -1.568∗∗∗ -0.993 (0.600) (0.834) (0.548) (0.840) (0.425) (0.690)
Year FE Yes Yes Yes Yes Yes Yes
Observations 721 591 721 591 721 591 AdjustedR2 0.587 0.662 0.666 0.702 0.759 0.756
Standard errors in parentheses
∗
p <0.05,∗∗ p <0.01,∗∗∗p <0.001
described by a single domestic firm toward one described by a competitive domestic fringe. The positive coefficient suggests that protection is higher in the case of a competitive domestic fringe. However, it is possible that including developed economies in these regressions has obscured somewhat the impact of market structure. These regressions can be found in Table 2.12. Regressions run just on developing countries are included in Appendix B.
Finally, alternatives to GDP per capita were used to try to explain average formal protection between 1960 and 1990. Distance to the equator was used instead of GDP per capita. Polity IV, regions, identity of the colonial power, and legal origins were used to describe institutions.
Table 2.13: Regressions on Formal IPR Protection
(1) (2) (3) (4) (5)
GP Index GP Index GP Index GP Index GP Index Distance to Equator 0.000810∗∗∗ 0.00198∗∗∗ 0.00152∗∗∗ 0.00234∗∗∗ 0.00223∗∗∗ (0.000187) (0.000237) (0.000263) (0.000232) (0.000273) Gini Coefficient -0.00135∗∗∗ -0.00128∗∗∗ 0.00157∗∗∗ -0.00141∗∗∗ 0.00000664 (0.000273) (0.000225) (0.000304) (0.000314) (0.000294) Polity Score 0.00635∗∗∗ 0.00967∗∗∗ 0.0108∗∗∗ 0.00411∗∗∗ 0.00975∗∗∗ (0.000627) (0.000625) (0.000692) (0.000536) (0.000729) Constant 0.355∗∗∗ 0.329∗∗∗ 0.212∗∗∗ 0.410∗∗∗ 0.275∗∗∗
(0.0130) (0.0125) (0.0191) (0.0142) (0.0198)
Region FE No Yes No No Yes
Colonial FE No No Yes No Yes
Legal FE No No No Yes Yes
Observations 2100 2100 2100 2001 2001
AdjustedR2 0.103 0.457 0.249 0.281 0.583
Standard errors in parentheses
∗

![Table 2.5: Weibull Distribution with Competitive Domestic Fringe Variables Responses to Changing Parameters ˆ x = λ(x) = b c 1c ∂ ˆx∂c = bc −1c −2 (ln c − 1) < 0 ∂ ˆx ∂b = ( 1 c ) 1 c > 0 x L = 0 1 − H(ˆ x) = exp[− 1 c ] ∂(1−H(ˆ∂c x)) = c 1 2 exp[ −1](https://thumb-us.123doks.com/thumbv2/123dok_us/8232966.2182455/32.918.208.712.248.670/weibull-distribution-competitive-domestic-variables-responses-changing-parameters.webp)