i
METABOLOMIC STUDIES OF SALIVA IN GINGIVITIS AND PERIODONTITIS
Alison M. McGuire
A thesis submitted to the faculty at the University of North Carolina at Chapel Hill in partial fulfillment of the requirements for the degree of Master of Science in the School of Dentistry
(Periodontology).
Chapel Hill 2014
iii ABSTRACT
Alison M. McGuire: Metabolomic Studies of Saliva in Gingivitis and Periodontitis (Under the direction of Steven Offenbacher)
The aim of this study was to conduct metabolomic analysis of saliva during 3-week induction and 4-week resolution of stent-induced, biofilm overgrowth (SIBO) in humans to elucidate an association between changes in clinical disease and the salivary metabolome.
Five periodontal disease classifications were developed using probing depths and bleeding on probing. SIBO was induced in 50 subjects for 21 days followed by oral hygiene instruction for 28 days. Clinical indices and unstimulated saliva were collected weekly during induction and biweekly during resolution. Samples were analyzed using metabolomic profiling (liquid and gas chromatography mass spectrometry, Metabolon Inc).
SIBO was associated with marked, but reversible, increases in clinical indices. 281 metabolites were identified using metabolomic profiling. Eight metabolites demonstrated
significant changes including seven in the amino acid super-pathway (threonine, N-acetylserine, serine, 5-oxoproline, histidine, glutamate and erythronate).
iv
v
ACKNOWLEDGEMENTS
vi
TABLE OF CONTENTS
LIST OF TABLES………...viii
LIST OF FIGURES…….……….…..ix
LIST OF ABBREVIATIONS…….………..………...x
CHAPTER 1: INTRODUCTION…….………..……….………1
CHAPTER 2: LITERATURE REVIEW…….………..………..………4
Section 2.1: Oral fluids…….……….………..………4
Section 2.2: Advancements in molecular biology technologies……..……..……..……....5
Section 2.3: Metabolomics…….………..………5
Overview…….………..………...……5
Metabolomic profiling: Technology…….………..……….…6
Metabolomic profiling: Developing metabolomic signatures in GCF…………....7
Metabolomic profiling: Developing metabolomic signatures in saliva…………...9
CHAPTER 3: MANUSCRIPT…….………..………...…10
Section 3.1: Introduction…….………..……….……10
Section 3.2: Materials and methods…….………..……….…...12
Clinical study design and patient enrollment…….………12
Patient protocol and procedures…….………..………..13
Examiner training and calibration…….………..…………...15
Analysis of the salivary metabolome…….………..………..16
vii
Section 3.3: Results…….………..……….17
Study implementation…….………..……….17
Changes in clinical signs during induction and resolution of experimental SIBO…………..……….18
Changes in metabolome during induction and resolution of experimental SIBO…….………….……….19
Changes in clinical indices that co-vary with changes in metabolites…….……….……….22
Section 3.4: Discussion…….………..………...23
Section 3.5: Conclusion…….………..………..30
APPENDIX 3.1.1 – EXTENDED DETAILS OF METHODS…….………51
Analysis of the salivary metabolome…….………..………..51
LC/MS…….………..………51
GC/MS…….………..………52
Accurate mass determination and MS/MS fragmentation (LC/MS), (LC/MS/MS)……..52
Compound identification…….………..………53
Data normalization…….………..………..53
Quality control…….………..………53
APPENDIX 3.1.2 - INSTRUMENT AND PROCESS VARIABILITY…….……….55
APPENDIX 3.2 – MEAN METABOLITE LEVELS DURING INDUCTION AND RESOLUTION OF EXPERIMENTAL SIBO BY BGI CATEGORY …….………..……….56
APPENDIX 3.3. CHANGES IN METABOLITES THAT CO-VARY WITH CHANGES IN CLINICAL INDICES AT PEAK OF INDUCTION BY BGI CATEGORY………60
viii
LIST OF TABLES
Table 1.1 – Demographics by BGI Category………...………..31 Table 1.2 – Baseline clinical indices by BGI Category………...…………..32 Table 2.1 – Mean clinical changes during induction and resolution of experimental SIBO…...33 Table 2.2 – Mean clinical changes during induction and resolution of
experimental SIBO by BGI category……….34 Table 3.1 – Mean metabolite levels during induction and resolution of experimental SIBO…...35 Table 3.2 – Top five mean metabolite levels during induction of experimental SIBO by BGI
category………..36 Table 3.3 – Top five mean metabolite levels during resolution of experimental SIBO by BGI
category………..37 Table 3.4 – Summary of changes of metabolites from biochemical
pathways altered by experimental SIBO………38 Table 4.1 – Mean changes in metabolites that co-vary with changes in
ix
LIST OF FIGURES
Figure 1 – Flow of patient recruitment………..……42 Figure 2.1 – Mean plaque index during induction and resolution of experimental SIBO….……43 Figure 2.2 – Mean gingival index during induction and resolution of experimental SIBO..……44 Figure 2.3 – Extent bleeding on probing during induction and
resolution of experimental SIBO………...…45 Figure 2.4 – Mean probing depth during induction and resolution of experimental SIBO……...46 Figure 2.5 – Mean clinical attachment level during induction and
x
LIST OF ABBREVIATIONS
ADP Adenosine diphosphate
ATP Adenosine triphosphate BCAA Branch-chain amino acids
BD-2 Beta-defensin 2
BGI Biofilm-gingival interface BGI-G BGI-gingivitis
BGI-H BGI-healthy
BGI-P1 BGI-periodontitis 1 BGI-P2 BGI-periodontitis 2 BGI-P3 BGI-periodontitis 3
BMI Body mass index
BOP Bleeding on probing
CAL Clinical attachment level CSF3 Colony stimulating factor 3
ENA-78 Epithelial-derived neutrophil-activating peptide-78 FDR False discovery rates
GC/MS Gas chromatography mass spectrometry GCF Gingival crevicular fluid
GI Gingival index
IL Interleukin
xi
MCP-1 Monocyte chemoattractant protein-1 MIP-1β Macrophage inflammatory protein-1β MMP Matrix metalloproteinase
MS Mass spectrometry
NADH Nicotinamide adenine dinucleotide
NADPH Nicotinamide adenine dinucleotide phosphate NHANES National Health and Nutrition Examination Survey
PD Probing depth
PI Plaque index
RANTES Regulated on activation, normal T cell expressed and secreted RSD Relative standard deviation
SIBO Stent-induced, biofilm overgrowth SOD2 Superoxide dismutase2
UNC University of North Carolina
1
CHAPTER 1: INTRODUCTION
Periodontal disease is a heterogeneous group of inflammatory conditions that affect tooth-supporting tissues and is broadly grouped into two major categories: gingivitis and periodontitis. Gingivitis is reversible and limited to superficial gingival tissues; periodontitis is non-reversible and features tissue destruction extending into the periodontal ligament and
alveolar bone. Animal studies indicate that gingivitis is a precursor to periodontitis (Heijl, Rifkin, & Zander, 1976), however, human population studies have clearly shown that not all individuals with gingivitis linearly proceed to periodontitis (Löe, Anerud, Boysen, & Morrison, 1986; Socransky, Haffajee, Goodson, & Lindhe, 1984).
Estimations from NHANES III data suggest that approximately half (47.2%) of the US population has periodontal disease (Eke et al., 2012). Underestimations in previously reported periodontal disease prevalence may be due to inconsistent definitions of periodontal disease. For example, applying a threshold of 1mm CAL results in a prevalence of 99% while applying a threshold of greater than 7 mm CAL results in a prevalence of 7% (Albandar, Brunelle, & Kingman, 1999). Furthermore, use of partial mouth examinations such as the Ramfjord’s Periodontal Disease Index (Ramfjord, 1967) may have led to underestimations in NHANES survey studies by 50% (Albandar, 2011).
2
attention of the medical field which has resulted in translational interdisciplinary research opportunities between medicine and dentistry (Williams & Offenbacher, 2000).
Periodontal disease is a multifactorial disease that is associated with several risk and susceptibility factors (Page & Kornman, 1997). Bacterial biofilm has historically been cited as the primary etiological factor for periodontal disease (Löe, Theilade, & Jensen, 1965), however, the amount of plaque does not necessarily correlate with periodontal disease severity
(Offenbacher, 1996). Data from cohort studies indicate that a subset of individuals appear to exhibit a more pronounced host response to bacterial biofilm as compared to others who fail to respond (Offenbacher, Collins, & Arnold, 1993). Trombelli et al. (2004) first identified “high responders” and “low responders” in a randomized, split-mouth, localized experimental gingivitis model (Trombelli et al., 2004). These two groups were defined by upper and lower quartiles of GCF volume. During experimental gingivitis, “high responders“ demonstrated a statistically significant increase in GI, angulated bleeding score, and GCF volume but not plaque index and cumulative plaque exposure when compared to “low responders”. Evidence of this phenomenon was first published almost 50 years ago by Löe et al. (1965) in his classic
experimental gingivitis study (Löe et al., 1965). Subjects refrained from daily tooth cleaning for three weeks to induce gingivitis. Using a clinical index (GI), three subjects developed gingivitis within 10 days (“high responders”) whereas nine subjects developed gingivitis between 15-21 days (“low responders”). Differences in host susceptibility to gingivitis and periodontal disease may be traced to inter-individual differences in environmental exposures or genetic risk factors. In fact, genetic risk factors have been shown to account for approximately 50% of
3
with certain genetic biomarkers or polymorphisms (interleukin-1β) however the risk conferred by these markers are not consistent among different populations (Kinane & Hart, 2003). In fact, Papapanou et al. (2004) conducted a pilot study evaluating gene expression signatures in gingival tissues obtained from two subsets of periodontal disease patients: chronic and aggressive. This group concluded that gene expression techniques may be useful in the identification of different subclasses of periodontal diseases and better allow clinicians to distinguish health from disease (Papapanou et al., 2004). Collectively, these studies provide evidence for the potential utility of biochemical mediators for periodontal diagnosis.
4
CHAPTER 2: LITERATURE REVIEW Section 2.1: Oral fluids
5
abovementioned chemokines, which are chemotactic for leukocytes, suggests that experimental gingivitis induces a transient, but reversible suppression of chemotaxis. This study identified IL-1β, IL-1α, and select MMP’s and chemokines as potential candidate biomarkers for gingivitis induction within the GCF.
Section 2.2: Advancements in molecular biology technologies
Due to advancements in molecular biology and, in particular, high-throughput
technologies, systems biology has emerged in the last decade to evaluate biological systems at the level of the genome, transcriptome, proteome, glycome, metabolome, and lipidome which have been termed genomics, transcriptomics, proteomics, glycomics, metabolomics, and lipidomics respectively (Wu, Zhao, Wang, Zhou, & Chen, 2011). Gingival transcriptome patterns during induction and resolution of experimental gingivitis were described by
Offenbacher et al. (2009) using the SIBO model (Offenbacher et al., 2009). Briefly, gingival biopsy samples were collected from 14 subjects at different sites within each subject at baseline (Day 0), peak of gingivitis (Day 28), and resolution (Day 35) and processed using
whole-transcriptome gene-expression arrays. During induction, there was a significant transient increase in expression levels of transcripts that code for inflammatory cytokines including in 1β, IL-1α, IL-8, RANTES, CSF3, and SOD2 and a decreased expression of IL-10, ITAC, MMP-10, and BD-2.
Section 2.3: Metabolomics Overview
6
agents (Lawton et al., 2008; Ryals, Lawton, Stevens, & Milburn, 2007). The goal of
metabolomics is to characterize the metabolic state of a subject via extraction, identification, and quantification of all small molecule compounds from a biological sample (Ryals et al., 2007). There are advantages of metabolomics over other technologies such as functional genomics, transcriptomics, and proteomics. For example, metabolomics provides a biochemical signature that includes the effects of genetics, lifestyle, diet, and environmental factors in an individual (Ryals et al., 2007). To date, blood, urine, gingival crevicular fluid, saliva, amniotic fluid, cerebrospinal fluid, tissues, cell cultures, and plants have been analyzed by metabolomic profiling (Ryals et al., 2007). This is a rapidly evolving technology that has been used
increasingly in drug development and diagnosis of systemic disease (Lawton et al., 2008; Morris & Watkins, 2005). For example, this technology has been applied to cardiovascular disease and diabetes research (Dunn, Goodacre, Neyses, & Mamas, 2011). It has also been used to
investigate diagnostic markers for psychological diseases such as depression (Paige, 2007). Analysis of biological metabolites for disease diagnosis and monitoring of disease status is not novel. For example, blood glucose and cholesterol levels have been used for decades in the diagnosis and disease monitoring for diabetes and heart disease respectively. However,
advancements in technology have allowed for analysis of a much wider variety of metabolites in a given sample (Lawton et al., 2008).
Metabolomic profiling: Technology
7
profiling provides a relative concentration of a large number of small molecules, known and unknown, in a biological sample that permits a broader examination of metabolism (Sha et al., 2010). Both non-targeted and targeted analyses apply LC/MS and GC/MS. Briefly, metabolites extracted from a sample are identified by matching the ion’s chromatographic retention index and mass spectral fragmentation signatures with a reference library. For molecules not found in the reference library, new library entries are added (Barnes et al., 2009). Quality control is essential for several reasons. First, metabolites in biological systems are found in widely varying concentrations with different molecular size, functional moieties, lipophilicity, volatility, or other physicochemical parameters from which they must be extracted while maintaining their
structural integrity and relative abundances (Fiehn et al., 2008). Secondly, some compounds, such as ATP, ADP, NADH and NADPH are susceptible to oxygen degradation during sample preparation. Other compounds, such as sugar phosphates, cysteine and ascorbate are prone to degradation by residual enzymatic activity, heat and oxidation (Fiehn et al., 2008). To overcome these challenges, quality control samples, including internal standards and endogenous
biochemicals, are analyzed alone and in conjunction with the samples to measure variation between experiments (Lawton et al., 2008). Some variation is acceptable and is due to deviation in sample processing, instrument or data processing (Dunn, Wilson, Nicholls, & Broadhurst, 2012). Extended details of methods are included in Appendix 3.1.1.
Metabolomic profiling: Developing metabolomic signatures in GCF
8
would allow for the development of diagnostic tests. Barnes et al. (2009) applied metabolomic profiling to GCF samples collected from healthy, gingivitis, and periodontitis sites in humans via LC/MS and GC/MS and identified metabolomic signatures associated with host-bacterial
interactions (Barnes et al., 2009). Of the 228 metabolites detected, 53 metabolites (23%) demonstrated significant differences between subjects with gingival health, gingivitis, and periodontitis defined as sites with PD≤3mm, absent BOP; PD≤3mm, BOP present; and
PD≥5mm, BOP present, respectively after correcting for multiple comparisons (FDR, q < 0.05). Most metabolites with altered concentrations at gingivitis sites demonstrated intermediate levels between health and periodontitis, which suggests that metabolomic changes are on a continuum. Inosine, hypoxanthine, xanthine, guanosine, and guanine were upregulated at the disease sites which indicated accelerated metabolic flux of the purine degradation pathway. In accordance with these changes, oxygen levels were depleted and reactive oxygen species were elevated by xanthine oxidase. Levels of anti-oxidants including reduced and oxidized glutathione, ascorbic acid, and uric acid were reduced. These findings suggested an acceleration of reactive oxygen species that have been shown to be involved in the pathogenesis of other diseases such as cardiovascular disease, ischemic-reperfusion injury, diabetes, hypertension and inflammatory disease (Ren, Zhang, Cui, & Mu, 2013). Levels of putrescine and cadaverine, which are the end-products of amino acid degradation, were also upregulated by disease. The authors suggested that host tissues upregulate the purine degradation pathway as a defense mechanism against oxidant-sensitive bacterial pathogens (Barnes et al., 2009; Stevens et al., 2000). In a follow-up study, Barnes et al. (2010) evaluated the effect of triclosan-containing dentifrice on the
9
lycine, putrescine, and xanthine as early as one week after implementing the triclosan-containing dentifrice (Barnes, 2010).
Metabolomic profiling: Developing metabolomic signatures in saliva
These mediators are detectable in saliva, albeit at a much lower concentration, which opens the possibility for a salivary diagnostic to monitor periodontal status. Barnes et al. (2011) conducted a study evaluating salivary metabolites in human subjects with periodontal health and periodontitis. A total of 68 unstimulated saliva samples were collected from 34 periodontally healthy and 34 periodontitis subjects. Of the 390 metabolites that were detected, seven
metabolites demonstrated significant differences between subjects with periodontal health and periodontitis (FDR, q<0.05). Five of the seven metabolites were derived from four different superfamilies (leucylisoleucine from the dipeptide superfamily, mannose and glucose from the carbohydrate superfamily, arachidonate from the lipid superfamily, and allantoin from the
nucleotide superfamily) while two were previously unnamed. Metabolites from several pathways demonstrated trending changes (t-test, p<0.05) including elevated mono- and oligosaccharides, dipeptides, products of glycerophopholipid and triacylglycerol degradation including fatty acids arachidonate and docosapentaenoate, and nucleotides. This publication was the first to report on metabolomic profiling of saliva and suggested that a number of different metabolites could be investigated as candidate biomarkers for a salivary diagnostic tool. Integrating metabolomic profiles of the GCF and saliva may provide a comprehensive biochemical basis for
10
CHAPTER 3: MANUSCRIPT Section 3.1: Introduction
Human saliva contains salivary gland secretions but also variable amounts of bronchial and nasal secretions, gingival epithelial cells, food debris, and GCF products; including serum transudate, microbial, and host products (Kaufman & Lamster, 2002; Offenbacher et al., 2010). In the last decade, the application of systems biology has been used to evaluate biological systems at the level of the genome, transcriptome, proteome, glycome, metabolome, and lipidome (Wu, Zhao, Wang, Zhou, & Chen, 2011). Recently, the application of whole-transcriptome gene-expression arrays has been used to characterize gingival whole-transcriptome patterns in gingival tissue (using gingival biopsies) during induction and resolution of
experimental gingivitis using the SIBO model (Offenbacher et al., 2009). During induction, a significant transient increase in expression levels of transcripts that code for inflammatory cytokines including in IL-1β, IL-1α, IL-8, RANTES, CSF3, and SOD2 and a decreased expression of IL-10, ITAC, MMP-10, and BD-2 was noted. For ease of collection, these technologies have been applied to GCF and saliva.
11
significant differences between subjects with gingival health, gingivitis, and periodontitis. This study showed accelerated metabolic flux of the purine degradation pathway, depletion of oxygen levels, elevated reactive oxygen species and reduced levels of anti-oxidants (Barnes et al., 2009). Additionally, metabolites from the amino acid super-family were increased while metabolites from the glutathione pathway were reduced (Barnes et al., 2009). In the first publication to report on metabolomic profiling of saliva, Barnes et al. (2011) applied metabolomics to saliva samples collected from human subjects with periodontal health and periodontitis. Among the 390
metabolites detected, 0.02% demonstrated significant differences between subjects with periodontal health and periodontitis. The data indicated changes in biochemicals from several different pathways including dipeptides, carbohydrates, lipids and nucleotides which suggested that a number of different metabolites could be investigated as candidate biomarkers for a
salivary diagnostic tool (Barnes et al., 2011). The experimental gingivitis model has been applied many times since it was first introduced in the landmark study by Löe et al. (Löe et al., 1965). This model has been adapted to include the use of intra-oral stents to be worn only during routine oral hygiene measures that cover selected teeth (Burrell & Walters, 2008) to limit the extent of gingival inflammation to selected posterior regions of the mouth. In this study, we applied the SIBO model in conjunction with metabolomic profiling from human saliva samples to elucidate the association between clinical disease status and the salivary metabolome. This was a
12 Section 3.2: Materials and Methods
Clinical study design and patient enrollment
This study design represents a modification of the original experimental gingivitis study as described by Löe et al.(Löe et al., 1965). We recruited and enrolled subjects who were systemically healthy with periodontal diagnoses of health, gingivitis, mild, moderate or severe periodontitis in this study conducted at the UNC Center for Oral and Systemic Diseases. The study design included a 2-week hygiene phase, a 3-week induction phase using two stents and a 4-week resolution phase to reinstitute oral hygiene and reverse gingival inflammation. The protocol and informed consent were approved by the Institutional Review Board at UNC Chapel Hill. 175 subjects (115 females and 60 males; aged 19-68 years) were enrolled in the study and 163 subjects completed the experimental protocol between July 2009 and October 2010. The subjects included in this study are a subset of a larger study; the data collected from all 163 subjects were analyzed elsewhere. Samples were analyzed for a total of 50 subjects (33 females and 17 males; 19-53 years); subjects were randomized by each BGI strata to a total of 10 subjects per stratum. Eligibility criteria included: adult male or females; age range: 18 to 75 years; good general health; ≥8 teeth in a functional dentition with a minimum of 3 adjacent teeth with interproximal papilla in each posterior sextant; that may be classified into one of the
13
treatment (i.e., two weeks or more) with any medication known to affect periodontal status (e.g., phenytoin, calcium antagonists, cyclosporin, anticoagulants, non-steroidal anti-inflammatory drugs, high dose aspirin such as >100mg per day) within one month prior to the study; (5) ongoing medications initiated less than three months prior to enrollment (i.e., medications for chronic medical conditions must be initiated at least three months prior to enrollment); (6) participants with clinically significant organ disease including impaired renal function, and/or any bleeding disorder; (7) severe unrestored caries, or any condition that is likely to require antibiotic treatment during the study, including the need for prophylactic antibiotic; (8) individuals who use any tobacco products or who have used tobacco products within the previous six months of the study; (9) individuals who are pregnant, or expect to become
pregnant, within the next three months and individuals nursing. Participants were excluded from the study or analysis if any of the following conditions occurred: (1) changes in the participant's medical status or medications; (2) use of any antibacterial rinses; (3) use of non-study
dentifrices, toothbrushes or dental floss during the no-hygiene and resolution phases of the study; (4) use of irrigating devices or other interdental aids; (5) participant’s inability or noncompliance to wear their stents or shields over the selected no-hygiene sextants during daily brushing
procedures; (6) use of oral antibiotics and non-steroidal anti-inflammatory drugs during the trial. Acute use of oral acetaminophen was permitted. Participants requiring treatment for an acute medical or dental condition during the study were withdrawn from the trial.
Patient protocol and procedures
14
impressions were made for stent fabrication. Full mouth-examination included oral cancer screening, GI (Löe & Silness, 1963), PI (Silness & Löe, 1964), PD, CAL and BOP scores (yes/no) at each of six sites per tooth. Customized stents were fabricated for each subject to encourage participant compliance during daily brushing procedures. Stents resembled an acrylic occlusal guard but extended to cover approximately 2 mm over gingival margins. Stents formed a seal and rested on the gingiva, but were relieved on the tooth and tissue side except for occlusal surfaces to avoid disturbing plaque or gingival tissues. Within two weeks at visit 2 (Day -14) the exam was repeated and biological samples were collected: 3 mL of whole, unstimulated saliva was collected. At visit 2, standardized study products including fluoride dentifrice and a
toothbrush were dispensed and subjects were instructed on toothbrush technique. Following a 2-week hygiene phase, participants returned for the baseline (Day 0) visit. At this visit subjects were given two stents and instructions for use. From this point forward for a 3-week, no-hygiene phase, subjects abstained from all oral hygiene procedures in two posterior sextants via
15
instruction, both verbally and in writing, and advised to brush their entire dentition twice a day and continue to abstain from flossing during the 4-week resolution phase (Days 21-49). Subjects returned on Day 35 for repeated clinical exam and biological sampling of saliva. Subjects returned on Day 49 (four weeks after reinstating oral hygiene) for repeated clinical exam and biological sampling of saliva. Upon exit of the study, oral prophylaxis or scaling root planing was performed on all subjects to regain periodontal health. Day 21 represents the peak of gingival inflammation induction while Day 49 represents the peak of gingival inflammation resolution.
Saliva samples were collected from subjects on Day -14, 0, 7, 14, 21, 35 and 49. At each of these time points, approximately 3 mL of unstimulated saliva was collected into a 15 mL conical tube. Subjects refrained from eating, drinking, chewing gum, breath mints, etc., or performing oral hygiene procedures for at least one hour prior to saliva collection. This request was made after consenting for the first sample collection. Saliva was collected using a 15 mL polypropylene tube. The subject spit into the collection vessel but was instructed to avoid
coughing up mucus. During saliva collection, the collection vessel was kept at room temperature, centrifuged and aliquoted into three samples of 0.5 mL in each tube. Remaining saliva was aliquoted into a fourth tube and samples were stored at -80C.
Examiner training and calibration
16
were standardized on measurements of the PI, GI, PD, CAL and BOP. The three participating examiners were found to have an intra-class k coefficient of agreement between 0.94-0.98 for PD and between 0.77-0.97 for CAL measurements, as compared with the gold standard examiner. Clinical parameters were measured using a manual UNC-15 periodontal probe. For experimental SIBO measures, these parameters were measured at six sites per tooth for teeth within the two experimental SIBO sextants and for teeth in the other four sextants for control purposes. Examiners were masked to the subject’s BGI category.
Analysis of the salivary metabolome
Metabolomic analyses were conducted at Metabolon, Inc. (Durham, NC). Samples were subjected to both non-targeted and targeted analysis via LC/MS and GC/MS as described by Evans et al. (2012) (Evans, Mitchell, Dai, & DeHaven, 2012). Saliva samples were analyzed in duplicate from timepoints -14, 0, 7, 14, 21, 35 and 49 days for each subject. Results were reported as raw concentrations of metabolites for five groups (BGI-H, BGI-G, BGI-P1, BGI-P2, and BGI-P3) at seven time points (Day -14, 0, 7, 14, 21, 35 and 49) which provided data at baseline, induction and resolution. All laboratory analyses were performed masked from sample, visit or subject information. Extended details of methods are included in Appendix 3.1.1.
Statistical analysis
17
days 7–21 with baseline and days 35 and 49 with peak of induction (day 21). Statistical
significance is reported for p<0.05, p<0.001, and p<0.0001. Paired t-tests were used to compare mean metabolites at peak of induction with baseline and peak of resolution with peak of
induction. FDR was applied to correct for multiple comparisons and was reported as q-values. Since very few changes were statistically significant by FDR, unadjusted p-values were reported to demonstrate trending changes. Covariance matrices were applied to describe correlations between changes in metabolites and changes in clinical indices at peak of induction (Day 21). r values were reported with corresponding p-values and q-values determined by paired t-tests and FDR respectively.
Section 3.3: Results Study implementation
357 subjects were screened to reach the target enrollment. Subjects were recruited in two phases to provide interim data on disease states: (1) P1, P2, P3; (2) H, BGI-G. Participants were recruited by advertisement including email, flyers, internet postings and newspaper ads from the patient, student, and staff population at UNC Chapel Hill and the general population. 182 subjects did not meet the inclusion criteria and were excluded from the study. 175 subjects met the inclusion criteria, were enrolled in the study, and were classified by BGI category: BGI-H (36 subjects), BGI-G (34 subjects), BGI-P1 (33 subjects), BGI-P2 (37 subjects) and BGI-P3 (35 subjects). In the BGI-H category, two subjects dropped out due to medical conditions; in the G category, one subject dropped out due to time constraints; in the BGI-P1 category, one subject dropped out since she was not comfortable abstaining from oral
18
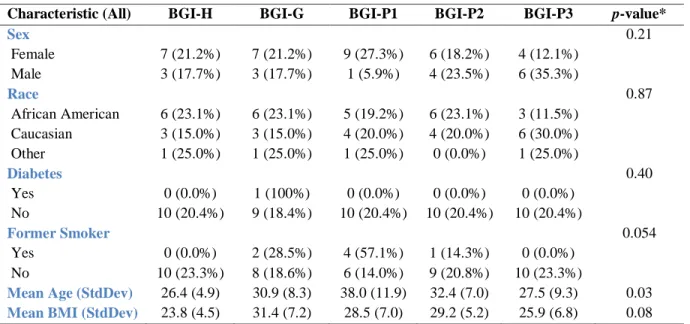
category, three subjects dropped out due to time constraints. 163 subjects completed the study in the following BGI categories: BGI-H (34 subjects), BGI-G (33 subjects), BGI-P1 (32 subjects), BGI-P2 (32 subjects) and BGI-P3 (32 subjects). Patient flow is illustrated in Figure 1. Samples were analyzed for a total of 50 subjects; subjects were randomized by each BGI strata to a total of 10 subjects per stratum. The mean age of the 50 subjects was 31.0 (standard deviation, 9.2), comprising 26 African Americans, 20 Caucasians, four other, 33 females and 17 males.
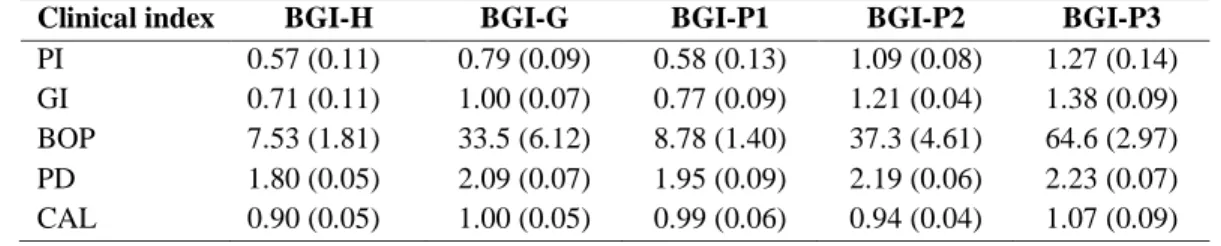
Demographic information is provided in Table 1.1. Among the demographic variables presented in Table 1.1, age, former smoking and BMI are potential biases. Baseline clinical indices by BGI category are provided in Table 1.2,
Changes in clinical signs during induction and resolution of experimental SIBO
19
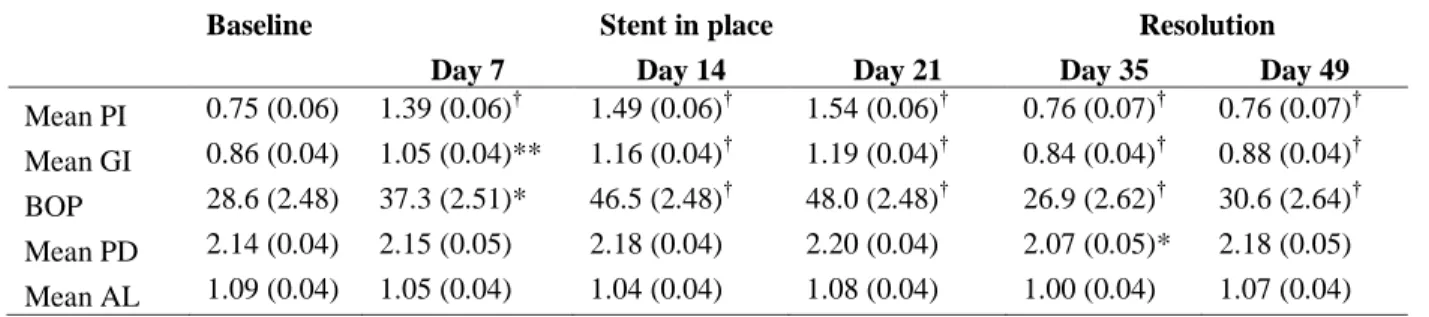
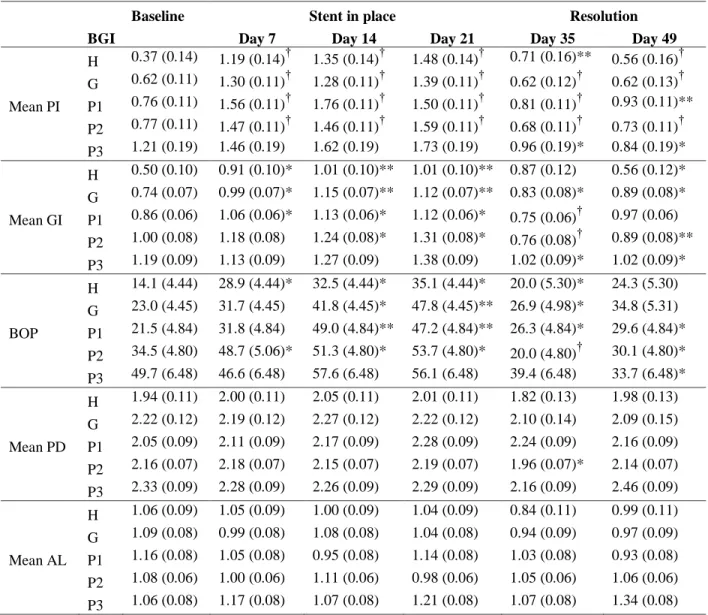
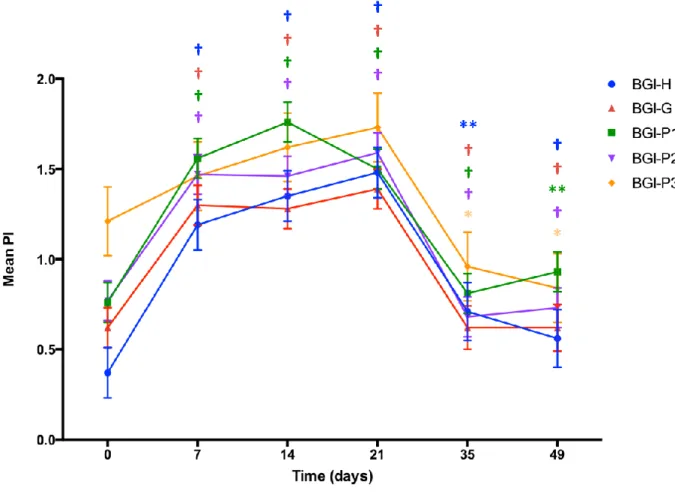
49 as compared with Day 21 and a return to baseline values (p < 0.05). A similar trend was seen for BOP which achieved statistical significance at Day 21 in each of the BGI categories with the exception of BGI-P3 (p < 0.05). PI, GI, BOP, PD and CAL trends are depicted in Figures 2.1-2.5. Slight changes in PD and CAL did not reach statistical significance. Thus, there was
induction of experimental SIBO under the stent that was fully and readily reversed by reinstating oral hygiene. None of the subjects required scaling root planing at Day 49.
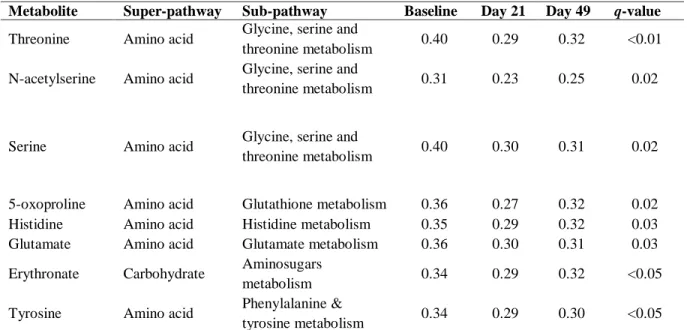
Changes in metabolome during induction and resolution of experimental SIBO 281 metabolites, that represent breakdown products of various super-pathways (carbohydrate, lipid, amino acid, xenobiotics, nucleotide, cofactors and vitamins) and sub-pathways, were quantified at each time point. At baseline, there were no significant differences in metabolite levels between BGI categories (FDR, q < 0.05). When mean metabolite levels were analyzed, without stratifying by BGI category, eight metabolites demonstrated significant
changes between baseline and peak of induction (Day 21) using FDR-adjusted p-values (q -values) (Table 3.1). Seven of these eight metabolites are in the amino acid super-pathway. No metabolites demonstrated significant changes between peak of induction (Day 21) and peak of resolution (Day 49) when applying FDR (data not reported).
When mean metabolite levels were stratified by BGI category, no metabolites
20
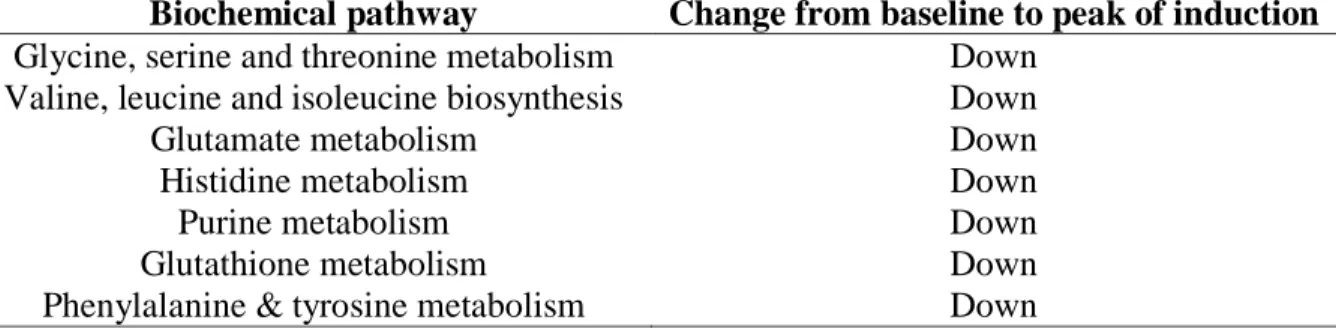
levels between peak of induction and peak of resolution. A summary of changes of metabolites from biochemical pathways altered by experimental SIBO is depicted in Table 3.4.
When generalized linear models and FDR were applied adjusting for age, BMI and former smoking, no changes in metabolites remained statistically significant (q < 0.05). It is possible that sample size was insufficient to capture significant changes when such rigorous statistical analyses were applied.
Mean levels of threonine, N-acetylserine, and serine from the glycine, serine and threonine metabolism sub-pathway decreased from baseline to peak of induction (Day 21) (q < 0.05). The glycine, serine and threonine metabolism sub-pathway is illustrated in Figure 4b. From this pathway, glycine demonstrated a trending decrease from baseline to peak of induction and increase from peak of induction to peak of resolution in the BGI-H category (unadjusted p < 0.05) (Appendix 3.2). Additionally, homoserine, N-acetylglycine and O-acetylhomoserine, demonstrated trending changes in various BGI categories. There was a very strong correlation at peak of induction between mean levels of threonine and serine (r = 0.874) but weak correlations at peak of induction between mean levels of threonine and N-acetylserine (r = 0.247) and between N-acetylserine and serine (r = 0.071).
Mean levels of histidine, from the histidine metabolism sub-pathway, were decreased from baseline to peak of induction (q = 0.03). The histidine metabolism sub-pathway is
illustrated in Figure 4c. Histidine metabolites include trans-urocanate and cis-urocanate. Trans-urocanate demonstrated a trending decrease from peak of induction (Day 21) to peak of
resolution (Day 49) without stratifying by BGI category (unadjusted p < 0.05) while cis-urocanate demonstrated a trending decrease from peak of induction (Day 21) to peak of
21
from the glutathione metabolism sub-pathway, decreased from baseline to peak of induction (q = 0.02). The glutathione metabolism pathway is illustrated in Figure 4d. Mean levels of glutamate were decreased from baseline to peak of induction (q = 0.03) (Figure 4a). Glutamate is included in several pathways including the histidine metabolism sub-pathway, the glutathione metabolism sub-pathway, the purine metabolism sub-pathway, and the alanine, aspartate and glutamine metabolism sub-pathway. Glutamate demonstrated a trending decrease from peak of induction (Day 21) to peak of resolution (Day 49) in the BGI-G category (unadjusted p < 0.05).
Additionally, glutamine, a metabolite that shares several pathways with glutamate, demonstrated a trending decrease from baseline to peak of induction without stratifying by BGI category (unadjusted p < 0.05). There was a moderate correlation at peak of induction between mean levels of metabolites glutamate and 5-oxoproline (r = 0.874) which are included in the glutathione metabolism sub-pathway (Figure 4d).
Mean levels of erythronate, from the aminosugars metabolism sub-pathway, were decreased from baseline to peak of induction (q = 0.03). Trending decreases were seen in the BGI-P1 category from peak of induction to peak of resolution (unadjusted p < 0.05).
Mean levels of tyrosine, from the phenylalanine and tyrosine metabolism sub-pathway, were decreased from baseline to peak of induction (q < 0.05). From the phenylalanine
metabolism sub-pathway, several metabolites including phenyllactate, P-cresol sulfate, and phenylacetate demonstrated trending decreases from baseline to peak of induction in the BGI-H category.
22
which showed trending, although not statistically significant, decreases at peak of induction (Day 21) as compared to baseline in the BGI-H category (unadjusted p < 0.05). Similarly,
3-hydrohyisobutyrate and citramalate, which are members of the valine, leucine and isoleucine metabolism pathway, also showed trending, although not statistically significant, decreases at peak of induction (Day 21) as compared to baseline in the BGI-H category (unadjusted p < 0.05).
Changes in clinical indices that co-vary with changes in metabolites
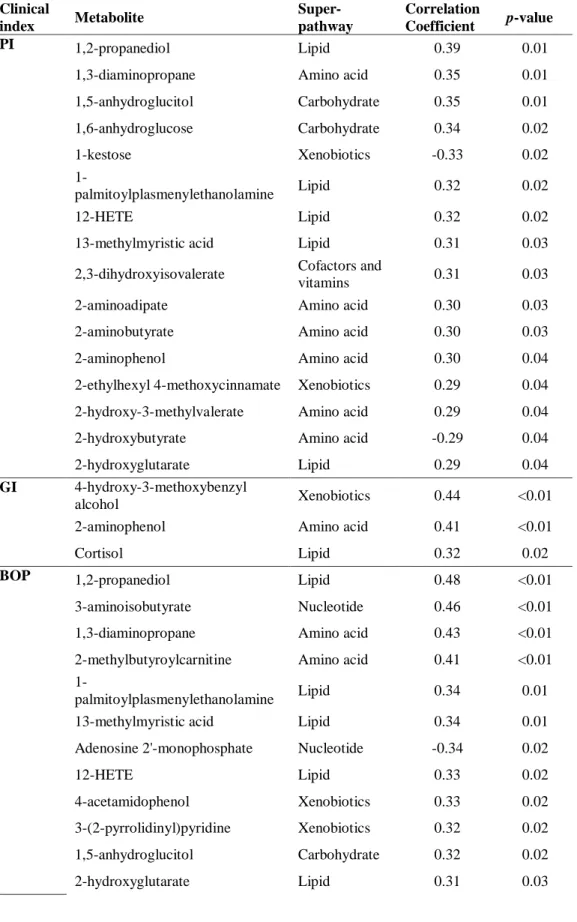
Covariance matrices were applied to describe correlations between mean changes in metabolites and changes in clinical indices at peak of induction (Day 21). When changes in mean metabolites were analyzed without stratifying by BGI category, no metabolites with q < 0.05 were noted (Table 4.1). A weak negative correlation was noted between changes in CAL at peak of induction and mean changes in glycine (r = -0.34, p = 0.02) and taurine (r = -0.3, p = 0.03) which were statistically significant. A weak positive correlation was noted between changes in BOP at peak of induction and mean changes in 5-oxoproline (r = 0.25, p = 0.08) and cis-uroconate (r = 0.27, p = 0.06) which was not statistically significant (data not reported).
23
In the BGI-H group, a strong positive correlation was noted between changes in BOP and mean changes of glutamate (r = 0.69, p = 0.03) and glutamine (r = 0.64, p = 0.04).
Additionally, a strong positive correlation was noted between changes in BOP and threonine in BGI-P2 (r = 0.68, p = 0.03), between changes in PI and GI and histidine in BGI-H (r = 0.71, p = 0.02 and r = 0.69, p = 0.03 respectively), and between changes in PI and 5-oxoproline in BGI-P1 (r = 0.69, p = 0.03).
Section 3.4: Discussion
24
Threonine, N-acetylserine, and serine, from the serine and threonine metabolism sub-pathway, decreased from baseline to peak of induction (q < 0.05). Threonine bridges the glycine, serine and threonine metabolism sub-pathway and the valine, leucine and isoleucine biosynthesis sub-pathway. Interestingly, trending decreases of isoleucine, valine, 3-hydroxyisobutyrate and citramalate, from the valine, leucine and isoleucine metabolism sub-pathway, were noted in the BGI-H category from baseline to peak of induction. Additionally, glycine, which is an
intermediate metabolite between serine and threonine, demonstrated a trending decrease from baseline to peak of induction and increase from peak of induction to peak of resolution in the BGI-H category (unadjusted p < 0.05). The statistically significant decrease in threonine, N-acetylserine, and serine and trending non-significant decrease in glycine, isoleucine, valine, 3-hydrohyisobutyrate and citramalate may represent a feature of the gingival bacterial populations reliance on protein breakdown and amino acid catabolism for energy and specifically the serine and threonine metabolism and valine, leucine and isoleucine metabolism sub-pathways. The very strong correlation at peak of induction between mean levels of threonine and serine (r = 0.874) strengthens this postulation. These findings are in contrast with those of Barnes et al. (2011) who studied salivary metabolites in human subjects with periodontal health and periodontitis and demonstrated that while dipeptides were elevated, amino acids were unchanged with the exception of cysteine, which was elevated (Barnes et al., 2011).
25
putrescine nor cadaverine demonstrated statistically significant changes at peak of induction and peak of resolution in this study (data not reported). Cadaverine demonstrated a trending increase at peak of induction compared to baseline and a trending decrease at peak of resolution as compared to peak of induction when samples were not stratified by BGI category (unadjusted p
<0.05). It is possible that reduced concentrations of these metabolites in saliva as compared with GCF accounts for this effect.
Mean changes of glutamate were statistically significantly decreased from baseline to peak of induction. Since glutamate is an amino acid that is commonly metabolized by oral bacteria (Takahashi, Sato, & Yamada, 2000), the decrease observed in this study strengthens the postulation that gingival bacterial populations rely on amino acid catabolism for energy and specifically glutamate for carbon and sulfur metabolism. When samples were pooled, glutamine demonstrated a trending decrease from baseline to peak of induction. Glutamine is derived from proteolysis of host tissues, and serves as a precursor for glutamate (Nurjhan et al., 1995).
Additionally, reduced levels of glutamate will drive the reaction of glutamine to glutamate via the enzyme glutaminase (glutamine and glutamate metabolism sub-pathway, Figure 4a) that releases additional ammonia that will serve to raise the pH of the environment. In fact, periodontitis is associated with a rise in pH above neutrality and increased probing depth and inflammation have been correlated with increased alkalization(Bickel & Cimasoni, 1995; Holt & Ebersole, 2005).
26
while changes in trans-urocanate and cis-urocanate demonstrated trending decreases from peak of induction to peak of resolution. Lower levels of histidine and the urocanates at peak of induction and peak of resolution could have negative consequences on oral health due to their anti-inflammatory properties. Glutamate and histidine share several metabolic pathways including the histidine metabolism sub-pathway and the purine metabolism sub-pathway. Statistically significant decreases in mean levels of these two metabolites at peak of induction may suggest an important role of these two pathways in the initiation of periodontal
inflammation. Like the glutamine and glutamate metabolism sub-pathway, the reaction from histidine to the urocanates increases ammonia. This pathway may also serve to raise the pH of the environment.
27
Barnes et al. (2013) demonstrated elevated 5-oxoproline, glutamate, cysteine, γ-glutamyl-AA, glutathione disulfide (oxidized) and cysteine-glutathione disulfide (components of glutathione metabolism) in saliva when comparing diabetic and non-diabetic subjects with healthy
periodontium, gingivitis and periodontitis (Barnes et al., 2013, March). However, this effect was more pronounced in diabetic subjects.
Erythronate is an organic acid present in healthy adults and children in the aqueous humor of the eye, connective tissue, urine, plasma, cerebrospinal fluid and synovial fluid (Harding, Hassett, Rixon, Bron, & Harvey, 1999). Erythronate is formed when N-Acetyl-D-glucosamine is oxidized (Jahn, Baynes, & Spiteller, 1999). N-Acetyl-D-N-Acetyl-D-glucosamine is a component of hyaluronic acid which is glycosaminoglycan found in human connective tissue inclusive of the periodontium (Sukumar & Drizhal, 2007). Erythronate is also derived from degradation of ascorbic acid, which is an anti-oxidant (Harding et al., 1999). Mean changes of erythronate were statistically significantly decreased from baseline to peak of induction (q < 0.05). To our knowledge, erythronate has not been investigated in gingivitis and periodontitis. Barnes et al. (2009) reported a statistically significant decrease in ascorbic acid found in the GCF of diseased sites. Since oxidative stress has been implicated in the pathogenesis of periodontitis (Galli, Passeri, & Macaluso, 2011), decreased levels of anti-oxidants such as ascorbic acid would be expected. It is possible that decreased levels of erythronate detected in this study at peak of induction reflects an enhanced oxidative state.
3-28
hydrohyisobutyrate and citramalate, showed trending changes in the BGI-H category (unadjusted
p < 0.05). The lack of similar changes in the other four disease states could reflect a pre-existing hyper-inflammatory state.
Tyrosine is an essential amino acid that is involved in several functions including neurotransmitter and hormone synthesis and is rapidly metabolized (Rasmussen, Ishizuka, Quigley, & Yen, 1983). It is involved in a number of pathways including phenylalanine and tyrosine metabolism sub-pathways. Mean changes of tyrosine were statistically significantly decreased from baseline to peak of induction (q < 0.05) which reinforces the suggestion that gingival bacterial populations rely on amino acid catabolism for energy. Trending decreases were seen among several metabolites in the phenyalanine metabolism sub-pathway including P-cresol sulfate and phenylacetate. These results are in contrast with Barnes et al. (2011) who demonstrated no significant difference in tyrosine and a trending increase in P-cresol sulfate in subjects with periodontitis as compared to healthy subjects (Barnes et al., 2011). One must be cautious in comparing these results since Barnes et al.(2011) reports cross-sectional data while this study was longitudinal.
Our data indicate that some changes in clinical indices co-vary with changes in metabolites in BGI categories. Changes in BOP within the BGI-P1 category demonstrate the strongest correlation with two metabolites, 3-aminoisobutyrate and 1,3-diaminopropane, from the nucleotide and amino acid super-family, respectively. To our knowledge, aminoisobutyrate and 1,3-diaminopropane have not been investigated in gingivitis and periodontitis.
29
aminotransferase and transiently elevated levels of 3-aminoisobutyrate in lead poisoning, starvation, total body irradiation, malignancies, neurological disorders and developmental delay (van Gennip et al., 1987). Elevated levels have been suggested to contribute to neurological and developmental problems since it is a structural analog for gamma-aminobutyric acid and glycine which are two major inhibitory neurotransmittors in the central nervous system (van Kuilenburg et al., 2004). 1,3-diaminopropane is a member of both the arginine and proline and beta-alanine metabolic pathways. Abnormal levels found in breast cancer and leukemia (Byun et al., 2008; Lee et al., 1998).
Strong positive correlations between changes in BOP and glutamate and glutamine at peak of induction in the BGI-H category contradict previously reported data in this manuscript. Recall that when samples were not stratified by BGI category, mean levels of glutamate were statistically significantly decreased from baseline to peak of induction and mean levels of glutamine demonstrated a trending decrease from baseline to peak of induction. Since BGI-G, P1, P2 and P3 categories have an increased clinical inflammatory status, slight increases in glutamate and glutamine in the BGI-H group may have been masked when all subjects were analyzed together. It would be interesting to investigate changes in clinical indices and changes in glutamate and glutamine using the SIBO model with larger sample sizes to see if the
30 Section 3.5: Conclusion
Among the 281 biochemicals identified in the saliva from the subjects in this study, only eight metabolites demonstrated a statistically significant change (applying FDR, q < 0.05) from baseline to peak of induction when samples were not stratified by BGI category. When samples were stratified by BGI category, no statistically significant changes were noted (applying FDR, q
< 0.05). Trending changes were noted in each BGI category (unadjusted p-values). Our data indicate that two metabolites demonstrate very strong correlation with changes in BOP (applying FDR, q < 0.05) in the BGI-P1 category. This finding warrants further investigation. The
31
TABLE 1.1: DEMOGRAPHICS BY BGI CATEGORY (N = 50)
Characteristic (All) BGI-H BGI-G BGI-P1 BGI-P2 BGI-P3 p-value*
Sex 0.21
Female 7 (21.2%) 7 (21.2%) 9 (27.3%) 6 (18.2%) 4 (12.1%) Male 3 (17.7%) 3 (17.7%) 1 (5.9%) 4 (23.5%) 6 (35.3%)
Race 0.87
African American 6 (23.1%) 6 (23.1%) 5 (19.2%) 6 (23.1%) 3 (11.5%) Caucasian 3 (15.0%) 3 (15.0%) 4 (20.0%) 4 (20.0%) 6 (30.0%) Other 1 (25.0%) 1 (25.0%) 1 (25.0%) 0 (0.0%) 1 (25.0%)
Diabetes 0.40
Yes 0 (0.0%) 1 (100%) 0 (0.0%) 0 (0.0%) 0 (0.0%) No 10 (20.4%) 9 (18.4%) 10 (20.4%) 10 (20.4%) 10 (20.4%)
Former Smoker 0.054
Yes 0 (0.0%) 2 (28.5%) 4 (57.1%) 1 (14.3%) 0 (0.0%) No 10 (23.3%) 8 (18.6%) 6 (14.0%) 9 (20.8%) 10 (23.3%)
32
TABLE 1.2: BASELINE CLINICAL INDICES BY BGI CATEGORY (N = 50)
Clinical index BGI-H BGI-G BGI-P1 BGI-P2 BGI-P3
33
TABLE 2.1 – MEAN CLINICAL CHANGES DURING INDUCTION AND RESOLUTION OF EXPERIMENTAL SIBO (N = 50)
Baseline Stent in place Resolution
Day 7 Day 14 Day 21 Day 35 Day 49
34
TABLE 2.2 – MEAN CLINICAL CHANGES DURING INDUCTION AND RESOLUTION OF EXPERIMENTAL SIBO BY BGI CATEGORY (N = 50 TOTAL; N = 10 PER BGI
CATEGORY)
Baseline Stent in place Resolution
BGI Day 7 Day 14 Day 21 Day 35 Day 49
H 0.37 (0.14) 1.19 (0.14)† 1.35 (0.14)† 1.48 (0.14)† 0.71 (0.16)** 0.56 (0.16)† G 0.62 (0.11) 1.30 (0.11)† 1.28 (0.11)† 1.39 (0.11)† 0.62 (0.12)† 0.62 (0.13)† Mean PI P1 0.76 (0.11) 1.56 (0.11)† 1.76 (0.11)† 1.50 (0.11)† 0.81 (0.11)† 0.93 (0.11)**
P2 0.77 (0.11) 1.47 (0.11)† 1.46 (0.11)† 1.59 (0.11)† 0.68 (0.11)† 0.73 (0.11)† P3 1.21 (0.19) 1.46 (0.19) 1.62 (0.19) 1.73 (0.19) 0.96 (0.19)* 0.84 (0.19)* H 0.50 (0.10) 0.91 (0.10)* 1.01 (0.10)** 1.01 (0.10)** 0.87 (0.12) 0.56 (0.12)* G 0.74 (0.07) 0.99 (0.07)* 1.15 (0.07)** 1.12 (0.07)** 0.83 (0.08)* 0.89 (0.08)* Mean GI P1 0.86 (0.06) 1.06 (0.06)* 1.13 (0.06)* 1.12 (0.06)* 0.75 (0.06)† 0.97 (0.06)
P2 1.00 (0.08) 1.18 (0.08) 1.24 (0.08)* 1.31 (0.08)* 0.76 (0.08)† 0.89 (0.08)** P3 1.19 (0.09) 1.13 (0.09) 1.27 (0.09) 1.38 (0.09) 1.02 (0.09)* 1.02 (0.09)* H 14.1 (4.44) 28.9 (4.44)* 32.5 (4.44)* 35.1 (4.44)* 20.0 (5.30)* 24.3 (5.30) G 23.0 (4.45) 31.7 (4.45) 41.8 (4.45)* 47.8 (4.45)** 26.9 (4.98)* 34.8 (5.31) BOP P1 21.5 (4.84) 31.8 (4.84) 49.0 (4.84)** 47.2 (4.84)** 26.3 (4.84)* 29.6 (4.84)*
P2 34.5 (4.80) 48.7 (5.06)* 51.3 (4.80)* 53.7 (4.80)* 20.0 (4.80)† 30.1 (4.80)* P3 49.7 (6.48) 46.6 (6.48) 57.6 (6.48) 56.1 (6.48) 39.4 (6.48) 33.7 (6.48)*
35
TABLE 3.1 – MEAN METABOLITE LEVELS DURING INDUCTION AND RESOLUTION OF EXPERIMENTAL SIBO (N = 50)
Metabolite Super-pathway Sub-pathway Baseline Day 21 Day 49 q-value
Threonine Amino acid Glycine, serine and
threonine metabolism 0.40 0.29 0.32 <0.01
N-acetylserine Amino acid Glycine, serine and
threonine metabolism 0.31 0.23 0.25 0.02
Serine Amino acid Glycine, serine and
threonine metabolism 0.40 0.30 0.31 0.02
5-oxoproline Amino acid Glutathione metabolism 0.36 0.27 0.32 0.02 Histidine Amino acid Histidine metabolism 0.35 0.29 0.32 0.03 Glutamate Amino acid Glutamate metabolism 0.36 0.30 0.31 0.03
Erythronate Carbohydrate Aminosugars
metabolism 0.34 0.29 0.32 <0.05
Tyrosine Amino acid Phenylalanine &
36
TABLE 3.2 – TOP FIVE MEAN METABOLITE LEVELS DURING INDUCTION OF EXPERIMENTAL SIBO BY BGI CATEGORY (N = 50; N = 10 PER BGI CATEGORY)
BGI Metabolite
Super-pathway Baseline Day 21 Day 49 p-value* q-value
†
H Panose Carbohydrate 0.38 0.25 0.28 <0.01 0.13
Glycyltyrosine Peptide 0.45 0.27 0.34 <0.01 0.13 Isobar: dihydrocaffeate,
3,4-dihydroxycinnamate Xenobiotics 0.40 0.30 0.46 <0.01 0.13
Pantothenate Cofactors and
vitamins 0.38 0.27 0.32 <0.01 0.13 5,6-dihydrothymine Nucleotide 0.39 0.27 0.35 <0.01 0.13 G Homoserine Amino acid 0.33 0.26 0.25 0.02 0.92
Hippurate Xenobiotics 0.30 0.39 0.29 0.03 0.92 Glycylleucine Peptide 0.27 0.34 0.30 0.03 0.92 Phosphoethanolamine Lipid 0.31 0.37 0.28 0.13 0.92 Adenine Nucleotide 0.22 0.31 0.38 0.19 0.92 P1
2-hydroxy-3-methylvalerate Amino acid 0.29 0.22 0.36 0.02 0.92 Creatine Amino acid 0.15 0.35 0.26 0.02 0.92 5-oxoproline Amino acid 0.39 0.29 0.28 0.03 0.92 Thymine Nucleotide 0.30 0.19 0.20 0.04 0.92 3-aminoisobutyrate Nucleotide 0.13 0.22 0.17 0.04 0.92 P2
Alpha-tocopherol Cofactors and
vitamins 0.41 0.26 0.44 <0.01 0.23 Carnitine Lipid 0.35 0.16 0.23 <0.00 0.23 2-aminophenol Amino acid 0.28 0.18 0.22 0.01 0.32 Glycylproline Peptide 0.33 0.22 0.29 0.01 0.32 Guanine Nucleotide 0.35 0.27 0.28 0.01 0.32 P3 Glucose-6-phosphate Carbohydrate 0.46 0.32 0.33 0.02 0.76
37
TABLE 3.3 – TOP FIVE MEAN METABOLITE LEVELS DURING RESOLUTION OF EXPERIMENTAL SIBO BY BGI CATEGORY (N = 50; N = 10 PER BGI CATEGORY)
BGI Metabolite
Super-pathway Baseline Day 21 Day 49 p-value* q-value
†
H serylleucine Peptide 0.29 0.18 0.30 <0.01 0.62 Isobar: dihydrocaffeate,
3,4-dihydroxycinnamate Xenobiotics 0.40 0.30 0.46 0.01 0.81 citramalate Amino acid 0.35 0.24 0.31 0.01 0.81 isoleucine Amino acid 0.38 0.28 0.36 0.02 0.81 beta-alanine Amino acid 0.23 0.09 0.21 0.02 0.81 G phosphoethanolamine Lipid 0.31 0.37 0.28 0.00 0.08 adenine Nucleotide 0.22 0.31 0.38 0.01 0.97 linolenate [alpha or
gamma; (18:3n3 or 6)] Lipid 0.24 0.19 0.11 0.02 0.97 hippurate Xenobiotics 0.30 0.39 0.29 0.03 0.97 2-aminophenol Amino acid 0.32 0.31 0.23 0.03 0.97 P1 hypotaurine Amino acid 0.21 0.24 0.15 0.01 0.54 daidzein Xenobiotics 0.25 0.38 0.23 0.01 0.54 choline phosphate Lipid 0.32 0.34 0.22 0.01 0.54 alanylalanine Peptide 0.30 0.29 0.14 0.01 0.54 erythritol Xenobiotics 0.25 0.33 0.23 0.02 0.54 P2
alpha-tocopherol Cofactors and
vitamins 0.41 0.26 0.44 0.01 0.76 hypoxanthine Nucleotide 0.44 0.34 0.51 0.01 0.76 lysine Amino acid 0.47 0.37 0.52 0.01 0.76 uracil Nucleotide 0.35 0.35 0.45 0.01 0.76 pipecolate Amino acid 0.17 0.19 0.28 0.03 0.76
P3 pinitol Lipid 0.19 0.13 0.24 0.01 0.56
5-oxoproline Amino acid 0.43 0.28 0.36 0.01 0.56 sorbitol Carbohydrate 0.35 0.24 0.40 0.01 0.56
2-methylbutyroylcarnitine Amino acid 0.34 0.19 0.32 0.01 0.56 trans-4-hydroxyproline Amino acid 0.39 0.34 0.40 0.01 0.56 Log of mean metabolites reported as raw concentrations. * unadjusted p-values used to compare peak of induction (Day 21) with peak of resolution. †FDR-adjusted p-values; no metabolites with
38
TABLE 3.4 – SUMMARY OF CHANGES OF METABOLITES FROM BIOCHEMICAL PATHWAYS ALTERED BY EXPERIMENTAL SIBO
Biochemical pathway Change from baseline to peak of induction Glycine, serine and threonine metabolism Down
Valine, leucine and isoleucine biosynthesis Down
Glutamate metabolism Down
Histidine metabolism Down
Purine metabolism Down
Glutathione metabolism Down
39
TABLE 4.1. MEAN CHANGES IN METABOLITES THAT CO-VARY WITH CHANGES IN CLINICAL INDICES AT PEAK OF INDUCTION (N = 50)
Clinical
index Metabolite
Super-pathway
Correlation
Coefficient p-value
PI 1,2-propanediol Lipid 0.39 0.01
1,3-diaminopropane Amino acid 0.35 0.01
1,5-anhydroglucitol Carbohydrate 0.35 0.01
1,6-anhydroglucose Carbohydrate 0.34 0.02
1-kestose Xenobiotics -0.33 0.02
1-palmitoylplasmenylethanolamine Lipid 0.32 0.02
12-HETE Lipid 0.32 0.02
13-methylmyristic acid Lipid 0.31 0.03
2,3-dihydroxyisovalerate Cofactors and
vitamins 0.31 0.03 2-aminoadipate Amino acid 0.30 0.03
2-aminobutyrate Amino acid 0.30 0.03
2-aminophenol Amino acid 0.30 0.04
2-ethylhexyl 4-methoxycinnamate Xenobiotics 0.29 0.04
2-hydroxy-3-methylvalerate Amino acid 0.29 0.04
2-hydroxybutyrate Amino acid -0.29 0.04
2-hydroxyglutarate Lipid 0.29 0.04
GI 4-hydroxy-3-methoxybenzyl
alcohol Xenobiotics 0.44 <0.01
2-aminophenol Amino acid 0.41 <0.01
Cortisol Lipid 0.32 0.02
BOP 1,2-propanediol Lipid 0.48 <0.01
3-aminoisobutyrate Nucleotide 0.46 <0.01
1,3-diaminopropane Amino acid 0.43 <0.01
2-methylbutyroylcarnitine Amino acid 0.41 <0.01
1-palmitoylplasmenylethanolamine Lipid 0.34 0.01 13-methylmyristic acid Lipid 0.34 0.01
Adenosine 2'-monophosphate Nucleotide -0.34 0.02
12-HETE Lipid 0.33 0.02
4-acetamidophenol Xenobiotics 0.33 0.02
3-(2-pyrrolidinyl)pyridine Xenobiotics 0.32 0.02
1,5-anhydroglucitol Carbohydrate 0.32 0.02
40
2-hydroxy-3-methylvalerate Amino acid 0.31 0.03
Arginine Amino acid 0.31 0.03
Alpha-ketoglutarate Energy 0.31 0.03
3-dehydrocarnitine Lipid 0.31 0.03
Cyclo(phe-pro) Peptide 0.30 0.03
1,6-anhydroglucose Carbohydrate 0.30 0.03
2-aminoadipate Amino acid 0.30 0.03
Arachidonate Lipid 0.30 0.04
2-aminobutyrate Amino acid 0.29 0.04
Hypotaurine Amino acid 0.29 0.04
Diphenhydramine Xenobiotics 0.28 0.05
Hydrochlorothiazide Xenobiotics 0.28 0.05
PD Epicatechin Xenobiotics -0.40 <0.01
Beta-alanine Amino acid 0.38 0.01
N-acetylgalactosamine Carbohydrate -0.38 0.01
3-(4-hydroxyphenyl)lactate Amino acid -0.38 0.01 3-phenylpropionate
(hydrocinnamate) Amino acid -0.38 0.01
Pipecolate Amino acid -0.37 0.01
Glycerol Lipid -0.34 0.01
Carnosine Peptide -0.34 0.02
Cortisol Lipid -0.33 0.02
5-aminovalerate Amino acid 0.33 0.02
Citrulline Amino acid -0.33 0.02
Glycerate Carbohydrate -0.32 0.02
Isovalerate Lipid -0.32 0.03
Aspartate Amino acid 0.31 0.03
3-(4-hydroxyphenyl)propionate Amino acid -0.29 0.04
2-hydroxybutyrate Amino acid 0.28 0.05
CAL Mannitol Carbohydrate -0.48 <0.01
3-methylxanthine Xenobiotics -0.44 <0.01
Dihomo-linolenate Lipid -0.44 <0.01
Allantoin Nucleotide -0.42 <0.01 3-phenylpropionate
(hydrocinnamate) Amino acid -0.42 <0.01 Fructose Carbohydrate -0.41 <0.01
41
Beta-hydroxyisovalerate Amino acid -0.41 <0.01
Pipecolate Amino acid -0.39 0.01
Malate Energy -0.39 0.01
Guanosine Nucleotide -0.36 0.01
N-acetylgalactosamine Carbohydrate -0.35 0.01
Ribitol Carbohydrate -0.34 0.01
Glycine Amino acid -0.34 0.02
Phosphoenolpyruvate Carbohydrate 0.33 0.02
Cyclo(phe-pro) Peptide -0.33 0.02
N-carbamoylaspartate Amino acid -0.32 0.03
Lactate Carbohydrate -0.32 0.03
Threonylphenylalanine Peptide 0.32 0.03
Caffeate Xenobiotics 0.31 0.03
Carnitine Lipid -0.31 0.03
Taurine Amino acid -0.30 0.03
Cortisone Lipid -0.30 0.03
Citrulline Amino acid -0.30 0.04
Cortisol Lipid -0.30 0.04
Guanine Nucleotide -0.29 0.04
Glycerate Carbohydrate -0.29 0.04
2-hydroxybutyrate Amino acid 0.29 0.04
Phenylalanylleucine Peptide 0.28 0.05
Isovalerylcarnitine Amino acid 0.28 0.05
Correlation coefficients were evaluated using covariance matrices to describe a correlation between mean changes in metabolites and changes in clinical indices at peak of induction (Day 21). Correlations with p < 0.05 are reported in this table. FDR was applied to data; no
43
FIGURE 2.1 – MEAN PLAQUE INDEX DURING INDUCTION AND RESOLUTION OF EXPERIMENTAL SIBO
44
FIGURE 2.2 – MEAN GINGIVAL INDEX DURING INDUCTION AND RESOLUTION OF EXPERIMENTAL SIBO
45
FIGURE 2.3 – EXTENT BLEEDING ON PROBING DURING INDUCTION AND RESOLUTION OF EXPERIMENTAL SIBO
46
FIGURE 2.4 – MEAN PROBING DEPTH DURING INDUCTION AND RESOLUTION OF EXPERIMENTAL SIBO
47
FIGURE 2.5 – MEAN CLINICAL ATTACHMENT LEVEL DURING INDUCTION AND RESOLUTION OF EXPERIMENTAL SIBO
48
49
Metabolites that demonstrated statistically significant and trending changes in metabolites during experimental SIBO. Red circles indicate metabolites that demonstrated statistical significant decrease (applying FDR, q < 0.05) from baseline to peak of induction (Day 21) when samples were not stratified by BGI category (5-oxoproline, glutamate, histidine, serine, threonine, tyrosine). Blue circles indicate metabolites that demonstrated trending changes in each BGI category (unadjusted p < 0.05); 3-hydroxyisobutyrate demonstrated a trending decrease from baseline to peak of induction (Day 21) in BGI-H; 3-phenylpropionate demonstrated a trending increase from peak of induction (Day 21) to peak of resolution (Day 49) in BGI-P3;
cis-urocanate demonstrated a trending decrease from baseline to peak of induction (Day 21) in BGI-P2 and a trending decrease from peak of induction (Day 21) to peak of resolution (Day 49) in BGI-P1; glutamine demonstrated a trending decrease from baseline to peak of induction (Day 21) when samples were not stratified by BGI category; glycine demonstrated a trending increase from baseline to peak of induction (Day 21) and decrease from peak of induction (Day 21) to peak of resolution (Day 49) in BGI-G; homoserine demonstrated a trending decrease from baseline to peak of induction (Day 21) in BGI-G; hypotaurine demonstrated a trending decrease from baseline to peak of induction (Day 21) in BGI-H; isoleucine demonstrated a trending decrease from baseline to peak of induction (Day 21) and trending increase from peak of
50
FIGURE 4 – SIMPLIFIED METABOLIC PATHWAYS
a) Glutamine and glutamate metabolism sub-pathway b) Glycine, serine and threonine metabolism sub-pathway c) Histidine metabolism sub-pathway
d) Glutathione metabolism sub-pathway
Red indicates metabolites that demonstrated statistical significant decrease (applying FDR, q < 0.05) from baseline to peak of induction (Day 21) when samples were not stratified by BGI category. Blue indicate metabolites that demonstrated trending changes in each BGI category (unadjusted p < 0.05): cis-urocanate demonstrated a trending decrease from baseline to peak of induction (Day 21) in BGI-P2 and a trending decrease from peak of induction (Day 21) to peak of resolution (Day 49) in BGI-P1; glutamine demonstrated a trending decrease from baseline to peak of induction (Day 21) when samples were not stratified by BGI category; glycine
demonstrated a trending increase from baseline to peak of induction (Day 21) and decrease from peak of induction (Day 21) to peak of resolution (Day 49) in BGI-G; homoserine demonstrated a trending decrease from baseline to peak of induction (Day 21) in BGI-G, trans-urocanate
51
APPENDIX 3.1.1 – EXTENDED DETAILS OF METHODS Analysis of salivary metabolome
Metabolomic analyses were conducted at Metabolon, Inc. (Durham, NC). Saliva samples were extracted and prepared for analysis using the automated MicroLab STAR® (Hamilton Robotics). The extraction steps were optimized for removal of protein and maximum recovery of small molecules including both aqueous and organic soluble metabolites (Lee, New, & Ong, 2003). Samples were placed briefly on a TurboVap® (Zymark) to remove the organic solvent. Each sample was then frozen and dried under vacuum. Samples were split into equal parts for analysis using GC/MS and LC/MS. Saliva samples were analyzed in duplicate from timepoints -14, 0, 21 and 49 days for each subject. Samples were subjected to both non-targeted and targeted analysis via LC/MS and GC/MS. Results were reported as raw concentrations of metabolites for five groups (BGI-H, BGI-G, BGI-P1, P2, and P3) at seven time points (Day -14, 0, 7, 14, 21, 35 and 49) which provided data at baseline, induction and resolution. All laboratory analyses were performed masked from sample, visit or patient information.
LC/MS
52
and methanol both containing 0.1% formic acid, while the basic extracts, which also used water/methanol, contained 6.5mM ammonium bicarbonate. The MS analysis alternated between MS and data-dependent MS2 scans using dynamic exclusion.
GC/MS
The samples destined for GC/MS analysis were re-dried under vacuum desiccation for a minimum of 24 hours prior to being derivatized under dried nitrogen using bistrimethyl-silyl-triflouroacetamide. The GC column was 5% phenyl and the temperature ramp is from 40° to 300°C in a 16 minute period. Samples were analyzed on a Thermo-Finnigan Trace DSQ fast-scanning single-quadrupole mass spectrometer using electron impact ionization. The instrument was tuned and calibrated for mass resolution and mass accuracy on a daily basis. The
information output from the raw data files was automatically extracted as discussed below.
53 Compound identification
Compounds were identified by comparison to library entries of purified standards or recurrent unknown entities. Identification of known chemical entities was based on comparison to metabolomic library entries of purified standards. The combination of chromatographic properties and mass spectra gave an indication of a match to the specific compound or an isobaric entity. Additional entities could be identified by virtue of their recurrent nature (both chromatographic and mass spectral). These compounds have the potential to be identified by future acquisition of a matching purified standard or by classical structural analysis.
Data normalization
For studies spanning multiple days, a data normalization step was performed to correct variation resulting from instrument inter-day tuning differences. Each compound was corrected in run-day blocks by registering the medians to equal one and normalizing each data point proportionately. For studies that did not require more than one day of analysis, no normalization was necessary.
Quality control
54
55
APPENDIX 3.1.2 - INSTRUMENT AND PROCESS VARIABILITY.
Quality control sample Measurement Median RSD Internal standards Instrument variability 5% Endogenous biochemicals Overall process variability 11%