Strategies for Enriching Variant Coverage in
Candidate Disease Loci on a Multiethnic
Genotyping Array
Stephanie A. Bien1*, Genevieve L. Wojcik2, Niha Zubair1, Christopher R. Gignoux2, Alicia R. Martin2, Jonathan M. Kocarnik1, Lisa W. Martin3, Steven Buyske4, Jeffrey Haessler1, Ryan W. Walker5,6, Iona Cheng7, Mariaelisa Graff8, Lucy Xia9, Nora Franceschini8, Tara Matise4, Regina James10, Lucia Hindorff11, Loic Le Marchand12, Kari E. North8, Christopher A. Haiman9, Ulrike Peters1,13, Ruth J. F. Loos5,6, Charles L. Kooperberg1, Carlos D. Bustamante2, Eimear E. Kenny5,6, Christopher S. Carlson1,13*, on behalf of PAGE Study
1 Division of Public Health Sciences, Fred Hutchinson Cancer Research Center, Seattle, Washington, United States of America, 2 Department of Genetics, Stanford University, Stanford, California, United States of America, 3 Division of Cardiology, George Washington University School of Medicine and Health Sciences, Washington, DC, United States of America, 4 Department of Genetics, School of Arts and Sciences, Rutgers University, Piscataway, New Jersey, United States of America, 5 The Charles Bronfman Institute for Personalized Medicine, The Icahn School of Medicine at Mount Sinai, New York, New York, United States of America, 6 The Department of Preventive Medicine, The Icahn School of Medicine at Mount Sinai, New York, New York, United States of America, 7 Cancer Prevention Institute of California, Fremont, California, United States of America, 8 Department of Epidemiology, Gillings School of Global Public Health, University of North Carolina, Chapel Hill, North Carolina, United States of America, 9 Department of Preventive Medicine, Keck School of Medicine, University of Southern California/Norris Comprehensive Cancer Center, Los Angeles, California, United States of America, 10 Division of Intramural Research, National Institute of Child Health and Human Development, National Institutes of Health, Bethesda, Maryland, United States of America, 11 Division of Genomic Medicine, National Human Genome Research Institute, National Institutes of Health, Bethesda, Maryland, United States of America, 12 Department of Epidemiology Program, University of Hawai’i Cancer Center, Honolulu, Hawai’i, United States of America, 13 Department of Epidemiology, University of Washington, Seattle, Washington, United States of America
¶ Membership of the PAGE Consortia are provided in the Acknowledgments.
*[email protected](CSC);[email protected](SAB)
Abstract
Investigating genetic architecture of complex traits in ancestrally diverse populations is imperative to understand the etiology of disease. However, the current paucity of genetic research in people of African and Latin American ancestry, Hispanic and indigenous peo-ples in the United States is likely to exacerbate existing health disparities for many common diseases. The Population Architecture using Genomics and Epidemiology, Phase II (PAGE II), Study was initiated in 2013 by the National Human Genome Research Institute to expand our understanding of complex trait loci in ethnically diverse and well characterized study populations. To meet this goal, the Multi-Ethnic Genotyping Array (MEGA) was designed to substantially improve fine-mapping and functional discovery by increasing variant coverage across multiple ethnicities at known loci for metabolic, cardiovascular, renal, inflammatory, anthropometric, and a variety of lifestyle traits. Studying the frequency distribution of clini-cally relevant mutations, putative risk alleles, and known functional variants across multiple populations will provide important insight into the genetic architecture of complex diseases
a11111
OPEN ACCESS
Citation: Bien SA, Wojcik GL, Zubair N, Gignoux
CR, Martin AR, Kocarnik JM, et al. (2016) Strategies for Enriching Variant Coverage in Candidate Disease Loci on a Multiethnic Genotyping Array. PLoS ONE 11(12): e0167758. doi:10.1371/journal.pone.0167758
Editor: Amanda Ewart Toland, Ohio State
University Wexner Medical Center, UNITED STATES
Received: August 9, 2016
Accepted: November 18, 2016
Published: December 14, 2016
Copyright: This is an open access article, free of all
copyright, and may be freely reproduced, distributed, transmitted, modified, built upon, or otherwise used by anyone for any lawful purpose. The work is made available under theCreative Commons CC0public domain dedication.
Data Availability Statement: All relevant data are
within the paper and its Supporting Information files.
Funding: The Population Architecture using
and facilitate the discovery of novel, sometimes population-specific, disease associations. DNA samples from 51,650 self-identified African ancestry (17,328), Hispanic/Latino (22,379), Asian/Pacific Islander (8,640), and American Indian (653) and an additional 2,650 participants of either South Asian or European ancestry, and other reference panels have been genotyped on MEGA by PAGE II. MEGA was designed as a new resource for studying ancestrally diverse populations. Here, we describe the methodology for selecting trait-spe-cific content for use in multi-ethnic populations and how enriching MEGA for this content may contribute to deeper biological understanding of the genetic etiology of complex disease.
Introduction
Over the last decade genetic research has made marked advances in cataloging variants associ-ated with complex traits and human diseases, which in turn has shed new light on etiological processes. Initial GWAS prioritized genetically homogeneous populations to help prevent spu-rious findings that could result from population stratification. As such, initial genotyping plat-forms were intended to capture common genetic variation in populations of European descent, and later designed to enable efficient imputation of variant reference panels derived from very large sets of European-descent controls [1]. The sparsity of genetic research in American minority populations has led to insufficient sample sizes and inadequate genomic tools for diverse populations. Limited understanding of the genetic heterogeneity in disease loci across populations could greatly limit variant discovery efforts and exacerbate existing health disparities in many complex diseases [2]. For example, development of genetic risk models based on European-descent genetic architecture may, in some cases, have reduced pre-dictive accuracy in populations with greater genetic diversity and less linkage disequilibrium (LD) among variants such as African-descent populations [3]. Furthermore, in conjunction with decreases in genotyping cost, enriching arrays for functional variation and inclusion of more variants in known GWAS regions can be used as an advantageous research tool. By leveraging differences in genetic architecture across ancestral populations, transethnic studies can be used to hone in on likely causal variants in known disease or trait loci. This insight can enable rich inferences about the underlying biology of complex diseases and may improve risk modeling across diverse populations.
The Population Architecture using Genomics and Epidemiology (PAGE) consortium (http://www.pagestudy.org) was initiated in 2008 by the National Human Genome Research Institute (NHGRI) to investigate the epidemiologic architecture of well-replicated genetic vari-ants associated with complex diseases in several large, ethnically diverse population-based studies [4]. The PAGE II consortium, cofounded by the NHGRI and the National Institute for Minority Health and Health Disparities, consists of four large, ongoing population-based stud-ies/consortia. Three of these studies were members of the initial PAGE collaboration: the Women’s Health Initiative (WHI,http://www.whi.org) [5]; the Multiethnic Cohort (MEC;
http://www.uhcancercenter.org/research/the-multiethnic-cohort-study-mec) [6]; a subset of the studies comprising the consortium Causal Variants Across the Life Course (CALiCo)— Atherosclerosis Risk in Communities (ARIC,http://www.cscc.unc.edu.offcampus.lib. washington.edu/aric/) [7], Coronary Artery Risk Development in Young Adults (CARDIA;
http://www.cardia.dopm.uab.edu/) [8], and the Hispanic Community Health Study/Study of Latinos (HCHS/SOL,http://www.cscc.unc.edu.offcampus.lib.washington.edu/hchs/) [9]. The fourth PAGE II study is the Charles Bronfman Institute for Personalized Medicine at the Icahn School of Medicine at Mount Sinai (ISMMS), which curates an electronic health record
(EHR)-linked medical care setting biorepository (BioMeTM,http://icahn.mssm.edu/research/ institutes/ipm/programs/biome-biobank). In total, 51,650 self-reported African American/ African ancestries, Hispanic/Latino, Asian/Pacific Islander, and American Indian participants have been genotyped on the Multi-Ethnic Global Array (MEGA). In comparison to previous efforts, the addition of customized content on MEGA was designed to enable deeper func-tional exploration of known disease-associated regions, particularly for less frequent (1–5%) and rare (<1%) genetic variation.
The MEGA array was designed predominantly through the collaborative efforts of Illumina, the Consortium on Asthma among African-ancestry Populations in the Americas (CAAPA), and PAGE II to empower GWAS in diverse ancestry populations. Customized content was included on the MEGA to improve our understanding of genetic loci associated with complex human diseases or traits and to evaluate potential genetic heterogeneity across racial/ethnic groups. Specifically, we selected custom content to: 1) explore the generalization or replication of previously-reported genotype-phenotype associations at known loci; 2) identify indepen-dent or population-specific variant associations within known associated regions; 3) leverage differences in haplotype structure (LD) across populations to hone in on likely causal variants in known trait-associated regions (‘fine-mapping’); and 4) perform candidate functional SNP analysis using variants known to be (a) clinically relevant, (b) implicated in candidate path-ways, or (c) validated as regulatory through laboratory analyses such as allelic reporter assays. Given that functional variants for the majority of GWAS signals have not been identified, the design of MEGA will enable researchers to provide new understanding of the biology underlying known disease associations and improve the generalizability of risk models across populations. Here, we describe both the custom designed MEGA content and discuss valuable insights gained through design efforts that may be of interest to the greater research community.
Methods
MEGA content allocation
MEGA content was partitioned into two major categories: 1) ‘backbone content’ used for agnostic GWAS and exome analyses in ancestrally diverse populations, and (2) ‘PAGE hand-curated custom content’ for targeted analyses aimed at discovering causal variants. The ‘back-bone’ of the array has been described elsewhere [10,11] (https://www.pagestudy.org/index. php/multi-ethnic-genotyping-array) and is summarized inTable 1. Briefly, the backbone con-tains highly informative SNPs for GWAS analyses in European and East Asian descent popula-tions for backwards compatibility with other genotyping arrays. These variants, often referred to as tag SNPs, are positioned in regions of the genome with high LD and typically represent common haplotypes in populations of either European or East Asian descent. However, the vast majority of the MEGA backbone content (83%) empowers GWAS and Exome analyses in African ancestry and Hispanic/Latino populations. The backbone content also includes the tag SNP phenotype associations from the NHGRI GWAS catalog, SNPs that are mentioned in four or more publications (‘SNPs in Publications’ database from the UCSC table browser)[12], and clinically relevant variants (Table 1).
Overview of custom content selection
The custom content available on MEGA was taken from four primary sources: large-scale GWAS, thorough literature review, publicly available variant databases (e.g. 1000 Genomes Phase 3 Project, ClinVar, OMIM, UCSC Table Browser ‘SNPs in Publications’ track), and rec-ommendations from experts on traits of interest to PAGE II. Along with variant annotation
Kidney Diseases grant DK063491 to the Southern California Diabetes Endocrinology Research Center. The HCHS/SOL is supported by NHLBI contracts N01-HC65233, N01-HC65234, N01-HC65235, N01-HC65236, and N01-HC65237. The following institutes/centers/offices contribute to the HCHS/ SOL through a transfer of funds to the NHLBI: the National Center on Minority Health and Health Disparities, the National Institute on Deafness and Other Communication Disorders, the National Institute of Dental and Craniofacial Research, the National Institute of Diabetes and Digestive and Kidney Diseases, the National Institute of Neurological Disorders and Stroke, and the Office of Dietary Supplements. The Strong Heart Study is supported by NHLBI grants U01 HL65520, U01 HL41642, U01 HL41652, U01 HL41654, and U01 HL65521. (The opinions expressed in this paper are those of the author(s) and do not necessarily reflect the views of the Indian Health Service). Funding for the BioMe Biobank program is supported by the Andrea and Charles Bronfman Philantropies. We thank the participants in the BioMe Biobank for their invaluable contribution to biomedical research. The funders had no role in study design, data collection and analysis, decision to publish, or preparation of the manuscript.
Competing Interests: The authors have declared
that no competing interests exist.
Abbreviations: AAC, Admixed African-Descent
tools (e.g. Variant Effect Predictor and ANNOVAR) these resources were used to prioritize known trait loci and select content that could be used to: 1) replicate or generalize index GWAS associations, 2) augment GWAS tagging SNPs in priority regions 3) enhance exome content in priority regions, 4) fine-map GWAS loci, (5) identify functional regulatory variants, (6) explore penetrance/frequency of clinically reported variants in a population-based cohort, and (7) identify novel variant loci in suspected candidate pathways.
Prioritizing known GWAS trait loci
Summary statistics for the largest available GWAS were mined to nominate both known and candidate loci tagging effects for traits related to type 2 diabetes (T2D), inflammation, lipids, coronary heart disease (CHD), blood pressure, kidney disease, anthropometric measurements, various lifestyle traits like alcohol consumption, smoking, and reproductive traits. These traits were prioritized based on the availability of phenotypic data in the samples selected for geno-typing in PAGE II. For GWAS-based datasets, we queried summary level data for the afore-mentioned traits, including both published and unpublished datasets. Using the NHGRI GWAS catalog [13] (available at:http://www.ebi.ac.uk/gwasdate of access: March 19, 2014), we first identified traits directly or indirectly related to prioritized PAGE II traits. In order to maximize power, associations directly related to our traits were rank ordered and studies with
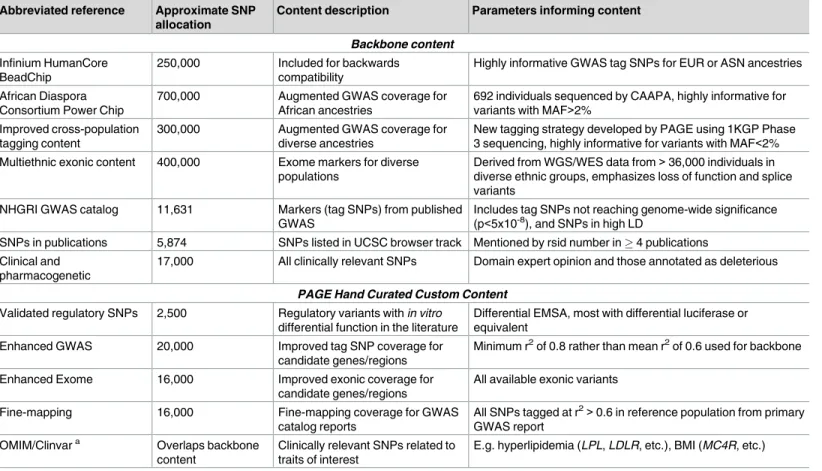
Table 1. Marker allocation used for design of MEGA.
Abbreviated reference Approximate SNP allocation
Content description Parameters informing content
Backbone content
Infinium HumanCore BeadChip
250,000 Included for backwards compatibility
Highly informative GWAS tag SNPs for EUR or ASN ancestries
African Diaspora Consortium Power Chip
700,000 Augmented GWAS coverage for African ancestries
692 individuals sequenced by CAAPA, highly informative for variants with MAF>2%
Improved cross-population tagging content
300,000 Augmented GWAS coverage for diverse ancestries
New tagging strategy developed by PAGE using 1KGP Phase 3 sequencing, highly informative for variants with MAF<2% Multiethnic exonic content 400,000 Exome markers for diverse
populations
Derived from WGS/WES data from>36,000 individuals in diverse ethnic groups, emphasizes loss of function and splice variants
NHGRI GWAS catalog 11,631 Markers (tag SNPs) from published GWAS
Includes tag SNPs not reaching genome-wide significance (p<5x10⁻⁸), and SNPs in high LD
SNPs in publications 5,874 SNPs listed in UCSC browser track Mentioned by rsid number in4 publications Clinical and
pharmacogenetic
17,000 All clinically relevant SNPs Domain expert opinion and those annotated as deleterious
PAGE Hand Curated Custom Content
Validated regulatory SNPs 2,500 Regulatory variants with in vitro differential function in the literature
Differential EMSA, most with differential luciferase or equivalent
Enhanced GWAS 20,000 Improved tag SNP coverage for candidate genes/regions
Minimum r2of 0.8 rather than mean r2of 0.6 used for backbone
Enhanced Exome 16,000 Improved exonic coverage for candidate genes/regions
All available exonic variants
Fine-mapping 16,000 Fine-mapping coverage for GWAS catalog reports
All SNPs tagged at r2>0.6 in reference population from primary GWAS report
OMIM/Clinvara Overlaps backbone content
Clinically relevant SNPs related to traits of interest
E.g. hyperlipidemia (LPL, LDLR, etc.), BMI (MC4R, etc.)
aOMIM/Clinvar datasets were subsequently added as back-bone content when variant classified as deleterious. Additional ‘likely deleterious’ variants were
added if directly related to traits of interest; MAF = Minor Allele Frequency; 1KGP = 1000 Genomes Project; AFR, AMR, ASN, EUR = 1000 Genomes Project Phase 3 super populations; WGS/WES = whole genome sequencing/whole exome sequencing; EMSA = electrophoretic mobility shift assay
smaller discovery populations were prioritized to give greater weight to variants with larger effects. The top 500 ranked associations were selected for locus refinement. For GWAS aug-mentation (described below), loci were defined as 100kb upstream and downstream (200kb total) of the index SNP position in the GRCh37/hg19 build.
Variant annotation
All variants selected for inclusion were annotated using the ‘Snp 142 common’ and ‘All SNPs (142)’ datasets in the UCSC Table Browser. We also used the bedtools utility ‘intersect’ to iden-tify overlap between variant lists, such as the list of functional SNPs, and PAGE II trait loci of interest (GWAS loci and prioritized trait group genes). Coding variants were annotated using multiple annotation methods (ANNOVAR, Variant Effect Predictor, Variant Annotation Inte-grator, and Variant Annotator-GATK) and the most likely deleterious annotation was assigned.
Augmentation of GWAS tagging SNPs in priority loci
MEGA contains a GWAS scaffold designed for enhanced imputation accuracy across multiple populations [11]. In addition to providing an essential tool that can be used for more compre-hensive genetic studies in diverse populations (for both less frequent and common variants), we aimed to enhance genome-wide coverage in regions previously implicated for PAGE II traits of interest. Our methodology to develop the improved multi-ethnic tag SNP selection for MEGA [14] was extended to the custom content regions. Assigning the rest of MEGA as fixed content, tags were selected to enhance coverage in the regions of interest across all 6 continen-tal populations found in 1000 Genomes Project Phase 3 data: Admixed African-Descent (AAC), African (AFR), Americas (AMR), East Asian (ASN), European (EUR), and South Asian (SAS). Tags were selected using a minimum MAF of 1% and a minimum LD r2of 0.2. GWAS loci were defined as 100kb upstream and downstream (200kb total) of the index SNP position in the GRCh37/hg19 build.
Augmentation exome SNPs in priority loci
In the prioritized genes of interest, we lowered the MAF threshold compared to the rest of the MEGA backbone to allow inclusion of doubleton or singleton observations. Synonymous vari-ants were also included in these genes because evidence suggests these can also be functional, whether as miRNA targets or as exonic splice enhancers/silencers [15–23].
Fine-mapping SNPs in priority loci
For our list of GWAS catalog prioritized trait associations (see details above), we defined the variants at a locus as the index variant and all correlated SNPs with an r20.6 within 200 Kb. LD calculations were derived from 1000 Genomes Phase 3 Project SNP coverage (ftp://ftp. 1000genomes.ebi.ac.uk/vol1/ftp/release/20130502/ALL.chr10.phase3_shapeit2_mvncall_ integrated_v2.20130502.genotypes.vcf.gz). Using vcftools v0.1.12a, pairwise LD was calculated in the relevant 1000 Genomes Project super populations: EUR was used when the index dis-covery sample included European-descent populations, and ASN was used for disdis-covery popu-lations of East or South Asian-descent [24]. Tagged SNPs were excluded if they were triallelic or they had a MAF<1%.
Identification of functional regulatory variants
electromobility shift assays (EMSA). To achieve this, we mined both PubMed and Google Scholar to extract terms in the abstract and text. Our search included the following terms: “reporter”, “EMSA”, “luciferase”, “catalase”, “GFP”, or “Chromatin Immunoprecipitation.”
One of the largest challenges in this endeavor was identifying which variant was being reported. There are many different ways to reference a polymorphism, and prior to GWAS, the variant was almost never referred to by the now-standardized dbSNP rsID number. For in-stance, pharmacogenetic variants were often reported using a ‘gene asterisk variant’ notation (eg. CYP2A69) and many other studies reported variants relative to Transcription Start Sites (TSS; eg. -1031T/C). Furthermore, upstream and downstream references were arbitrarily defined as ‘+’ or ‘-‘.When a sequence was provided we used the “BLAT” tool from UCSC Genome Browser (http://genome.ucsc.edu/) to identify the correct variant. If no sequence was available but prim-ers were provided we used the UCSC ‘In-Silico PCR’ tool. Occasionally we were able to find link-age between the rsID number and the alias in a different article using the ‘SNPs in Pubs’ track. Articles were further reviewed in an effort to verify that reports of ‘differential allelic expression’ were statistically significant after Bonferroni correction when multiple variants were analyzed.
Results
Augmented GWAS loci and trait related genes
After hand curation of the GWAS catalog tag SNPs directly related to the following traits were selected: T2D (n = 95), inflammation (n = 527), lipids (n = 379), CHD (n = 280), blood pres-sure (n = 121), kidney disease (n = 92), anthropometric (n = 644), and lifestyle or menstrual related traits (n = 107). In total, we rank ordered the list of 4,453 unique locus tag SNPs. The top 500 ranked associations were selected for locus refinement.
In addition to prioritizing these known and well-powered GWAS loci, 166 genes (Table 2) were prioritized across these eight trait groups based on thorough literature review, clinical relevance, and recommendation by experts with proficient genetic knowledge and clinical knowledge on the priority PAGE II traits. Gene coordinates were defined using the UCSC Table Browser UCSC Genes (GRCh37/hg19) and taking the union of the reported transcripts. These 166 gene coordinates were used to augment exome content and select GWAS tag SNPs.
Custom content on MEGA
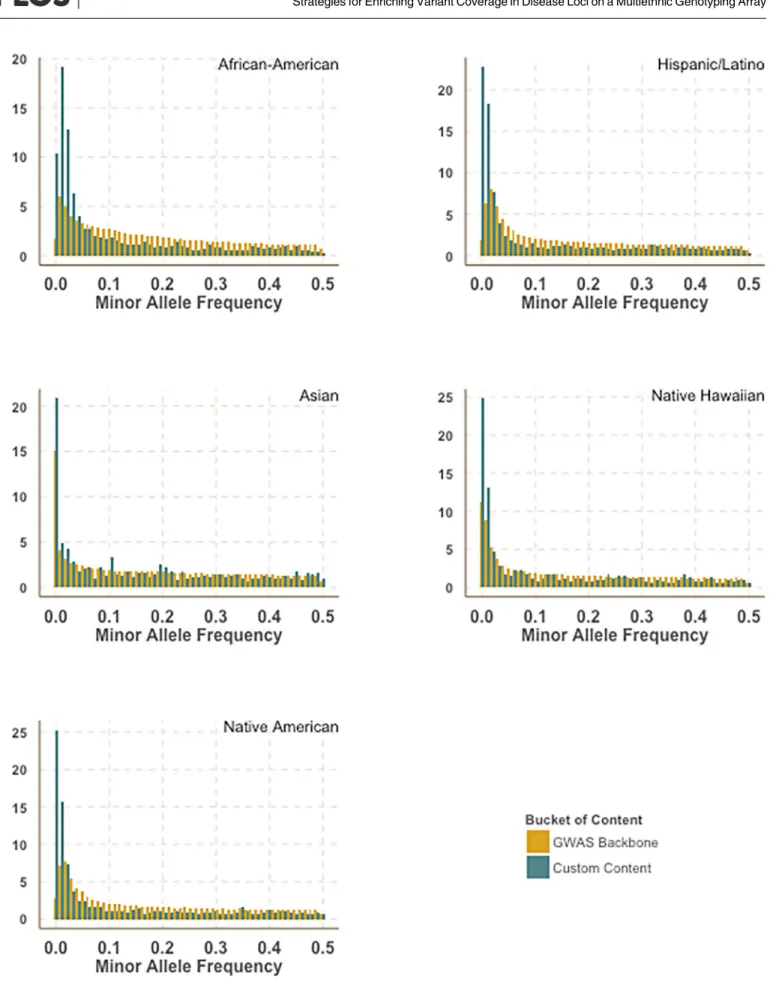
After applying Illumina design filters to select SNPs that are less likely to fail and removing overlap between categories a total of 48,091 SNPs were included as custom design for MEGA (Table 3). In comparison to the GWAS backbone we observed that the customized content was enriched for rarer variation (Fig 1).
Replication or generalization of index associations
Augmented GWAS Tagging SNPs in Priority Regions
A total of 28,465 tag SNPs were selected for augmenting coverage over 84.7 Mb containing 157 priority genes (+/- 50kb flanking regions) and 459 highly ranked GWAS loci (+/- 100kb flank-ing regions). Of those tag SNPs 25,388 made it onto MEGA after QC (S1 Table). In addition to
Table 3. Custom Content Variants Before and After Design.
Source Before Design
Filter
Content Included On MEGA
SNPs in more than 4 publications 2,894 2,849
GWAS catalog 4,915 4,496
Gene-Environment Interaction 139 122
Pharmacogenetic 1,616 1,495
Unpublished GWAS 327 215
Enriched GWAS (S1 Table) 28,465 25,388
Enriched Exome (S2 Table) 14,001 5,733
Fine-map (S3 Table) 15,049 11,974
Regulatory SNPs (literature review of differential allelic assay experiments) (S4 Table)
2,617 1,577
Priority SNPs Requested by Trait group (S5 Table) 3,752 2,278 Targeted genotyping array results (S6 Table) 129 119
doi:10.1371/journal.pone.0167758.t003
Table 2. List of Prioritized Genes by Trait.
Traits Genes of Interest
Obesity/ Anthropometry ACVR2B, CAPN3, FTO, GALNT10, IRX3, KSR2, LEPR*, MRAP2, MTCH2, NEGR1, PCSK1*, PRKCH, RMST, RPGRIP1L, SEC16B, SIM1, TFAP2B, TUB,
Kidney disease/ Blood pressure
ABCG2, APOL1, ARID5B, AS3MT, C1GALT1, C1GALT1C1, CUBN, GALNT2, GALNT14, HECW1, HOXA3, KCNK3, MYH9, PDZK1, RAPH1, SGK1, SLC17A1, SLC2A9, SLC22A11, SLC22A12, SLC16A9,
ST6GALNAC2, TMEM171, UMOD
Coronary Heart Disease CAV1/CAV2, KCNH2, NKX2-NKX5, MEIS1, PRKCA, SCN5A/SCN10A, SOX5, TBX5/TBX3, WNT11, ZFPM2/FOG2
Inflammation ABO, ADAMTS13, AGER, APOE, CRP, CD36*, DARC, EPO, F7, FGB, FGG, G6PD, HNF1A, HNF4A, HBB, HFE, ITGB3, IL6R, JAK2, LCT, LEPR*, MPL, SH2B3, SORT1, TRF2, TUBB1, ZFP36L1
Alcohol use GABRA2, OPRM1, KCNJ6, CHRM2, TAS2R38, TAS2R16, ADH1B, ADH1C, AUTS2, ALDH2
Smoking CHRNA5, CHRNB4, CHRNB3, CHRNA6, CHRNA3, CHRNA4, GPR51, UGT2B10
Age at Menarche ZNF483, FLRT2, CYP19A1, PIK3R1*, DLGAP2, AKT3, CENPW, LIN28B, LRP1B, RORA
Age at Menopause ASH2L, HELQ, INHBA, NFAT5, NLRP11, OLFM2, POLG, PRRC2A, RHBDL2, TLK1, U1MC1
Lipids AGPAT2, BAAT, CD36*, CPT1A, CPT2, CYP27A1, FABP2, HMGCR, LIPA, LMF1, NPC1L1, PCSK1*, PCSK7, PCSK9, PNPLA2, PPARA, PPARG, SLCO1B1, TM6SF2
Type 2 Diabetes ABO, ACP2, APOL2, ANKH, ARAP1, COBLL1, CTNNAL1, CYB5A, DNLZ, DYRK1B, FAM206A, G6PC2, GLP1R, GPSM1, GRB14, HMGA1, IKBAP, KANK1, LIMK2, MADD, NUDT3, OR2AK2, PAM, PIK3R1*, RNF10, RREB1, SLC2A2, SLC30A8, SGSM2, SHBG, SSR1, TBC1D30, TET2
*Genes present in multiple trait groups
Fig 1. Enrichment of rarer variation in custom content. Comparison of minor allele frequency distribution between the MEGA GWAS backbone and the custom content stratified by race. Allele frequencies were calculated in PAGE II study populations.
the background GWAS scaffold, there were on average 41 tag SNPs per prioritized genes and GWAS top hit. (S7andS8Tables)
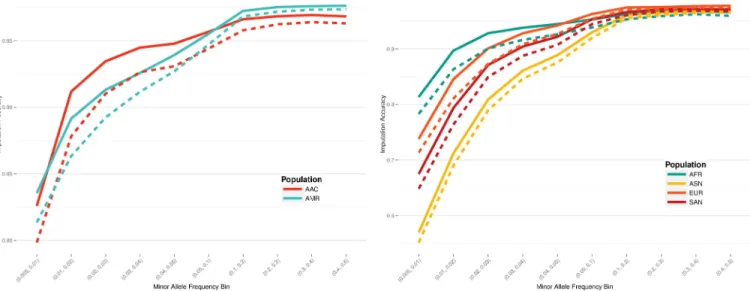
Imputation accuracy was assessed through a leave-one-out internal validation approach, using the 1000 Genomes Project phase 3 data. Pearson’s correlation was estimated between the imputed dosages and the genotypes found in the original data. A scaffold of all MEGA sites was compared to MEGA excluding all custom content, including enhanced exome content, and SNPs added to fine-map previously implicated GWAS loci. An increase in performance was seen across all populations (Fig 2). The largest increase in imputation accuracy was found in low frequency loci, with a MAF below 5%. Imputation accuracy improvement was most notable for AA populations, with an accuracy increase of 3.02% points in AFR for loci with MAF between 0.5% and 1% (Table 4).
Enhanced exome in priority regions
In the 166 genes of interest we selected 14,000 additional variants for inclusion on MEGA. In total 5,733 additional exome content SNPs were included on MEGA after exclusion of those with poor quality, mapping issues, or other synthesis issues. Using multiple annotation methods (ANNOVAR, Variant Effect Predictor, Variant Annotation Integrator, and Variant Annotator-GATK) and taking the most likely deleterious annotation assigned to each variant, we obtained:
Fig 2. Improved imputation accuracy found with custom content sites in regions of interest. Solid lines denote the imputation accuracy of MEGA including the custom content, while dashed lines indicate the performance of MEGA without the custom content. Admixed populations are on the left, with continental populations found on the right.
doi:10.1371/journal.pone.0167758.g002
Table 4. Enhanced Imputation Accuracy with Custom Content Addition.
Population Minor Allele Frequency Threshold
0.5–1% 1–5% >5%
AAC 2.75% 2.63% 0.84%
AFR 3.02% 2.79% 0.98%
ASN 1.79% 1.89% 0.54%
AMR 2.20% 2.27% 0.43%
SAS 2.65% 2.38% 0.52%
EUR 2.48% 2.75% 0.43%
36 stop gained, 2 stop lost, 97 frameshift, 49 in frame variants, 12 splicing variants, 1,144 3’ UTR, 810 5’ UTR, 1,725 non-synonymous and, 3,144 synonymous variants. The median allele fre-quency of these variants across populations was 0.05% (interquartile range = 0.04%-0.1%).
Fine-mapping GWAS loci
For our list of GWAS catalog prioritized trait associations, we defined the variants at a locus as the index variant and all correlated SNPs with an r20.6 within 200 Kb. This resulted in 15,049 variants representing 459 prioritized loci directly related to our traits of interest (S3 Table). We included up to 338 variants per fine-mapped locus, with an average of 33 (SD = 38) variants. After applying the Illumina design score filter of>0.5, 12,199 SNPs in 451 indepen-dent loci remained. The average number of variants per locus was similar with a mean of 27 (SD = 32) variants. The average minor allele frequency was 39% across the 12,199 variants.
Identification of Functional Regulatory Variants
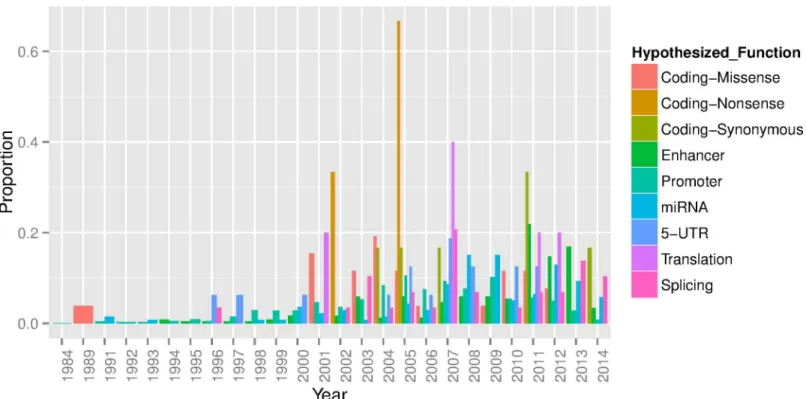
In total, our literature search identified 2,610 variants showing significant differential allelic gene expression. We found that of the variants tested in an allelic assay that were also described as having function only 260 (10%) were strongly tagged (r2>0.6) by a GWAS index SNP. Although these variants could be the underlying functional variant for the association, it should be noted that they are not necessarily the variant underlying the association and in some circumstances there may be multiple or ethnic specific variants in a known locus. How-ever, this supports the assertion that for the vast majority of associated loci the underlying causal variants have not been fine-mapped. Furthermore, while many of the GWAS loci identi-fied to date are positioned in intergenic regions, until recently most of the regulatory variant follow-up has been conducted in promoters where the target gene is known (Fig 3).
Fig 3. The functional hypothesis tested (‘Hypothesized Function”) by year for 2,610 variants reported in a functional allelic assay found through literature review.
Selection of medically important variants
Putative risk variants identified by exome sequencing of familial and population based sam-ples, as well as those derived from literature review for highly penetrant diseases related to our more common traits of interest, were also included on the array. To accomplish this, we per-formed a systematic literature and database search for all mutations known to cause medical traits like hyper/hypolipidemia, hypercholesterolemia, dyslipidemia, lipodystrophy, arterio-sclerotic heart disease, chronic kidney disease, extreme obesity, maturity onset diabetes of the young (MODY), long QT syndrome, Brugada syndrome, alcohol and nicotine dependence or sensitivity, systemic lupus erythematosus, and airway hyper-reactivity. Using ClinVar [25], OMIM [26] and NextBio ( http://www.illumina.com/informatics/research/biological-data-interpretation/nextbio.html) we obtained 2,655 candidate variants.
Identification of variants in candidate pathways
We selected 1,546 variants for candidate pathway analyses based on their involvement with pharmacokinetics or pharmacology (for example: absorption, distribution, metabolism and excretion-ADME; or drug-metabolizing enzymes and transporters-DMET) from publicly available resources (www.pharmaadme.org,http://www.snpedia.com/index.php/Pharma_ DMET,http://www.drugbank.ca/genobrowse/snp-adr).
Discussion
The design of MEGA enables the most comprehensive examination of genetic architecture across ancestrally diverse populations to date, and thus provides a key tool for discovering important insights for many complex diseases and traits. In this manuscript, we have outlined the custom content that was hand-curated by PAGE II in order to improve our understanding of genetic loci associated with complex human diseases or traits and to eval-uate potential genetic heterogeneity across racial/ethnic groups. This high-value content includes: (1) variants relevant to common, complex phenotypes of interest to PAGE II; (2) candidate functional variants in non-coding regions curated from the literature; (3) fine-mapping content selected to refine established GWAS signals reported in the GWAS cata-log; and (4) augmented coverage in candidate regions containing either genes of interest or relevant GWAS associations.
The extensive effort taken to utilize existing knowledge on the genetic etiology of complex traits has enabled PAGE II to enrich the genotyping content in those regions most likely to influence our traits of interest across all populations. Ultimately, the usage of MEGA in this large multi-ethnic study will provide necessary insight into the genetics of complex diseases and help ensure that the benefits gained from genetic research are equitably distributed across diverse populations. For instance, development of genetic risk models based on European genetic architecture alone may in some cases reduce predictive accuracy in other ethnicities [27–30]. Additionally, by leveraging differences in genetic architecture across ancestral popu-lations, transethnic studies can be used to hone in on likely functional variants in known dis-ease or trait loci. Genetic risk models built on tagging variation that is informative across populations will ensure that all ethnic/racial groups are benefitting from the knowledge gained from the public investment in genetic research. Furthermore, by enabling functional insight in genetic risk loci, inferences on the underlying biology of complex diseases can better inform the development of treatment therapies.
have regulatory potential (RegulomeDB); these variants represent a gold standard for estab-lishing regulatory function. The inclusion of variants that have been shown to influence gene expression in the laboratory will assist in fine-mapping associated loci and enable candidate variant associations. In our hand-curation process, we found that although more than a thou-sand allelic functional assays have been published, many were from before the time of GWAS and most were not conducted as a follow-up to a GWAS study. Furthermore, most of the asso-ciated loci to date did not overlap with a variant shown to be functional. Similarly, the vast majority of variants shown to be functional through laboratory assays have been positioned in the promoter, although most associations to date have been positioned in enhancer regions. As such, for the vast majority of associated loci there remains a significant amount of work to be done in identifying the underlying causal variant(s) and target genes. As efforts were taken to include variants predicted to have regulatory function or a deleterious effect in the coding region, we believe the inclusion of tagging variants that are most informative across popula-tions will enable better prioritization of likely causal variant associapopula-tions and thus streamline laboratory follow-up.
To facilitate rapid dissemination of results and methods, as well as promote new collabora-tions with other studies, PAGE II investigators have created a link within the study website (http://pagestudy.org/) to report usage of MEGA.
Supporting Information
S1 Table. Variants selected for enriching GWAS coverage. (TXT)
S2 Table. Variants selected for enriching exome coverage. (TXT)
S3 Table. Variants selected for enriching locus fine-mapping content. (TXT)
S4 Table. Variants included from regulatory literature review. (TXT)
S5 Table. Variant prioritized by trait groups. (TXT)
S6 Table. Targeted genotyping results. (TXT)
S7 Table. Number of GWAS tagging SNPs per gene. (TXT)
S8 Table. Number of GWAS tagging SNPs per SNP. (TXT)
Acknowledgments
The PAGE II investigators thank Alex Reiner, Laura Bierut, Maggie C. Ng, Matthew Sampson, Jeffrey Kopp, Eli Stahl, Girish Nadkarni, and Myriam Fornage for sharing their expertise in variant and genomic loci selection for the custom PAGE II content on MEGA.
Author Contributions
Conceptualization: CSC SAB EEK CDB CLK RJFL UP CAH KEN LLM LH RJ TM NF.
Data curation: SAB GLW NZ LWM ARM RWW IC MG LX NF EEK CSC JH.
Funding acquisition: CSC EEK CDB CLK RJFL UP CAH KEN LLM LH RJ TM NF.
Methodology: SAB GLW CRG EEK CSC.
Project administration: TM RJ LH.
Resources: CDB.
Supervision: CSC EEK CDB CLK RJFL UP CAH KEN LLM LH RJ TM NF.
Visualization: SAB GLW.
Writing – original draft: SAB GLW JMK SB RWW MG LH.
Writing – review & editing: SAB GLW ARM JMK LWM SB RWW MG LH.
References
1. Rosenberg NA, Huang L, Jewett EM, Szpiech ZA, Jankovic I, Boehnke M (2010) Genome-wide associ-ation studies in diverse populassoci-ations. Nat Rev Genet 11: 356–366. nrg2760 [pii]. doi:10.1038/nrg2760 PMID:20395969
2. Oh SS, Galanter J, Thakur N, Pino-Yanes M, Barcelo NE, White MJ et al. (2015) Diversity in Clinical and Biomedical Research: A Promise Yet to Be Fulfilled. PLoS Med 12: e1001918. PMEDICINE-D-15-01863 [pii]. doi:10.1371/journal.pmed.1001918PMID:26671224
3. Campbell MC, Tishkoff SA (2008) African genetic diversity: implications for human demographic history, modern human origins, and complex disease mapping. Annu Rev Genomics Hum Genet 9: 403–433. doi:10.1146/annurev.genom.9.081307.164258PMID:18593304
4. Matise TC, Ambite JL, Buyske S, Carlson CS, Cole SA, Crawford DC et al. (2011) The Next PAGE in understanding complex traits: design for the analysis of Population Architecture Using Genetics and Epidemiology (PAGE) Study. Am J Epidemiol 174: 849–859. kwr160 [pii]. doi:10.1093/aje/kwr160 PMID:21836165
5. The Women’s Health Initiative Study Group. (1998) Design of the Women’s Health Initiative clinical trial and observational study. Control Clin Trials 19: 61–109. S0197245697000780 [pii]. PMID:9492970 6. Kolonel LN, Henderson BE, Hankin JH, Nomura AM, Wilkens LR, Pike MC et al. (2000) A multiethnic
cohort in Hawaii and Los Angeles: baseline characteristics. Am J Epidemiol 151: 346–357. PMID: 10695593
7. The ARIC investigators. (1989) The Atherosclerosis Risk in Communities (ARIC) Study: design and objectives. Am J Epidemiol 129: 687–702. PMID:2646917
8. Hughes GH, Cutter G, Donahue R, Friedman GD, Hulley S, Hunkeler E et al. (1987) Recruitment in the Coronary Artery Disease Risk Development in Young Adults (Cardia) Study. Control Clin Trials 8: 68S– 73S. PMID:3440391
9. Sorlie PD, Aviles-Santa LM, Wassertheil-Smoller S, Kaplan RC, Daviglus ML, Giachello AL et al. (2010) Design and implementation of the Hispanic Community Health Study/Study of Latinos. Ann Epidemiol 20: 629–641. S1047-2797(10)00072-4 [pii]. doi:10.1016/j.annepidem.2010.03.015PMID:20609343 10. H.R.Johnston, N.Rafaels, D.Hu, D.Torgerson, S.Chavan, J.Gao et al (2015) Utilizing an African specific
genotyping array for a large-scale GWAS for asthma in African Americans.(Abstract/Program 20). Pre-sented at the 65th Annual Meeting of The American Society of Human Genetics, Balitimore, MD. 11. C.R.Gignoux, G.L.Wojcik, H.R.Johnston, C.Fuchsberger, S.Shringarpure, A.R.Martin et al (2016) A
Multi-Ethnic Genotyping Array for the Next Generation of Association Studies (Abstract/Program 1885). Presented at the 65th Annual Meeting of The American Society of Human Genetics, Balitimore, MD. 12. Haeussler M, Gerner M, Bergman CM (2011) Annotating genes and genomes with DNA sequences
13. Welter D, MacArthur J, Morales J, Burdett T, Hall P, Junkins H et al. (2014) The NHGRI GWAS Catalog, a curated resource of SNP-trait associations. Nucleic Acids Res 42: D1001–D1006. gkt1229 [pii]. doi: 10.1093/nar/gkt1229PMID:24316577
14. G.L.Wojcik, C.R.Gignoux, C.Fuchsberger, D.Taliun, R.Welch, A.R.Martin et al (2015) Tag SNP selec-tion for low frequency variant imputaselec-tion in populaselec-tions of diverse ancestry (Abstract/Program 1291). 15. Bruun GH, Doktor TK, Andresen BS (2013) A synonymous polymorphic variation in ACADM exon 11 affects splicing efficiency and may affect fatty acid oxidation. Mol Genet Metab 110: 122–128. S1096-7192(13)00207-2 [pii]. doi:10.1016/j.ymgme.2013.06.005PMID:23810226
16. Griseri P, Bourcier C, Hieblot C, Essafi-Benkhadir K, Chamorey E, Touriol C et al. (2011) A synonymous polymorphism of the Tristetraprolin (TTP) gene, an AU-rich mRNA-binding protein, affects translation efficiency and response to Herceptin treatment in breast cancer patients. Hum Mol Genet 20: 4556– 4568. ddr390 [pii]. doi:10.1093/hmg/ddr390PMID:21875902
17. Kimchi-Sarfaty C, Oh JM, Kim IW, Sauna ZE, Calcagno AM, Ambudkar SV et al. (2007) A "silent" poly-morphism in the MDR1 gene changes substrate specificity. Science 315: 525–528. 1135308 [pii]. doi: 10.1126/science.1135308PMID:17185560
18. Nielsen KB, Sorensen S, Cartegni L, Corydon TJ, Doktor TK, Schroeder LD et al. (2007) Seemingly neutral polymorphic variants may confer immunity to splicing-inactivating mutations: a synonymous SNP in exon 5 of MCAD protects from deleterious mutations in a flanking exonic splicing enhancer. Am J Hum Genet 80: 416–432. S0002-9297(07)60091-3 [pii]. doi:10.1086/511992PMID:17273963 19. Ohtsuki T, Koga M, Ishiguro H, Horiuchi Y, Arai M, Niizato K et al. (2008) A polymorphism of the
meta-botropic glutamate receptor mGluR7 (GRM7) gene is associated with schizophrenia. Schizophr Res 101: 9–16. S0920-9964(08)00091-1 [pii]. doi:10.1016/j.schres.2008.01.027PMID:18329248 20. Papp AC, Pinsonneault JK, Wang D, Newman LC, Gong Y, Johnson JA et al. (2012) Cholesteryl Ester
Transfer Protein (CETP) polymorphisms affect mRNA splicing, HDL levels, and sex-dependent cardio-vascular risk. PLoS One 7: e31930. PONE-D-11-16896 [pii]. doi:10.1371/journal.pone.0031930PMID: 22403620
21. Suhy A, Hartmann K, Newman L, Papp A, Toneff T, Hook V et al. (2014) Genetic variants affecting alter-native splicing of human cholesteryl ester transfer protein. Biochem Biophys Res Commun 443: 1270– 1274. S0006-291X(13)02198-0 [pii]. doi:10.1016/j.bbrc.2013.12.127PMID:24393849
22. Wang D, Johnson AD, Papp AC, Kroetz DL, Sadee W (2005) Multidrug resistance polypeptide 1 (MDR1, ABCB1) variant 3435C>T affects mRNA stability. Pharmacogenet Genomics 15: 693–704. 01213011-200510000-00003 [pii]. PMID:16141795
23. Zhu H, Tucker HM, Grear KE, Simpson JF, Manning AK, Cupples LA et al. (2007) A common polymor-phism decreases low-density lipoprotein receptor exon 12 splicing efficiency and associates with increased cholesterol. Hum Mol Genet 16: 1765–1772. ddm124 [pii]. doi:10.1093/hmg/ddm124PMID: 17517690
24. Danecek P, Auton A, Abecasis G, Albers CA, Banks E, DePristo MA et al. (2011) The variant call format and VCFtools. Bioinformatics 27: 2156–2158. btr330 [pii]. doi:10.1093/bioinformatics/btr330PMID: 21653522
25. Landrum MJ, Lee JM, Benson M, Brown G, Chao C, Chitipiralla S et al. (2015) ClinVar: public archive of interpretations of clinically relevant variants. Nucleic Acids Res. gkv1222 [pii].
26. McKusick VA (2007) Mendelian Inheritance in Man and its online version, OMIM. Am J Hum Genet 80: 588–604. S0002-9297(07)61121-5 [pii]. doi:10.1086/514346PMID:17357067
27. Bustamante CD, Burchard EG, De la Vega FM (2011) Genomics for the world. Nature 475: 163–165. 475163a [pii]. doi:10.1038/475163aPMID:21753830
28. Carlson CS, Matise TC, North KE, Haiman CA, Fesinmeyer MD, Buyske S et al. (2013) Generalization and dilution of association results from European GWAS in populations of non-European ancestry: the PAGE study. PLoS Biol 11: e1001661. PBIOLOGY-D-13-00491 [pii]. doi:10.1371/journal.pbio. 1001661PMID:24068893
29. Huo D, Olopade OI (2007) Genetic testing in diverse populations: are researchers doing enough to get out the correct message? JAMA 298: 2910–2911. 298/24/2910 [pii]. doi:10.1001/jama.298.24.2910 PMID:18159061