The handle
http://hdl.handle.net/1887/32003
holds various files of this Leiden University
dissertation
Author
: Yuanyuan Zhao
Title
:
Modelling the dynamics of the innovation process : a data-driven agent-based
approach
Modelling the dynamics of the
innovation process
A data-driven agent-based approach
PROEFSCHRIFT
ter verkrijging van
de graad van Doctor aan de Universiteit Leiden,
op gezag van Rector Magnificus Prof. mr. C.J.J.M Stolker,
volgens besluit van het College voor Promoties
te verdedigen op dinsdag 17 februari 2015
klokke 11:15 uur
door
Yuanyuan Zhao
Samenstelling Promotiecommissie
Promotor
Prof. Dr. B.R. Katzy
Co-promotor
Dr. R. Ortt (Delft University of Technology)
Overige leden
Dr. S.W.Cunningham (Delft University of Technology)
Prof. Dr. J.N. Kok
Prof. Dr. S. Pickl (Universität der Bundeswehr München)
Prof. Dr. A. Plaat
Prof. Dr. H. J. van den Herik
Printed by: Off Page
Table of Contents ... 4
List of Figures... 7
List of Tables ... 8
1 Intr oduc tion ... 9
1.1 Motivation ...11
1.1.1 The importance of innovation ...11
1.1.2 Decision ma king on innovation ...12
1.1.3 The difficulty of co llect ing data ...13
1.1.4 The challenge of analysing data ...14
1.2 Proble m statement and research questions ...15
1.3 Research methodology − in-depth case study ...16
1.4 Thesis overview...18
1.5 Refe rences ...19
2 A Data-dri ve n Modelling Method for Studying Innovation Processes ... 21
2.1 Challenges of modelling innovation processes ...22
2.2 Overvie w of research methods for studying innovation processes...22
2.3 A new data-driven modelling ...24
2.4 Illustration: Analysing the Nylon innovation ...28
2.5 Discussion of the data-driven Modelling Method ...32
2.6 Conclusion...39
2.7 Refe rences ...40
3 The Dynamics of Innovati on Pr ocesses Re visited ... 45
3.1 Advancing innovation process models ...46
3.2 A review of the linear and cyclical model o f innovation ...48
3.2.1 The linear innovation model ...48
3.2.2 The cyclica l innovation model...49
3.3 A system view of innovations ...50
3.4 Method of the study ...53
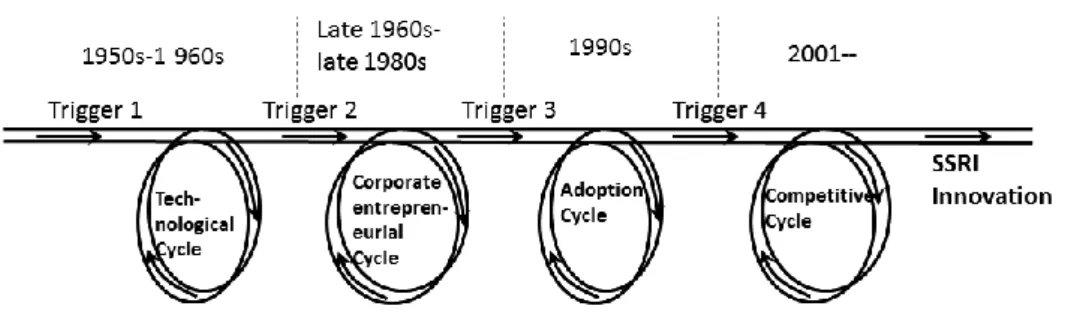
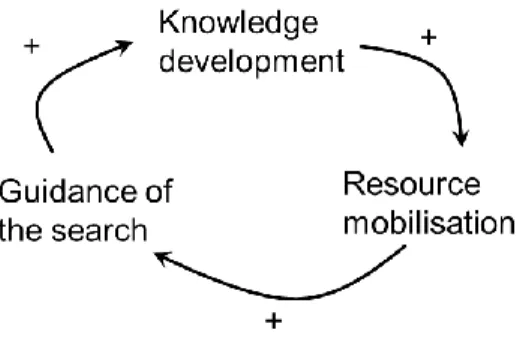
3.5 Process pattern in the SSRI data ...54
3.5.1 The scientific d iscovery phase (1950s -1960s) ...55
3.5.2 Product development phase (late 1960s -late 1980s) ...57
3.5.4 Prozac maturity phase (2001--)...61
3.6 Discussion ...63
3.6.1 Linking linear and cyclical model ...63
3.6.2 Theoretical imp lications ...65
3.6.3 Managerial imp lications ...67
3.7 Conclusions ...68
3.7.1 Answers to RQ2 ...68
3.7.2 Main contributions ...69
3.7.3 Future research ...69
3.8 Refe rences ...70
4 The Emergence of Technol ogical Innovati ons ... 75
4.1 How to spot emergence? ...76
4.2 What does “emergence” mean? ...77
4.3 Can ma instream theories e xpla in e mergence? ...79
4.3.1 Life cycle theory...80
4.3.2 Evolutionary theory ...80
4.3.3 Punctuated equilibriu m theory ...81
4.3.4 Social construction theory ...82
4.3.5 Embedded discussion ...82
4.4 A dissipative self-organising model o f e me rgence ...84
4.5 Case study: the Teflon innovation...86
4.5.1 Analysis approach ...87
4.5.2 The eme rgence of Teflon ...89
4.6 Discussion ...96
4.6.1 Meaning of eme rgence and the mechanism of e me rgence ...97
4.6.2 Added value of the dissipative self-organising model ...99
4.6.3 Practica l implications ...102
4.7 Conclusion...104
4.8 Refe rences ...105
5 A minimal-assumpti on-based agent-based simulation model of the emergence of technol ogical innovation ...111
5.1 Proble ms when applying agent-based simu lation...112
5.3 The agent-based model...117
5.4 Ca librat ing the model with an e mpirica l innovation case ...120
5.4.1 A brief introduction of the Nylon case ...120
5.4.2 Ca librat ing the simu lation model using the Nylon e mp irics ...122
5.5 Running the model ...123
5.6 Decision support: scenario design ...128
5.6.1 Fluctuations ...129
5.6.2 Impact of alte rnative interventions...130
5.7 Conclusions and future study ...132
5.7.1 Answer to RQ4 ...132
5.7.2 Five contributions...133
5.7.3 Future research ...134
5.8 Refe rences ...135
6 Conclusion ...139
6.1 Answers to research questions and problem statement ...140
6.2 Main contributions of the research...142
6.2.1 Contribution to data science ...142
6.2.2 Contribution to innovation process theory...143
6.2.3 Contribution to decision ma king on innovation management ...145
6.3 Limitations and future research ...147
6.3.1 Limitations of the research ...147
6.3.2 Future research ...149
6.4 A vision on the future ...150
6.5 Refe rences ...152
Appendi x A Supple me ntary infor mati on on Chapter 2 ...155
Appendi x B Supple me ntary infor mati on on Chapter 3 ...181
Appendi x C Supple me ntary infor mati on on Chapter 4 ...211
Summary...243
Same nvatting ...247
List of Publicati ons ...251
List of Figures
Figure 2.1 Te mpora l count of events for each system function category ...30
Figure 2.2 Technological cycle in Nylon innovation ...32
Figure 3.1 Integrated linear and cyclical model ...52
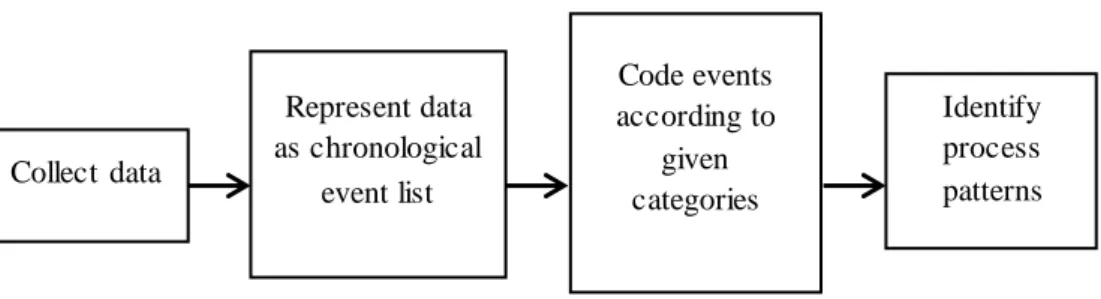
Figure 3.2 Four steps of the data-driven method ...54
Figure 3.3 The technological cyc le in the SSRI innovation ...57
Figure 3.4 The corporate entrepreneuria l cycle in the SSRI innovation ...60
Figure 3.5 The adoption cycle in the SSRI innovation ...61
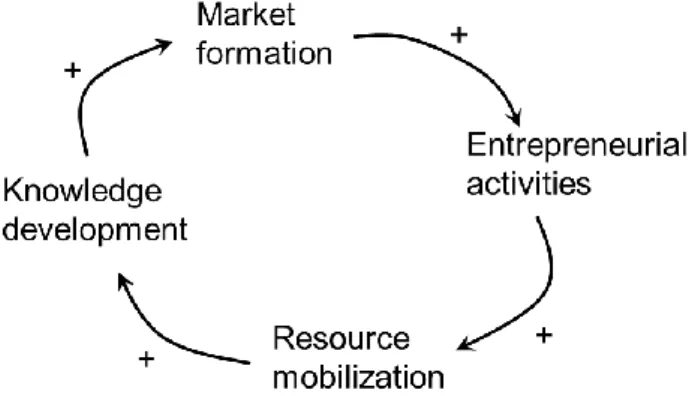
Figure 3.6 The entrepreneuria l cyc le in the SSRI innovation ...63
Figure 3.7 The market-driven cycle in the SSRI innovation ...63
Figure 3.8 Integrated innovation process of the SSRI ...64
Figure 4.1 Positive feedback loops in phase I ...90
Figure 4.2 Positive feedback loops in phase II...91
Figure 4.3 Positive feedback loops in phase III ...92
Figure 4.4 Positive feedback loops in phase IV ...94
Figure 4.5 Positive feedback loops in phase V...96
Figure 5.1 Hypercycles illustrated by Bratus et al. (2010) ...115
Figure 5.2 Hypercycles in technological innovations ...116
Figure 5.3 Flo w chart of the simu lation...119
Figure 5.4 Interactions between system functions in the Nylon case...122
Figure 5.5 Simu lation interface of the Nylon innovation ...124
Figure 5.6 Evolution of hypercycles in the Nylon case ...127
Figure 5.7 Simu lation result and the Nylon innovation reality ...128
Table 2.1Format ofchronological event table...25
Table 4.1 Theoretical fra me work of seven system functions ...88
Table 5.1 Une xpected but meaningful events in the Nylon innovation ...121
Table 5.2 Behaviour rules of agents in the Nylon innovation ...122
Table 5.3 Four chance events and their simulated time ...123
Table 5.4 Frequency of system functions in the Nylon innovation ...126
1
Introduction
Abstract
Innovation is a key word for a country’s economic development, a firm’s success, and inhabitants’ employment. A main challenge is to deal with the dynamics of innovation
processes. To understand the dynamics we may attempt to model them. That will be
the aim of our research.
This chapter gives our motivation for the current research. We formulate a problem
statement and four research questions. To answer the research questions we need a
research methodology. Next to literature research and the analysis of our literature findings, we use in-depth case studies. They are briefly introduced in this chapter.
Their identification is: (1) the Nylon case, (2) the SSRI case, and (3) the Teflon case.
1.1
Motivation
My motivation for writing this thesis is to model the dynamics of innovation processes. Below we describe: the importance of innovation (1.1.1), decision making on
innovation, in which we deal with the complexity of innovation processes and the
insufficient information for decision makers (1.1.2), the difficulty of collecting data (1.1.3), and the challenge of analysing data (1.1.4).
1.1.1 The importance of innovation
Technological innovation is generally believed to be important for a country’s economic growth, for a firm’s success and also for a country’s inhabitants. For a
country, it creates job opportunity, increases economic performance, and improves people’s living standard. For firms, it distinguishes their products from those of their competitors. The need for innovation is imperative both for nations and firms
(Eveleens, 2010). For inhabitants, innovation provides challenging opportunities and employment satisfaction. As Cooper stated, “It’s war: Innovate or die” (Cooper, 2005,
p.4).
Because of the importance of innovation, both national governments and individual firms are dedicated in facilitating innovation. For example, China’s expenditures on scientific research and technological innovations in 2013 was estimated to reach around 1,180 billion yuan ($ 195 billion), almost 2 percent of the GDP (Gross
Domestic Product) in 2013; and was expected to increase more in 2014 (Zhao, 2014). In a similar vein, the budget for EU’s Seventh Framework Programme (FP7) for Research and Technological Development is as high as 50.5 billion euros, which
represents a 41% increase compared to FP6 (Vergara, Van Caenegem, & Ibáñez, 2007).
Efforts at the firm level include, for example, the internet giant Google allowing its employees to spend one workday per week exploring projects unrelated to their job
profiles in order to boost its innovations (Stafford, 2009). IBM calls itself the “Innovation Company” and emphasises innovation as an avenue to influence society. In 2014, IBM is going to invest more than $1 billion to boost innovation through
establishing a new business unit for IBM Watson Foundations, which is a new
developed analytics platform (Firstbiz., 2014). 3M has long emphasised innovation as the main driver of its growth. In order to accelerate innovation, 3M invests generously in research and development to fuel the innovation pipeline; encourages risk-taking,
1.1.2 Decision making on innovation
Making decisions about innovation is notoriously difficult. A multitude of failed innovations can provide evidence. Let us take as an example the subsidy policy in the German photovoltaic (PV) panel industry. In 2000 the German government issued a subsidy policy as market incentives with the purpose of boosting the diffusion of
photovoltaic innovation. Although this policy has succeeded in attracting more people
adopting solar panel technology, the cost of solar subsidies paid by the German government totalled more than 8 billion euro in 2011, which put the German
government on the hook for subsidy payments for the excess. So the German
government began reducing subsidies. However, this decision sent solar companies to crisis, and even killed the whole industry.
A similar failure story of decision making on innovation can be found on the firm level.
Let us take the failure of Sony’s Reader for e-books as an example. Sony’s Reader for e-books was launched in 2006, a year before Amazon brought out the Kindle (SAI,
2009). Moreover, Sony spent more than twice of what Amazon spent on technology development. Compared to Kindle, Sony’s Reader was smaller, slimmer and more lightweight. It had a superior screen with “a highly praised ‘electronic ink’ technology
that was as easy on the eyes as was paper” (Adner, 2012). But Sony’s Reader was beaten by Amazon’s Kindle, a weaker product than Reader (Allen, 2012).
One fundamental reason why decision making on innovation is so difficult is because
the complexity of innovation processes. Obviously, innovation involves large numbers of continuously changing interactions between actors and their activities (Cheng & Van
de Ven, 1996; Van de Ven, Angle, & Poole, 2000). A consequence of this complex
interaction is that a small change of one actor’s behaviours or preferences may be amplified through the interacted network and produce significant results. This makes it
hard to predict the relationships between (1) the decisions or actions taken by actors
and (2) the outcomes they may experience (Cheng & Van de Ven, 1996). Just like the German PV panel market, when the government decreased the subsidy, the whole PV
panel industry was almost destroyed, which is not what had been expected by the
German policy makers.
Understanding the complex interactions involved in an innovation system requires big
that are involved in an innovation scatter at multiple levels (e.g., individuals, firms, research institutes, governments, as well as environmental factors), which further
increases the amount of data. At each point in time data about multiple activities of
multiple actors as well as the interactions between these actors and activities have to be collected, which result in a large database.
Decision makers very often do not have sufficient information about the complex
interactions involved in innovation. They miss a comprehensive understanding of the entire innovation system. For example, in the German PV panel case, the German
policy makers did not realise that while they were trying to stimulating the solar panel market using a demand-pull innovation policy to stimulate the demand side, the
Chinese government was carrying out a technology push innovation policy which
encouraged solar panel manufactures to produce more solar panels. As a result, the German solar market stimulated by the demand-pull policy was almost occupied by the
Chinese manufactured solar panels; and the German solar panel industry was not
satisfyingly boosted. Similar ly, in the Sony Reader for e-books case, Sony failed to grapple with the entire innovation system when it brought out its e-Reader. Although
Sony has better technology in Reader, it did not pay attention to the influence of its
e-Reader on the other members of this value chain, e.g., authors and publishers. It did not start building a good online store; publishers did not sign on, and neither did readers
(Allen, 2012).
1.1.3 The difficulty of collecting data
The collection of large amounts of data has been a prohibitive difficult undertaking and
quite labour-intensive (Poole & Van de Ven, 2004). In the innovation research program, the Minnesota Innovation Research Program (MIRP) which started in the 1980s and
aimed at describing how innovation develops over time, the organisers required
researchers visiting innovation sites not just at one particular time, but at every six months, taking detailed records about meetings of each innovation management
committee (Bitsch, 2005, p.82). It took them decades to collect data and to track what
happened in the studied innovation processes. Though the cost of collecting and storing data has been declining over the past two centuries, until recently it is still relatively expensive (Mayer-Schönberger & Cukier, 2013).
Currently, it looks like the difficulty of collecting data mentioned above can be solved
“many of the inherent limitations on the collection of data no longer exist”. With the development of the Internet and computer techniques, large amounts of data can be
captured and recorded much more easily and cheaply. For example, starting in 2004
Google digitises millions of books through scanning every page into a high-resolution digital image file which can be easily retrieved by people everywhere through the Web
(Mayer-Schönberger & Cukier, 2013). By searching the key words – “Nylon innovation” using the Google search engine, it arrives at about 1,820,000 results in about 0.53 seconds. The retrieved results include historical events in Nylon innovation,
news report, scientif ic descriptions, articles and books, as well as photos and videos about Nylon. By searching “Nylon” in the Google Scholar, 1,390,000 results are presented within 0.008 seconds. In addition, today many dataset are open to public. For
example, through the United States Patent and Trademark Office (USPTO) database, it is easy to gather and track the patent application information for each technological
innovation under investigation. Ultimately, such easy availability of large amounts of
data makes it possible to gain a better understanding of the complex interactions underlying innovation processes. It enables us to go down to the detailed activities
underlying innovation processes and to investigate the interaction patterns at the
lower-level, rather than just staying on the surface and averages of innovations.
1.1.4 The challenge of analysing data
However, now we are facing the problem of interpreting and analysing the large amounts of data. To be most useful, the large amounts of data need to be unlocked and
analysed to build predictive models. Decision makers need to know what had happened,
what is happening now, what is likely to happen next and what actions should be taken to get the optimal results (LaValle, Lesser, Shockley, Hopkins, & Kruschwitz, 2013,
p.21).
The barrier lies in how to extract value from the large amounts of data. The Big Data trend transforms our problem-solving approaches (Mayer-Schönberger & Cukier,
2013): shifting from a theory-validating to a data-driven approach. We are no longer
data require new methods. The scientif ic method as we normally use in our research no longer works in the Big Data era (Pentland, 2014, p.301).
Innovation processes as they are executed nowadays contain large amounts of human
behaviours. These data are textual and qualitative in nature. They are “not readily converted into a variable/actor matrix without losing information or doing an injustice to the data” (Yang & Gilbert, 2008, p.2). Although social scientists are equipped with well-developed statistical techniques to study correlations and regressions among numerical data, they have far less well-developed methods to analyse qualitative
process data (Van de Ven & Poole, 2000). This aggravates the difficulty of decision making on innovation. In order to support decision making on innovation, a method
which is able to theorise from the large amounts of qualitative data is essential.
1.2
Problem statement and research questions
With this background, the thesis intends to explore the following problem statement.
Problem statement:
To what extent can the new available big amounts of data be used to improve decision making on innovations?
In order to answer the problem statement, four research questions are formulated to be
further explored. Below each research question is preceded by an explanation.
The large amounts of data for innovation together with the inherently qualitative nature lead to messy data and require a new analytical method. To
structure the messy data and to extract valuable insights into the operation of actionable decisions, the following research question is investigated in
Chapter 2.
RQ1: Is it possible to develop a data-driven modelling method for studying innovation processes?
Innovation is a dynamic process. Before any efficient decis ions can be made on innovation, it is necessary first to have a good understanding of this process.
opportunity, Chapter 3 reconsiders process theories of innovation and provides an overall structure of innovation processes for decision makers to direct this
process effectively. The study focusses on two stylized models: the linear
innovation model and the cyclical innovation model. The following research question is investigated in Chapter 3.
RQ2: Is it possible to form an advanced model that is able to combine the seemingly contradictory models, namely the linear innovation model and the
cyclical innovation model?
Chapter 4 investigates the emergence of technological innovations. Decision makers have to understand the innovation processes if they want to make predictions. They have to know which knob to turn in order to stimulate
innovations. People are used to looking at the statistic al averages or the
aggregates of the system, such as the rate of innovation, the number of innovations, and the annual profits brought out by a certain innovation.
Although averages are useful to obtain a general picture of the developmental trend, they provide little hints as regards to how to motivate innovations.
Innovation systems are made up of millions of interactions. Decision makers
have to go down to these detailed interactions in order to make effective decisions. This is because the outcomes of a certain decision or action are not
imposed by any central actor, but arise from the lower-level interactions,
which is frequently referred to as emergence (Snowden & Boone, 2007), Emergence is a generic property of complex systems such as innovation
systems. The following research question is investigated in Chapter 4.
RQ3: What does emergence mean? And what is the underlying mechanism that drives the emergence of technological innovations?
The previous chapters are mainly conceptual and are limited in providing practical guidance in decision making. In contrast, Chapter 5 goes to computational simulation to provide decision support. Simulation provides a
virtual environment for decision makers to test the effect of their decisions in advance. With the fast development of computer power in terms of processing capacity and calculation speed, it is now possible to s imulate large amounts of
data for innovation processes which was not quite possible before. The
and Repast (Argonne National Laboratory, repast.sourceforge.net), provide friendly-use and nice visualisation features, which enable social scientists,
who are not usually good at computational techniques, to do simulation.
Therefore, the following research question is investigated in Chapter 5.
RQ4: Is it possible to simulate the emergent process of innovation so as to
provide decision support for innovation managers and policy makers?
1.3
Research methodology − in-depth case study
To understand the dynamics of innovation processes, the method of in-depth case study
is adopted in this research. The in-depth case study method is especially recommended
for complex and poorly understood phenomena such as technological innovation (Eisenhardt, 1989). It is able to provide a rich description of the contextual background
where innovation takes place, and thus a more thorough and comprehensive
understanding of how and why innovation evolves over time (Berg & Lune, 2004). Policy makers as well as innovation managers are more likely to generate practical
action rules and relevant managerial wisdom from these detailed descriptions than fr om statistic averages (Kodama, 2007; Stevenson & Harmeling, 1990).
In total, three in-depth technological innovation cases have been investigated. All of
these three cases are well-documented. The historical data can be obtained from internet, relevant books and scientif ic publications. Below we give a brief introduction
to the three cases.
Case 1: Nylon innovation (Chapter 2 and 5)
In Chapter 2, the Nylon innovation case is used to illustrate how the proposed
data-driven modelling method can be applied to analyse a concrete innovation case. In
Chapter 5, the empirical facts about Nylon innovation are used as input to calibrate the simulation model. The Nylon case describes the evolutionary process of Nylon
technology. Nylon is one type of synthetic plastic material composed of polyamides of
high molecular weight, manufactured as a fibre. It was first produced in 1935 by DuPont, which created a revolution in the fibre industry.
The reasons why we choose the Nylon case is because: (1) an interesting feature of the Nylon case is that the innovation of a technology gave rise to a new industrial sector;
the Second World War and the world-wide oil crisis which mark nonlinear dynamics of the Nylon innovation; and (3) the Nylon innovation is one of the classic cases of which
the data is well-documented and can easily be accessed on the Internet.
Case 2: Selective Serotonin Reuptake Inhibitors (SSRI) innovation (Chapter 3)
In Chapter 3, the Selective Serotonin Reuptake Inhibitors (SSRI) case is used to
exemplify the advanced innovation model that is developed in this chapter. This case
describes how the SSRIs drugs were developed. SSRI is a class of antidepressant drugs which are primarily used to treat depression.
The reason why we choose the SSRI case is because: (1) the development of SSRI is
acknowledged as a breakthrough in psychotropic medications, because before the invention of SSRI all psychotropic medications w ere based on chance observation;
SSRIs were the first psychotropic medications that were purposefully designed; (2) the complexity of the SSRI innovation is matched by tightly governmental regulations as
well as unexpected contextual events. Dynamics were primarily driven by multiple
waves of innovation activities by diverse pharmaceutical companies.
Case 3: Teflon innovation (Chapter 4)
In Chapter 4, the Teflon innovation case is used to understand the underlying
mechanism of the emergence of technological innovations. This case provides a general image of what the emergence of technological innovation is. Teflon,
technically called polytetrafluoroethylene (PTFE), is the plastic with slippery, inert,
non-corrosive and heat-resistant characteristics, and is commonly used for non-stick coating for pans and other cookware.
The reason why we choose the Teflon case is that it provides a good example of the
emergent process. Teflon was discovered by accident, instead of purposefully planned. In 1930 when DuPont and General Motors decided to cooperate in developing new
refrigerant, nobody would have expected that possibly a by-product material with slippery, non-stick and heat-resistant characteristics could be discovered. Even, nobody would have said, “Let’s coat our cooking pans with this material and make a non-sticky cookware industry”. Yet, this is what Teflon technology exactly grew into: commonly used for non-stick coating for cookware and contributing to one of the world’s most
1.4
Thesis overview
Chapter 1 is an introduction to the thesis topic, namely modelling the dynamics of innovation processes. First it describes the motivation of this research, and then it
provides a presentation of the problem statement and the four research questions . And
finally it describes the methodology and gives an overview of the thesis.
In Chapter 2 a data-driven modelling method for innovation process study is presented. This method takes the advantage of the fast development of Internet and
digital data sources to develop more advanced process theory. A longitudinal analysis of the Nylon innovation case is used to illustrate how the data-driven method can be
applied. It answers thus RQ1.
In Chapter 3 the overall structure of innovation processes is investigated. Chapter 3 applies the data-driven modelling method developed in Chapter 2 to investigate the
overall structure of innovation processes. It proposes an integrated innovation model on the basis of understanding more fine-grained pattern underlying innovation, which
only gets possible with the necessary data becoming available. This chapter uses the example of Selective Serotonin Reuptake Inhibitor (SSRI) as an innovation process in the pharmaceutical industry. It answers RQ2.
In Chapter 4 the emergent property of innovation processes is studied and manager ial advices on how to enable the emergence of innovation is provided.Instead of focussing on the diffusion and adoption processes which assume pre-existing new technologies,
this chapter addresses the issue of how new technologies come about. A theoretical
understanding and explanation of the generative process by which innovations develop is provided. Guidance about what exactly R&D and innovation managers can do to
enable emergence is offered. This chapter uses the Teflon innovation case to illustrate
the underlying mechanism of emergence. It answers thus RQ3.
In Chapter 5 a simulation model of the emergence of technological innovations is presented. The simulation model is calibrated and verified using an empirical
innovation case, namely the Nylon innovation. It answers thus RQ4.
Chapter 6 concludes the research by summarising the answers to Research Question 1 to 4 and providing an answer to the problem statement. It reflects on the contributions and limitations of the research. It also presents several recommendations
This research is a study of the interface between data science and innovation management. The fundamental purpose is to make use of the large amounts of data for
decision makings on innovation. The details of this research are in the chapters.
Chapters 2, 3, and 5 have been submitted to corresponding journals and are now under peer review.
1.5
References
3M. 2014. A culture of innovation-3M. Accessed in 2014.
http://solutions.3m.com/3MContentRetrievalAPI/BlobServlet?lmd=134932716600 0&locale=en_WW&assetType=MMM_Image&assetId=1319209959040&blobAtt ribute=ImageFile
Adner, R. 2012. The Wide Lens: A New Strategy for Innovation: Penguin Group (USA) Incorporated.
Allen, F. E. 2012. Why Great Innovations Fail: It's All in the Ecosystem, Forbes.
Berg, B. L., & Lune, H. 2004. Qualitative research methods for the social sciences: Pearson Boston.
Bitsch, V. 2005. Qualitative research: A grounded theory example and evaluation criteria.
Journal of Agribusiness, 23(1): 75-91.
Cheng, Y. T., & Van de Ven, A. H. 1996. Learning the innovation journey: Order out of chaos? Organization Science, 7(6): 593-614.
Cooper, R. G. 2005. Product leadership: Pathways to profitable innovation: Basic books. Dutcher, J. 2013. Book Review: “Big Data: A Revolution That Will Transform How We Live, Work, and Think”. Accessed in 2014. http://datascience.berkeley.edu/book-review-big-data-a-revolution-that-will-transform-how-we-live-work-and-think/ Eisenhardt, K. M. 1989. Building theories from case study research. Academy of
Management Review, 14(4): 532-550.
Eveleens, C. 2010. Innovation management; a literature review of innovat ion process models and their implications. Science, 800: 900.
Firstbiz. 2014. IBM to invest $1 bn to boost innovation, build new unit for Watson. Accessed in 2014. http://www.firstbiz.com/corporate/ibm-to-invest-1-bn-to-boost-innovation-build-new-unit-for-watson-48487.ht ml
Kodama, M. 2007. Innovation and knowledge creation through leadership -based strategic community: Case study on high-tech company in Japan. Technovation, 27(3): 115-132.
LaValle, S., Lesser, E., Shockley, R., Hopkins, M. S., & Kruschwitz, N. 2013. Big data, analytics and the path from insights to value. MIT Sloan Management Review, 21. Mayer-Schönberger, V., & Cukier, K. 2013. Big data: A revolution that will transform how
we live, work, and think: Houghton Mifflin Harcourt.
Pentland, A. 2014. Social Physics: How Good Ideas Spread-The Lessons from a New Science: Penguin.
Poole, M. S., & Van de Ven, A. H. 2004. Handbook of Organizational Change and Innovation: Oxford University Press, USA.
Snowden, D. J., & Boone, M. E. 2007. A leader's framework for decision making. Harvard Business Review, 85(11): 68.
Stafford, P. 2009. How Google is boosting its innovation efforts. Accessed in 2014. http://www.smartcompany.com.au/technology/online/9585-20090622-how-google-is-boosting-its-innovation-efforts.html#
Stevenson, H., & Harmeling, S. 1990. Entrepreneurial man agement's need for a more “chaotic” theory. Journal of Business Venturing, 5(1): 1-14.
Van de Ven, A. H., Angle, H. L., & Poole, M. S. 2000. Research on the management of innovation: The Minnesota studies: Oxford University Press.
Van de Ven, A. H., & Poole, M. S. 2000. Methods for studyin innovation processes. In A. H. V. d. Ven, H. L. Angle, & M. S. Poole (Eds.), Research on the management of innovation. Oxford: Oxford University Press.
Vergara, I., Van Caenegem, G., & Ibáñez, F. 2007. Research in micro -nanotechnology and systems: a European perspective. Opportunities in framework programme 7: 2007-2013. Paper presented at the SPIE.
2
A Data-driven Modelling Method for Studying
Innovation Processes
Abstract
Studying innovation processes remains a challenge for researchers since formalis ing
from rich but messy process data suffers from the constraints of collecting scarce data and processing it – but the constraints are about to be overcome. This chapter aims to answer RQ1: is it possible to develop a data-driven modelling method for studying innovation processes? Addressing this question, the chapter proposes a data-driven
method that makes use of the emerging possibilities of big data, i.e., the abundance of
digital data, to break the traditional trade-off between (a) qualitative methods with rich descriptions but without the possibility to develop a general theory, and (b) quantitative
and simulation methods with high generalisability but with limited in-depth
understanding of innovation processes. The method consists of five steps: (1) data collection, (2) chronological event list, (3) event coding, (4) process pattern
identification, and (5) simulation. We use a longitudinal case study of Nylon
innovation to illustrate how the data-driven method can be applied. The chapter arrives at criteria to assess the validity of this new method. Finally, the benefits of the new
2.1
Challenges of modelling innovation processes
Technological innovation is a dynamic process over time. Therefore, an in-depth description of innovation processes over time is the root of (1) any theory building
(Poole, Van de Ven, Dooley, & Holmes, 2000) and (2) the practical application of the
theory for decision making (Cantisani, 2006). Yet, analysing innovation processes has always been a methodological and practical challenge. Such challenges are present due
to the need of collecting data over long per iods of time and from multiple sources such
as individuals, companies, governments, and other social actors of which the motivations and actions are interrelated and changing. As a result, process studies are
often felt to be drowning in the messy data of thick qualitative descriptions with little
formalisation (Langley, 1999). In contrast, quantitative and simulation methods apply “clean” data sets as needed for numerical analysis (Modell, 2011) but for innovation processes they rather consist of shaky numerical proxy indicators, such as patent data
or scientific publications (see, e.g., Heinze, 2004) with limitations in descriptive power. This chapter is motivated by recent advances of the increasing availability of massive online data, sometimes referred to as big data (Mayer-Schönberger & Cukier, 2013), which offers new ways to overcome this hitherto trade-off. To benefit from the large
amounts of data, the data analysis methodologies need to be tuned towards a more
concrete link between empirical data and its formal analysis.
Therefore, the aim of the chapter is to answer RQ1: is it possible to develop a
data-driven modelling method for studying innovation processes?
The chapter is structured as follows. Section 2.2 provides a literature review on process research methods. The data-driven process modelling method is presented in section
2.3. Its application is illustrated in section 2.4 and its validity and added value are
discussed in section 2.5. In section 2.6, the chapter concludes with considerations on the contributions of the data-driven method to theory development and to decision
making on innovations.
2.2
Overview of research methods for studying innovation
processes
Process studies are concerned with understanding how innovations evolve over time
(Mohr, 1982) and why they evolve in the way they do (Langley, 1999, p.692). The core
which are collected around a technological innovation. Three methodological approaches are commonly used: (1) quantitative analysis based on time-series data
(Heinze, 2004; Reinsel, 1994) such as patent data (see, e.g., Fleming & Sorenson, 2001)
or publication data (see, e.g., Franzoni, 2008; Heinze, 2004; Sakata, Sasaki, Kajikawa, Hashimoto, & Morita, 2010; Trajtenberg, 1999), (2) qualitative analysis based
narrative data such as historical stories, scripts from interviews, or field observations
(see, e.g., Darnhofer, Fairweather, & Moller, 2010; Klerkx, Aarts, & Leeuwis, 2010), and (3) simulation methods (see, e.g., Gilbert, 2005). Below we explain each approach
respectively.
The first approach is based on quantitative data that usually uses statistical methods to
search for patterns or to test theoretical explanations (Langley, 1999, p.697), and therefore is referred to as “quantitative studies”. Benner and Tushman (2002), for example, apply statistical regression to correlate process management activities with
technological innovation using patent data. Similarly, Fleming and Sorenson (2001)
analyse the relationship between the usefulness of an invention and the knowledge components of that invention using patent data. While these process models show high
generalisability and simplicity (Langley, 1999, p.697-698), they lack descriptions of
important contextual information, or as Prasad and Rubenstein (1992) put it, “the subtle undercurrents remain obscured or get washed out during data aggregation”.
The second approach is based on qualitative data. In contrast with quantitative analys is,
it uses narrative descriptions to depict how innovation processes unfold over time (Van de Ven & Poole, 2000) and are therefore called “qualitative studies”. Angle and Van de
Ven (1989) employed narratives to examine the processes of fourteen different technical and administrative innovations. Similar ly, Kijkuit et al. (2010) give a
historical description of how networks of employees in the front end of the new
product development process evolves over time. Hoeber and Hoeber (2012) adopt a similar method to track how community sport organisations undertook a technological
innovation to classify the determinants that contributed to innovation processes. This
The third approach of studying innovation processes is the construction of formal models and the experimental study of process evolution through computer simulation.
The data used by simulation models are usually a combination of quantitative and
qualitative data. For example, Maier (1998) created system dynamics models to simulate the influence of diverse factors on the diffusion of innovation. He formulated
the relationship between the variables in mathematical equations and then calibrated
the model parameters to specific empirical study contexts through quantifying qualitative primary data. Similarly, Kanniainen et al. (2011) established a stochastic
Bass model to forecast the diffusion of innovation. Cui et al. (2011) applied system dynamics models to simulate dynamic feedback mechanisms in the new product launch
process, and Schuler et al. (1991) used simulation to examine the effects of process
innovation and product innovations on the quality of logs in the Canadian softwood lumber industry. The advantages of simulation models lie in the formal logical
integration of multiple factors and actors into one single model. Such models are
computer executable and provide researchers and practitioners with a virtual experimentation environment (Simon, 1996). But these are often criticised as “toy models” that have too loose relationships with reality to make sense or provide practical guidance (Garcia & Jager, 2011; Grimm et al., 2006).
Each of the three approaches is motivated by their specific strengths, which make the
three main requirements for any rigorous process study method explicit as: first, the
ability to identify general patterns of innovation; second, maintaining transparent relationships with detailed longitudinal empir ical data; and third, establishing explicit
causal explanation of how factors lead to the observed patterns. With this in mind, we provide a data-driven study method in the following section.
2.3
A new data-driven modelling
In this section we propose a data-driven modelling method for studying innovation processes. It consists of five steps: (A) step 1 - data collection, (B) step 2 -
chronological event list, (C) step 3 - event coding, (D) step 4 - process pattern
identification, and (E) step 5 - simulation.
A Step 1 - Data Collection
experience of qualitative studies suggests that more data creates a fuller picture of the process. Big data opens new opportunities to collect data from multiple independent
sources, which increases the validity of data through triangulation. Historical archives
are a useful data source, in combination with real-time interviews and participant observations, which however require sufficient resources, observation skills and
context knowledge by the research team to return valid data (Bogdan & Biklen, 2007,
p.59). Data collection through databases, Internet search or automatically collected sensor data has become a convenient additional opportunity. Like any other research
methodology, the quality of data defines the possible reach of later conclusions.
B Step 2 - Chronological Event List
Representation is an essential requirement for transparent documentation and future data access. In step 2, data is represented as a chronological list of events. Events are “changes in ideas, strategies, personnel, and context, which are key indicators capturing the trajectory of innovation” (Schroeder, 2000). Through iterative interpretation events are distilled and constructed from multiple data sources. The
outcome is a table that represents when, by whom, what happened during innovation
processes, and where the raw data came from. The format is given in Table 2.1. The quality of this step is ensured by (1) documenting the relations between raw data and
constructed events; and (2) co-coding by multiple researchers. The resulting chronological list of events, rather than raw data, is the basis for further identification
of patterns (Van de Ven & Poole, 2000).
Table 2.1 Format ofchronological event table
Time By whom Events References
C Step 3 - Event Coding
In step 3 the qualitatively described events of Table 2.1 are further coded using abstract categories. This involves two sub-steps: (1) define categories and (2) code events using the established categories.
Ven & Poole, 2000). One way of deriving categories is through literature review or through the application of existing theoretical frameworks, which
Maxwell (2008) terms “theoretical categorisation”.
Let us look at two examples of the “theoretical categorisation”. The first example is Rogers’ five adopter categories, namely innovators, early adopters,
early majority, late majority, and laggards (Rogers, 2010), which are a
frequently used framework to classify customers during the technological diffusion process. The second example is the social system framework
proposed by Van de Ven and Garud (1987), which is often used to group activities involved in the emergence of new industries.
If there is no suitable framework in existing theories, researchers have to
create inductively their own categories through summarising categories from the empirical data. Abstracting new categories from events can turn this
sub-step (define categories) into an inductive theory building exercise.
2) Code Events Using the Established Categories: Each event is now related to one or more of the established categories. For each category a coding scheme
needs to be developed that describes the characteristics of events that belong
to this category. The evolving coding scheme advances theory building and allows studies to be reproduced.
The contribution of step 3 is twofold: (1) the complexity of the data set is reduced (Dey,
2003, p.94) and (2) abstraction is increased with the transformation of events into a set of quantitative time series that can further be analysed using mathematical methods
(Langley, 1999, p.697).
D Step 4 - Process Pattern Identification
The aim of step 4 is to re-construct macro-level patterns of innovation processes from micro-level events. Three proven approaches are provided in the literature: (D1)
temporal bracketing, (D2) trend pattern analysis, and (D3) interaction pattern analysis.
D1: Temporal Bracketing is the basic sense-making strategy for process studies and is in fact a straightforward structuring of a process by successive phases (Langley, 1999).
Events with shared purposes (e.g., technological development, marketing) are grouped
(Suurs, 2009; Suurs & Hekkert, 2009b), Lichtenstein (Lichtenstein, Carter, Dooley, & Gartner, 2007; Lichtenstein, Dooley, & Lumpkin, 2006), and Langley (Langley, 1999;
Langley & Truax, 1994).
D2: Trend Pattern analysis aims at obtaining an overview of development trends at a macro level. This is usually done through graphic plotting of a number of events
related to a category over time. The visual representation combines qualitative event
data with a quantitative analysis. It gives a direct and explic it picture of the major development trend of the technological innovation. For example, a cluster of events in
a certain period may indicate active innovation activities. It has successfully been used by Van de Ven and Poole (2000), Abell (1987) and Suurs and Hekkert (2009b).
D3: Interaction Pattern analysis investigates causal relationships between events to
explore the underlying micro-foundations of trajectory structures over time (Van de Ven & Poole, 2000). Such coding needs to be distinguished from studies of
relationships between structural components of systems (see, e.g., Islam & Ozcan,
2013). They describe “lead-to” relationships between events, not the contingency relations of variance studies. One event “leads to” another event if it triggers the happening of it. For example, the event “R&D investment increases” may lead to a “scientific discovery” sometime later, which is a different relation than the structural relationship “R&D budget” that may be correlated with “innovativeness of the product portfolio”.
The three process patterns described in this step are complementary and can be applied to the same data set to mature process understanding.
E Step 5 - Simulation
The previous four steps provide a set of knowledge on how a technological innovation evolves over time by identifying macro-level patterns and micro-level mechanisms underlying the patterns. This step intends to go one step further from understanding
historical facts to forecast the future.
Simulation is based on formal models that can be executed by computers. Agent-based modelling is a tool that can integrate qualitative results into a simulation model. By
describing simple rules of behaviour of individual agents and the interactions between
The data and research results obtained through the previous four steps provide valuable empir ical foundations for the agent-based simulation. Firstly, the interaction patterns
identified between events provide qualitative causal models between behaviours of
actors which can be used as input for agent-based modelling to calibrate the interactions between agents. Secondly, the in-depth qualitative analys is, especially the
identified trend patterns, offer stylised facts about the innovation of interest, which can
be used to verify the simulation model through comparing simulation outputs with these identified stylised facts. Simulation models constructed in this way overcome the critiques of “toy problems” through actually basing the inputs of the model on micro-level data, and contrasting the subsequent validation of the outputs against macro-micro-level
data (Garcia & Jager, 2011).
After the simulation model has been verified, it can serve as an experimental platform, which allows policy and decision makers to test their ideas in advance through
designing a range of if-then scenarios and thus providing decision support.
2.4
Illustration: Analysing the Nylon innovation
Below we analyse the Nylon innovation to illustrate how to apply the data-driven
method to study innovation processes.
Nylon was a revolutionary innovation, which opened the era of petrochemical manufactured fibres. Before Nylon was invented, fibres were derived from plant
cellulose. The case of Nylon is selected because: (1) It has an interesting feature, namely that the innovation of Nylon gave r ise to a new industrial sector; (2) the Nylon innovation is one of the classic cases of which the data is well-documented and can
easily be accessed on the Internet; and (3) starting from the late 1920s this case spans
many decades of development and diffusion, which enables a holistic and systematic examination of innovation processes. Below the five steps of the data-driven modelling
method were applied to analyse the Nylon innovation process: (A) data collection, (B) chronological event list, (C) event coding, (D) process pattern identif ication, and (E)
simulation.
A Step 1 - Nylon Data Collection
In the Nylon case, the source of data is mainly historical secondary data. This is
and (2) the collection of the historical data has become relatively easy with the availability of data via the Internet (Yin, 2009). Particularly, for the development
process of Nylon and for Du Pont strategy we rely on Hounshell and Smith (1988a;
1988b), and the website (Cook-Hauptman, 2013) copyrighted by Cook-Hauptman Associates, Inc. which provides the innovation history of Nylon since 1930s. These
documents provide rich material to investigate the Nylon development process. All
these data were obtained from the internet, which also presents the value of the new method in terms of its ability to take advantages of the accessibility of data on the
internet, and furthermore to transfer these scattered and messy process data into patterns.
B Step 2 - Nylon Chronological Event List
In practice, this step is usually concurrent to and iterative with the data collection step.
Whenever a new data source is found, the table of events is updated using the new
source.
C Step 3 - Nylon Event Coding
In the Nylon case, we use theoretical coding with the seven system functions by Hekkert et al. (2007). The seven system functions represent seven categories of
activities that are necessary for a technological innovation to succeed. The completeness and validity of the seven system functions have been tested and
confirmed by empirical studies (see, e.g., Edquist, 2004; Hekkert et al., 2007; Jacobsson & Johnson, 2000; Negro, Hekkert, & Smits, 2007; Suurs & Hekkert, 2009a). The seven system functions are entrepreneurial activities, knowledge development,
knowledge diffusion, guidance of the search, market formation, resource mobilisation,
and support from advocacy coalitions, to which we will refer as F1 through F7 in the above order.
Coding the events to the above system functions is done through a coding scheme,
which can be found in Appendix A.2. The coding results are present in Appendix A.3. During the coding process, we find that events do not always contribute positively to
resource mobilisation function [-F6]. In this sense, in order to distinguish the negative and positive contribution, we mark them as −1 or 1 respectively.
D Step 4 - Nylon Process Pattern Identification
Below we use three approaches to identify process patterns of the Nylon innovation: (D1) temporal bracketing; (D2) trend pattern analysis, and (D3) interaction pattern
analysis.
D1: Temporal Bracketing: Temporal Bracketing of the Nylon innovation
process shows five discrete phases between 1920 and 1990: (1) Invention phase from 1926 until 1934 as resources and activities were dominantly
allocated to the technological invention of Nylon; (2) Technological improvement phase from 1935 until 1937, as attention shifted to Nylon performance improvement; (3) Market entry phase from 1936 until 1940 with
the first market introduction of Nylon; (4) Market maturity phase from 1941
until the oil crisis of 1970, with the focus on market expansion and products diversity, and finally, (5) Decline phase from 1971 until 1990, when Nylon
was confronted with declining profits.
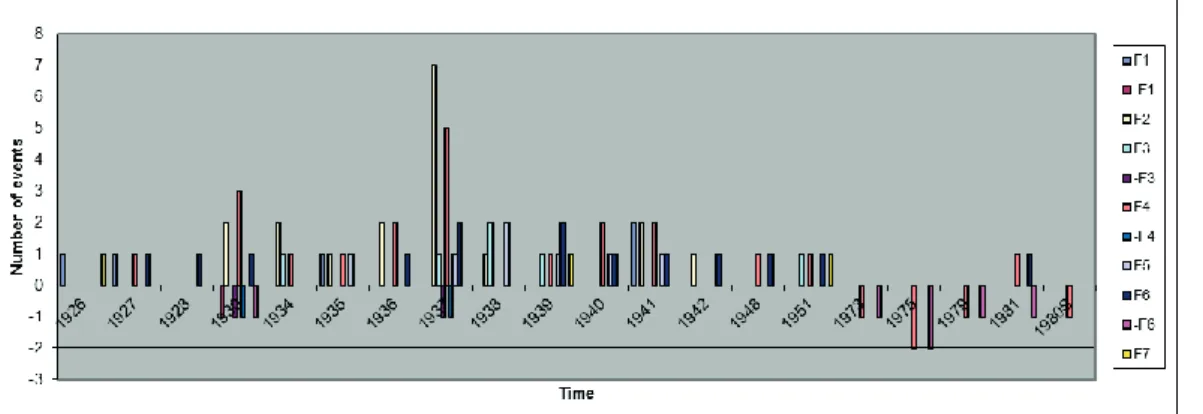
D2: Trend Pattern Analysis: For each development period the count of events for each system function can be quantitatively obtained as illustrated in Figure
2.1. The X-axis indicates the time; the Y-axis refers to the number of events;
and the colour indicates the relation to the system function category.
Trend pattern provides a general image of the Nylon innovation process. The upward movement of the Nylon innovation embraces the period from 1926 to
1960s, which is 43 years; its decline begins in the 1970s and lasts until 1980s
(subject to our study time range), a period of 10 years. From 1926 till 1935, the Nylon innovation system mainly involves the entrepreneurial function [F1],
knowledge development [F2], guidance of the search [F4], and resource
mobilisation [F6], which implies intense technological development activities. The market formation function [F5] first appeared in 1935, which indicates the
beginning of technological commercialisation. The time period between 1935 and 1941 witnesses the full involvement of the seven system functions. In
particular, the most frequent appearance of the market formation function [F5],
technology development function [F2], and guidance of the search function [F4] can be found in the year 1937. After the year 1941 till 1980s, the system
was dominantly f illed with two functions: guidance of the search function [F4]
and resource mobilisation function [F6]. And after 1971 event counts are overall negative, which explains the decline of the Nylon innovation system.
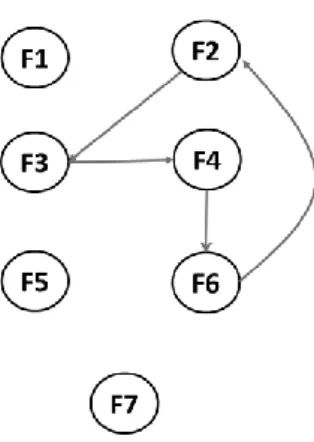
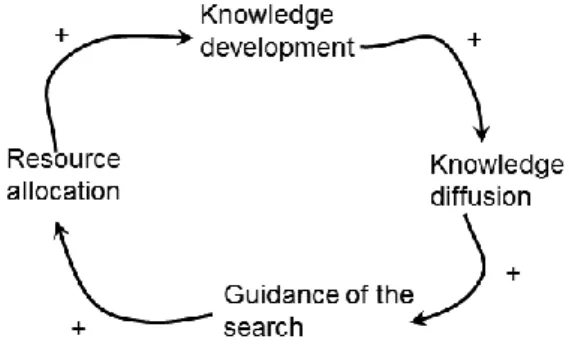
D3: Interaction Patterns analysis: The analysis of interaction patterns of which events “lead to” further events is a distinct analysis and returns an interesting result in the case of Nylon. Cyclical patterns emerge when the “lead to” chains of events start from one system function, leading to other system functions which eventually feed back to the initial system function, thereby forming a close loop. The closed loops are recurring patterns that emerge and dissipate again over time. The innovation system’s behaviours are consistently “attracted” by event sequences in cycles that dominate the system’s evolution (Kiel & Elliott, 1996). We found six such cycles in the Nylon innovation process, which can be found in Appendix A.4. Below we only describe one technological development c ycle as an illustration.
The Technological development cycle, for example, dominated the initial
development phase of the Nylon innovation process. Positive outcomes of technological exper iments [F2] motivated knowledge diffusion [F3], and
influenced the guidance of the search [F4] which further fed back, via
increasing investment [F6] to successive knowledge development [F2]. Gradually, this contributed to an increasing knowledge base, thereby forming a
Figure 2.2 Technological cycle in Nylon innovation
Similarly closed loops were driving the market entry, market mature, and decline phase of the Nylon innovation as described in Appendix A.4.
E Step 5 - Nylon Simulation
The now achieved process model of the Nylon case provides empirical data as well as
the necessary structural information for formal modelling. An example is agent-based
modelling to further explore the dynamic characteristics of the Nylon innovation system. Simulation results can then be compared with the empirical description of the
Nylon innovation process. Controlled manipulation of model parameters can be used for if-then scenarios or managerial decision support. How such a simulation model is
established, validated and adopted for decision making will be described in details in
Chapter 5.
2.5
Discussion of the data-driven Modelling Method
Below we discuss: (A) the validity of the data-driven modelling method; (B) what
needs to be paid attention to, when using the method; and (C) the added value of the method.
A Validity of the data-driven modelling method
We start the discussion with a look on the validity of the data-driven modelling method in the broad meaning put forward by Maxwell (1992, p.284): “Validity is not an
inherent property of a particular method, but pertains to the data, accounts, or conclusions reached by using that method in a particular context for a particular
the validity of the data or accounts derived from that method”. Criteria for the validity
and the rigour of research studies have been established and can be used for checking
the validity of the developed data-driven modelling method (Adcock & Collier, 2001;
Auerbach & Silverstein, 2003; Brod, Tesler, & Christensen, 2009; Thomas & Magilvy,
2011).
Since the process data around a technological innovation are qualitative, subjective and contextual rather than quantitative and rigorous, we find it more proper to apply the
validity criteria for qualitative research than those for quantitative research to test the validity of the developed method. Through literature review, we combine Maxwell
(1992)’s five categories of validity with Auerbach & Silverstein (2003)’s category of
transparency as a checklist to test the validity of our research. because the reason is that the combination covers almost all those categories of validity in qualitative research
and provides a thorough framework to evaluate the validity of qualitative research,
which includes concerns of validity threats in almost every analysis step of the research, for example data collection, description, interpretation, analysis and evaluation. The
five categories of validity from Maxwell (1992) are: descriptive validity, interpretive
validity, theoretical validity, generalisability, and evaluative validity; together with the transparency validity from Auerbach & Silverstein (2003), they make the six categories
of validity as a checklist to evaluate the validity of our research.
1) Descriptive Validity refers to the accuracy of data (Maxwell, 1992; Thomson,
2011). The collected data must accurately represent what happened, and what
human participants have said or done. The descriptive validity plays a fundamental role in other categories of validity test as the data are the basis or
input for all further actions and therefore it is crucial that they are of a good quality. In the case of Nylon, descriptive validity is given as we use long-term
historical data from multiple data sources and reviewed by different
researchers.
2) Interpretive Validity tests how well researchers comprehend the phenomena
from the perspective of the participants engaged in the studied situation instead of from the researcher’s perspective (Headland, Pike, & Harris, 1990; Maxwell, 1992). Interpretive validity concerns the event coding step (step 3)
of the data-driven method. Three different researchers did code the Nylon
interpretation. Individual results were triangulated. Differences were used to improve the coding schemes. Moreover, the analysis unit of the method is
events, which refers to what really happened in a technological innovation,
therefore there is no issue of generalisability or representativeness involved.
3) Theoretical Validity “goes beyond the concrete description and interpretation
and explicitly addresses the theoretical constructions that the research adopts
for, or develops during the study” (Maxwell, 1992, p.291). Theoretical validity of the presented Nylon study is achieved by adopting the
well-developed and tested theoretical framework of innovation system functions and to base the coding categories for events on it.
4) Generalisability means “the extent to which one can extend the account of a
particular situation or population to other persons, times, or settings than those directly studied” (Maxwell, 1992, p.293). Qualitative research is always
criticised for tis lacking generalisability because of the single or small number
of sampling size. But many researchers have recognized that there are different meanings of “generalisability” in (a) qualitative research and (b) quantitative and simulation research. Maxwell (2008), Becker (1990), and
Ragin (1989) expressed that the generalisability of qualitative research should not be evaluated based on explicit sampling of some defined population to
which the results can be extended, but on the development of a theory that can
be extended to other cases. Yin (2009) refers to this as “‘analytic’, as opposed to statistical generalisation” (Maxwell, 2008, p.246). And Guba and Lincoln
(1989) argued that it may be more appropriate to talk of “transferability” rather than “generalisability” in qualitative research. The five steps of the here proposed data-driven modelling method are five intermediate steps between
rich specific data of a concrete situation and general, theoretical explanations. These five steps can be transferred to other innovation process studies.
Moreover, the specific Nylon case provides an in-depth understanding of how
technological innovation evolves over time.
5) Evaluative Validity is the credibility of the assessment made by the
researchers (Maxwell, 1992; Thomson, 2011). The quest is for an evaluative
literature in the same field. In the Nylon case, the identified cyclical pattern resembles the main activities identified in Dosi (1982)’s technological
trajectory concept, which hypothesises that in the emerging phase of a
technology initial importance is attributed to knowledge accumulation, which is called the technological cycle in this study, followed by an entrepreneurial
phase characterised by multiplicity of risk-taking actors who contribute to
technical and commercial trial and error, which is called the entrepreneurial cycle in this study, and finally a phase of “oligopolistic maturity” during which the market is occupied by a few market and technical leaders, which we call the market-driven cycle in this study. The reproduction of known
findings on the macro-level patterns of innovation processes points to the
added value of the data-driven method in reconstituting these patterns from the rich data on the micro-level events that innovation processes are made of.
6) Transparency Validity refers to “how well the researcher informs the reader how they arrived at their interpretation” (Thomson, 2011, p.80). In order to achieve this validity, the research process and the coding procedures must be
carefully documented and presented clearly to the readers in order to make it
possible for other researchers to reproduce the research results. From a transparency point of view , the five steps of the data-driven method
constitute a study protocol. Raw data are documented in the data collection
step (step 1). The chronological list of events is documented with reference to the raw data in the chronological event- list step (step 2). The conceptual
categories and the coding schema are documented in the event-coding step (step 3). The identified process patterns are documented in the
process-pattern-identif ication step (step 4). And the simulation process with the source
codes is documented in the simulation step (step 5), which will be described in Chapter 5. This does not only make the research process transparent and
replicable by other researchers, but also supports the operational research
process, which of course is not as linear as the five phases may suggest. At any point in time, new data can be introduced into the corresponding steps
which form an evolving version of the research documents.