FEF inactivation with improved optogenetic methods
Leah Acker
a,b,c,1, Erica N. Pino
a,d,e, Edward S. Boyden
a,f,g,h, and Robert Desimone
a,f,1aMcGovern Institute, Massachusetts Institute of Technology, Cambridge, MA 02139;bHarvard–MIT Heath Sciences and Technology Program, Harvard
University–Massachusetts Institute of Technology, Cambridge, MA 02139;cSchool of Medicine, Duke University, Durham, NC 27710;dDepartment of
Biology, Massachusetts Institute of Technology, Cambridge, MA 02139;eDepartment of Biological and Biomedical Sciences, University of North Carolina at
Chapel Hill, Chapel Hill, NC 27599;fDepartment of Brain and Cognitive Sciences, Massachusetts Institute of Technology, Cambridge, MA 02139;gMedia Lab,
Massachusetts Institute of Technology, Cambridge, MA 02139; andhDepartment of Biological Engineering, Massachusetts Institute of Technology,
Cambridge, MA 02139
Contributed by Robert Desimone, September 13, 2016 (sent for review March 9, 2016; reviewed by John H. Reynolds, Charles E. Schroeder, and Robert H. Wurtz)
Optogenetic methods have been highly effective for suppressing neural activity and modulating behavior in rodents, but effects have been much smaller in primates, which have much larger brains. Here, we present a suite of technologies to use optogenetics effectively in primates and apply these tools to a classic question in oculomotor control. First, we measured light absorption and heat propagation in vivo, optimized the conditions for using the red-light–shifted halor-hodopsin Jaws in primates, and developed a large-volume illumina-tor to maximize light delivery with minimal heating and tissue displacement. Together, these advances allowed for nearly universal neuronal inactivation across more than 10 mm3of the cortex. Using these tools, we demonstrated large behavioral changes (i.e., up to several fold increases in error rate) with relatively low light power densities (≤100 mW/mm2) in the frontal eye field (FEF). Pharmaco-logical inactivation studies have shown that the FEF is critical for ex-ecuting saccades to remembered locations. FEF neurons increase their firing rate during the three epochs of the memory-guided saccade task: visual stimulus presentation, the delay interval, and motor preparation. It is unclear from earlier work, however, whether FEF activity during each epoch is necessary for memory-guided saccade execution. By harnessing the temporal specificity of optogenetics, we found that FEF contributes to memory-guided eye movements during every epoch of the memory-guided saccade task (the visual, delay, and motor periods).
primate
|
optogenetics|
FEF|
Jaws|
memory-guided saccadeT
he frontal eye field (FEF) is an important brain area for
making saccades to remembered locations. FEF neurons
in-crease their firing rate during three epochs of memory-guided
saccades: (i) target presentation, (ii) delay period, and (iii) motor
preparation. Pharmacological inactivation of the FEF impairs
memory-guided saccades (1
–
7), but because pharmacological
inac-tivation inhibits all FEF neuronal activity, it is unclear if the FEF
’
s
role is specific to one or more task epochs (8, 9). By selectively
inactivating the FEF during each task epoch, we can determine
whether visual-, delay-, or motor-related firing (or some combination
of the three types of firing) contributes to memory-guided saccades.
The ideal tool for this study is optogenetics, which allows for
millisecond-precise, light-driven neuronal control. Unfortunately,
although optogenetics is widely used to study functional physiology
and disease models in rodents and invertebrates, technical
chal-lenges have limited the use of optogenetics in the nonhuman
pri-mate brain, which has a volume
∼
100-fold larger than the rodent
brain (10). Pioneering studies in monkeys reported small behavioral
effects with excitatory (11
–
14) and inhibitory opsins (15
–
17). These
studies used large light power densities (several hundreds of
milli-watts per square meter to 20 W/mm
2) but illuminated only small
volumes, at most 1 mm
3, due to both the chosen wavelength and
light-delivery method. In contrast, FEF pharmacological
inactiva-tion studies report inactivainactiva-tion of volumes of
∼
10 mm
3(2, 3).
Further, optogenetically driven neuronal effects in primates are
often heterogeneous, decreasing the activity of some neurons
and increasing the activity of others (14, 17
–
19). No primate
optogenetics study has reported inactivation levels near the levels of
FEF pharmacological inactivation studies, namely,
>80% reduction
in firing rate relative to baseline reported in
>80% of neurons (1
–
3).
Although many physiological studies have measured the
corre-lation between various neural firing measures and behavior in
dif-ferent brain structures, physiological studies alone cannot establish
which neural circuits are critical for which behaviors at any given
point in time. Optogenetic methods would seem to be ideal for
establishing temporally precise causal relationships, but only if
be-havioral effects are clear and reliable. Thus, improved methods for
establishing larger behavioral effects in primates are a critical need.
Results
We mapped the FEF in two macaque monkeys using
micro-stimulation and electrophysiology. The FEF was defined as the
re-gion in the anterior bank of the arcuate sulcus where fixed-vector,
saccades were evoked with current
<150
μ
A at least 50% of the time
(9, 20
–
22). Typical thresholds in this study were
<50
μ
A. The
re-ceptive field centers were determined based on the end points of
evoked saccades (
SI Appendix
, Fig. S1
). Achieving perfectly balanced
neuronal populations is nearly impossible in the FEF, which is
buried in the arcuate sulcus, because electrodes must go down its
curved bank along a complex and variable trajectory through layers
with unequal distributions of neuronal subtypes (23
–
25). To mitigate
this anatomical limitation, we recorded neurons in these same
lo-cations to confirm the presence of target-, delay- and
motor-responsive units before recording and quantified the distribution
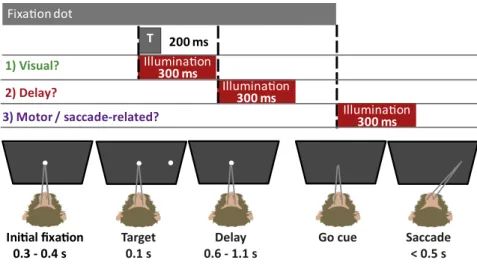
during testing as well. The behavioral paradigm used in this study
is shown in Fig. 1. Based on the results of prior pharmacological
inactivation studies and our FEF mapping in both monkeys, we
Significance
The frontal eye field (FEF) is critical for making eye movements to remembered locations. FEF neurons increase their firing rate in response to seeing a target, to remembering the target location during a delay period, and to planning eye movements to the location. Conventional tools do not allow us to determine what aspects of FEF neuronal activity (i.e., visual, delay, motor) are critical for memory-guided eye movements, so we developed optogenetic tools to inactivate FEF neurons during each task epoch individually. We found that all aspects of FEF firing con-tribute to behavior. Further, we present tools that inactivate large enough brain volumes for optogenetics to be widely used in primate neuroscience and, potentially, human medicine.
Author contributions: L.A., E.S.B., and R.D. designed research; L.A. and E.N.P. performed research; E.S.B. contributed new reagents/analytic tools; L.A. and E.N.P. analyzed data; and L.A., E.N.P., E.S.B., and R.D. wrote the paper.
Reviewers: J.H.R., Salk Institute for Biological Studies; C.E.S., Nathan Kline Institute for Psychiatric Research; and R.H.W., National Institutes of Health.
The authors declare no conflict of interest.
1To whom correspondence may be addressed. Email: [email protected] or leah.acker@
duke.edu.
This article contains supporting information online atwww.pnas.org/lookup/suppl/doi:10.
1073/pnas.1610784113/-/DCSupplemental.
NEUROSCI
ENCE
PNAS
identified the tissue volume needed for opsin expression and
illumi-nation (
∼
10 mm
3); the fraction of neurons that, ideally, needed to
express the opsin within that volume (>80%); and the firing-rate
re-duction needed in each neuron (>80%, relative to baseline) for
be-havioral effects. These parameters guided technological development.
In Vivo Light Propagation.
To compare visible light wavelengths
accurately, and thus select the optimal opsin for our studies, we
developed techniques to measure visible light propagation
omnidir-ectionally in vivo. Previous optogenetic studies have used visible light
propagation measurements and tissue properties derived from in vitro
or ex vivo specimens (26
–
32). For example, Azimipour et al. (33)
recently published an atlas of optical properties and predicted light
distribution in rat brain tissue. Their model was later updated to
in-clude information about blood vessels (34), yet all of the data in both
reports were derived from 0.5-mm-thick ex vivo slices rather than the
intact living brain. Gysbrechts et al. (32) similarly sought to ascertain
optical properties of fresh rat brain tissue bathed in cold saline, which
also contained deoxygenated hemoglobin and likely diluted the blood
present in the sample. Gysbrechts et al. (32) used these optical
measurements to estimate light-induced thermal effects, but did not
validate their estimates with in vivo measurements. Stujenske et al.
(35) performed temperature measurements in vivo to ascertain the
effects of green light on neural tissue and found that the temperature
increases predicted by models were higher than measured in vivo,
underscoring the importance of in vivo measurements.
Oxygenated hemoglobin absorbs far more light than deoxygenated
hemoglobin, so even the best ex vivo or in vitro preparation likely
underestimates blood-related light absorption (36, 37). This
under-estimation primarily affects light absorption in the 200- to 600-nm
wavelength range (i.e., in all colors other than red) in the living brain.
We hypothesized that red light would be less affected by absorption.
Specifically, we wanted to know if red light propagates so much
farther than other colors of visible light in the living brain that it
makes more sense to use Jaws, a red-shifted opsin, at a slightly
off-peak wavelength (i.e., 635 nm) than to use Arch/ArchT, a green-light
sensitive opsin, at its peak wavelength (i.e., 532 nm).
To answer this question, we measured red (635 nm), green (532
nm), and blue (473 nm) light, for completeness, in the living mouse
cortex (n
=
5,
n
=
6, and
n
=
5 mice, respectively). Blue light is
fre-quently used to drive the popular excitatory opsin, channel rhodopsin-2
(ChR2). We elected to use mice for both light propagation and
heating tests because most optogenetics studies are performed in
rodents, and because we did not want to risk damaging the cortex of
a monkey as we worked to determine the proper parameters.
Photons from all directions can stimulate opsins, but previous
studies of visible light propagation simply placed a photodiode
be-low the tissue sample to measure incident light in that plane (26
–
31).
Because such measurement devices do not accept photons at all
incident angles, we adapted an isometric, ruby-tipped probe strategy
to measure true omnidirectional light flux (
SI Appendix
, Figs. S2 and
S3
). To use the isometric probe in vivo for shorter visible
wave-lengths than previously measured (38), we devised calibration and
testing methods. When visible light struck the probe
’
s tip,
ruby-colored photons were emitted in proportion to the incident light
power density and recorded via spectrometer (
SI Appendix
, Fig. S4
).
To allow direct light power measurements, each probe was
cali-brated for each color (
SI Appendix
, Fig. S5
). A 1.5-mm-diameter,
flat-cleaved optical fiber was placed on the surface of the cortex
using a custom holder that kept the illuminator aligned with the
cortex (
SI Appendix
, Fig. S6
), which allowed the probe to advance
along a fixed trajectory. This large-diameter fiber served as a planar
illuminator along the trajectory, where we took measurements in the
center of the fiber beam (
SI Appendix
, Fig. S7
). The probe remained
in gray matter throughout testing. The ruby-photon emission rate
due to incident visible light was measured and converted to light
power densities using a probe and color-specific calibrations.
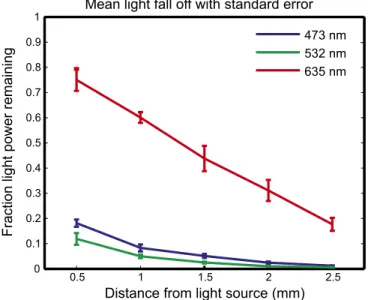
Red light propagated much farther in tissue than either the green
or blue light (Fig. 2). At a depth of 1.5 mm, nearly fivefold as much
red light remained unabsorbed compared with green light.
Further-more, by fitting the individual data from each mouse, absorption (
μ
a)
and effective (
μ
eff) coefficients were determined with SE (least-squares
curve fit,
R
2>
0.95): 635 nm:
μ
a
=
2.14
±
0.15 cm
−1,
μ
eff=
6.61
±
0.53
cm
−1; 532 nm:
μ
a=
13.7
±
1.33 cm
−1,
μ
eff=
41.1
±
4.04 cm
−1; and 473
nm:
μ
a=
10.6
±
0.486 cm
−1,
μ
eff=
31.8
±
1.46 cm
−1. These coefficients
can be used for Monte Carlo modeling to predict light propagation in
vivo for a variety of illuminators and light source geometries (39
–
42).
Based on the superior light transmission of red light in vivo, we
elected to use the red light-sensitive halorhodopsin Jaws (43).
Large-Volume Illuminator.
After selecting an opsin, we sought to
de-sign an illuminator to address two competing goals: large-volume
il-lumination and minimal penetration damage. Previous attempts to
address one of these concerns have come at the expense of the other.
Bundles of fibers illuminate larger volumes, but the increased
pene-tration diameter leads to greater tissue and vascular damage, because
the damage is proportional to fiber diameter (19, 44
–
48). Tapered glass
fibers reduce penetration damage, but narrowly focus light to tiny
il-lumination areas (<100
μ
m
2) (13, 49). Here, a 250-
μ
m-diameter plastic
optical fiber was tapered to a 70- to 100-
μ
m diameter over a 3- to
5-mm-long tip (Fig. 3
A
and
C). Rather than focusing light down along
the taper, we etched the core and cladding (Fig. 3B) to allow light to
escape evenly out from the sides of the tip (
SI Appendix
, Fig. S8
), thus
distributing light broadly over a large area, similar to the larger fiber
bundles yet with minimal penetration damage. Compared with a
conventional fiber of the same material and diameter, this illuminator
Illumina on
300 ms
T
200 ms
1) Visual?
2) Delay?
3) Motor / saccade-related?
Ini al fixa on
0.3 - 0.4 s
Target
0.1 s
Go cue
T
Delay
0.6 - 1.1 s
Saccade
< 0.5 s
Illumina on
300 ms
Illumina on
300 ms
Fig. 1. Memory-guided saccade task with illumination
has
>100-fold the light-emitting surface area and spreads light over
>100-fold the tissue volume with equal light power density
(
SI
Appendix
, Fig. S9
). More importantly, however, one can appreciate
in a simple photograph that it delivers light more broadly with 1/100th
of the light power density in a brain phantom (1.75% agarose) (Fig. 3E).
Unlike conventional optical fibers, which must be coupled to an
electrode (i.e., an optrode), our illuminator distributes light broadly
enough that the illuminator and electrode could be inserted along
parallel trajectories 1 mm apart via the same grid used for the virus
injections (Fig. 3F). Along with reducing penetration damage
proportional to diameter, two separate penetrations cause less
damage than a single penetration with coupled devices, particularly
with 1-mm separation (50, 51) and our illuminator
’
s increased
mechanical compliance vs. glass (52). We illustrate light spread of
at least 1 mm laterally along the illuminator tip with multicontact
electrode recordings from representative neurons (Fig. 3H) and
local field potential (LFP) optical artifacts (Fig. 3G) in monkey L
and corresponding data from single-contact recordings in monkey C
(
SI Appendix
, Fig. S10
).
Tissue Heating.
We are aware of two studies that sought to
pa-rameterize optical heating in vivo (41, 53), but no previous study
has attempted to control the brain tissue heating due to
illumi-nation. Temperature increases
>4 °C may induce damage, and
firing rate increases with a temperature increase of
>2 °C in some
heat-sensitive brain areas (54
–
57). Therefore, we sought to control
for potential heating in our own experiments by measuring brain
temperatures in vivo with our illuminator. Our in vivo brain
tem-perature measurements (
SI Appendix
, Fig. S11
) showed
>100 mW/mm
2of 635-nm light could be delivered via the large-volume
illumi-nator 1 mm from the source with
<1 °C temperature increase, a
commonly accepted conservative limit for changes in brain
func-tion (49, 58
–
60). Preliminary tests showed that temperature
in-creases peaked 1 mm away from the light source (
SI Appendix
, Fig.
S12
), so the measurements taken here likely reflect the greatest
heating in the entire brain and, incidentally, the heating expected
for neurons along the electrode trajectory, which was parallel and
1 mm lateral to the illuminator. The maximum total light power
density applied in this study was 100 mW/mm
2, similar to what was
used in the first electrophysiological demonstrations of
opto-genetics in the primate (19, 61), as well as to what has been used
for optogenetic modulation of superficial cortical neurons through
a window on the brain (62, 63). However, it is much lower than
subsequent primate studies that reported behavioral changes using
maximal light power densities ranging from several hundred
mil-liwatts per square millimeter to
>10 W/mm
2(11
–
15, 49).
Opsin Expression and Optogenetic Inactivation.
We injected an
adeno-associated viral vector containing Jaws and a human synapsin
promoter (AAV8-hSyn-Jaws-GFP) into regions of FEF where
electrical microstimulation evoked saccades with eccentricities of
∼
10° in both monkeys based on their individual mappings (
SI
Appendix
, Fig. S1
). Histology from the center of the injection
site showed
∼
90% expression (1,523 of 1,660 neurons) (
SI Appendix
,
Fig. S13
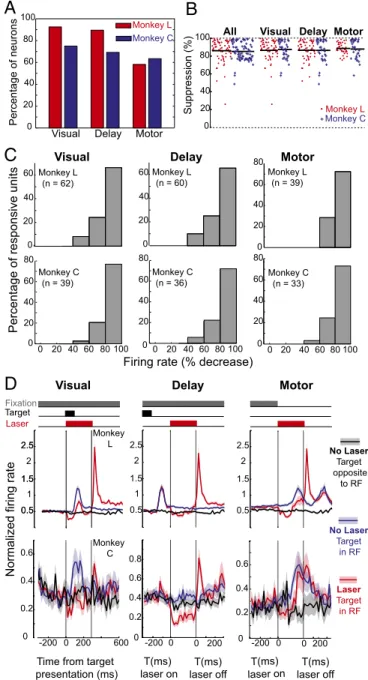
). We recorded neurons representing all three FEF response
profiles (visual-, delay-, and motor-responsive units) (Fig. 4A), and
the firing rate of nearly every neuron was suppressed (Fig. 4
B
and
C). We compared the difference in the firing rate distributions for
laser and control trials at equivalent trial times. Of all recorded
neurons with visual, delay, or motor activity, 89.6% in monkey L (60
of 67) and 69.2% in monkey C (36 of 52) had a significant decrease
in firing rate during the period of illumination. The decrease in firing
rate was significant for all subtypes of neurons (visual, delay, and
473 nm
0.5 1 1.5 2 2.5
0 0.1 0.2 0.3 0.4 0.5 0.6 0.7 0.8 0.9 1
Distance from light source (mm)
Fraction light power remaining
Mean light fall off with standard error
532 nm
635 nm
Fig. 2. In vivo measurement of visible light propagation. Average light
decrease with distance from the illuminator: mean normalized fluence rates representing the fraction of applied light power reaching a given depth for blue (473 nm), green (532 nm), and red (635 nm) light as a function of dis-tance from the illuminator with SE bars. (For blue, green, and red:n=5,n=
6, andn=5 mice, respectively).
atc be t
C Patch cable Mating sleeve Illuminator & ferrule
Core Core
Cladding Standard fiber Illuminator
Mean LFP Values for Illuminated Channels
6 7 8 9 10 11
12
13
14
15
16
Time (ms) rel. to laser onset
Relative LFP
amplitude
Channel Laser on
Time (ms) rel. to laser onset -400 -200 0 200 400 600 800 1000
0 50 100 150 200 250 300 350 400 450
Laser on
Ch. 15
Ch. 14
Ch. 13
Ch. 12
Ch. 1
1
Ch. 10
0.1 mm 1 mm
0.25 mm
Conventional fiber
Illuminator
0.4 mV 200 ms Conventional
100 mW /mm2
Injection site Illuminator
trajectory
Electrode trajectory
Illuminator 1 mW /mm2
C
A
E
B
D
F
G
H
Fig. 3. Illuminator broadly distributes light toin-hibit a large volume of primate cortex. (A) Illumina-tor and conventional fiber with the same diameter and material. (B) Etched core and cladding spread light broadly. (C) Light-emitting, 5-mm-long etched tip. (D) Optical fiber/mating sleeve/illuminator in-terface. (E) Illuminator and conventional optical fi-ber with equal total input light powers in 1-in. cubic brain phantom (1.75% agar). (F,Left) Coronal MRI from monkey L with a grid in the recording chamber (yellow lines). (F,Right) Enlarged view with an illu-minator and electrode trajectories (1 mm apart), es-timated virus injection region, and recording locations. (F,Right) The width of the chamber out-lined with yellow lines is 1 in (25 mm) in diameter. (F,Left) The electrode and illuminator trajectories shown with red and white lines, respectively, are 1 mm apart. (G) LFP light artifact at 0.5-mm–spaced contacts. (H) Raster plots of corresponding neurons. ForGandH,n=462 trials.
NEUROSCI
ENCE
PNAS
regardless of whether or not the target was in the receptive field or
opposite to it (Fig. 4D). In response histograms averaged for the
entire population of cells, the firing rate decreased significantly with
illumination (P
<
1e-10,
t
test;
n
=
67 for monkey L and
n
=
52 for
monkey C;
α
=
0.95).
As is common with halorhodopsins (64
–
71), we also observed a
small and transient postinhibition
“
rebound,
”
which was more
pronounced in monkey L. The morphology of waveforms was
generally consistent before illumination, during illumination,
during the rebound, and after the rebound (
SI Appendix
, Fig. S14
).
To quantify the rebound, the average number of spikes in the
50-ms period from 20 50-ms after the end of the laser pulse to 70 50-ms
after the end of the laser pulse was measured and averaged across
all trials for each condition (including control trials with a sham
shutter), neuron, and monkey. For each monkey and neuron, the
average firing rate for laser conditions during the delay period was
compared with the average firing rate during sham/control
con-ditions. There was a significant difference in firing rate during the
rebound period across conditions for 64 of 68 neurons for monkey
L (P
<
0.05/68,
t
test) and 51 of 79 neurons for monkey C (P
<
0.05/79,
t
test). For each neuron, the average number of spikes in
the rebound period across conditions for laser and control trials
was taken by weighting the per-condition averages by the
fre-quency of each condition and calculating the weighted mean. The
average number of spikes during this period in the laser trials was
subtracted from the average number of spikes during the rebound
period in control trials to yield the average increase in the number
of spikes in the rebound period for each neuron. On average, less
than one additional spike occurred per trial during the rebound
period in both monkeys (monkey L: mean
±
SD
=
0.965
±
0.878
spikes per period and monkey C: mean
±
SD
=
0.350
±
0.825
spikes per period). The extent of the rebound was not correlated
with the extent of silencing in either monkey L (r
=
0.1594,
P
=
0.1942) or monkey C (r
=
−
0.0318,
P
=
0.7868).
For target period illumination in monkey L, the transient
re-bound firing after the illumination period was followed by elevated
firing for up to 400 ms, compared with the control trials (Fig. 4C).
This elevated firing was measured in a window from 360 to 700 ms
after illumination, which encompassed the period after rebound
before the randomly timed go-cue on all trials. The firing rate was
significantly larger during correct illumination trials compared
with correct control trials (P
<
1e-12,
t
test;
α
=
0.95). There was
also a small but significant increase for the correct versus incorrect
laser trials during this period (P
=
0.018,
t
test;
α
=
0.95). Despite
these findings in monkey L, there was never a significant
differ-ence in the firing rate after rebound for monkey C.
Behavioral Testing.
Both monkeys were trained to perform a
mem-ory-guided saccade task. After injection and expression, we
illumi-nated FEF neurons to suppress them during specific epochs of the
memory-guided saccade task (Fig. 1). Error rates (e.g., failures to
execute memory-guided saccades to the proper target location)
sig-nificantly increased with illumination in both monkeys for targets
corresponding to neurons with receptive fields at the site of injection,
but not for targets opposite to the site of inactivation (Fig. 5A). In
both monkeys, error rates increased significantly (P
<
0.05/12
com-parisons,
χ
2analysis) during both the delay and go-cue illumination.
With illumination during the target period, error rates increased
significantly in monkey L in the injected receptive field (P
<
1e-9,
χ
2analysis) but not opposite to it (P
=
0.38,
χ
2analysis). In monkey C,
there was no significant change in error rate on target illumination
trials (injected receptive field:
P
=
0.048,
χ
2analysis; opposite
receptive field:
P
=
0.81,
χ
2analysis), but there was a significant
increase in saccade latency on correct trials to the target (Fig. 5D)
(P
=
0.0076,
t
test) on those trials. The increase in latency without an
increase in errors may derive from a latency/error tradeoff (2).
There was also a significant decrease in saccade latency to the
opposite hemifield for monkey L with illumination during the
target (P
=
0.0007,
t
test) and delay (P
=
0.0014,
t
test) periods
(Fig. 5D). Pharmacological FEF inactivation studies reported
premature saccades (i.e., correctly targeted saccades initiated
before the go-cue) to targets ipsilateral to the injection
hemi-sphere (2). We observed premature saccades in monkey C (Fig.
5B) but not in monkey L. Premature saccades were not rewarded
despite reaching the proper location. It seems likely that the
decreased latency for saccades to the opposite hemifield seen in
0 20 40 60 80 100 All
Suppression (%) Monkey L
Visual Delay Motor
Monkey C
Fixation Target
Laser
Monkey L
Time from target presentation (ms)
-200 0 200 600 Monkey
C
0 0.2 0.4 0.6
No Laser Target opposite
to RF
0 0.2 0.4 0.6 0.8
-200 0 0 200 0
0.2 0.4 0.6
Visual
Delay
Motor
Visual Delay Motor
0 20 40 60 80 100
Monkey L
Monkey C
Percentage of neurons
Monkey L (n = 62)
Visual
Percentage of responsive units
Monkey C (n = 39)
Monkey L (n = 39)
0 20 40 60 80
Monkey C (n = 33) Monkey L
(n = 60)
Delay
0 20 40 60
Monkey C (n = 36)
0 20 40 60 80 100
Motor
0.5 1 1.5 2 2.5
B
C
D
0 20 40 60 80
No Laser
Target in RF
Laser
Target in RF
0 20 40 60 80 100
Firing rate (% decrease)
0 20 40 60 80
0 20 40 60 80 100 0
20 40 60 80 0 20 40 60
Normalized firing rate
0.5 1 1.5
2 2.5
0.5 1.5 2.5
0.5 1 1.5
2 2.5
-200 0 0 200
T(ms) laser on
T(ms) laser off
T(ms) laser on
T(ms) laser off
A
Fig. 4. Nearly universal inactivation of FEF neurons during the memory-guide
monkey L and the premature saccades seen in monkey C are
both adaptations to an underlying disruption of saccade control.
Finally, increased saccade end-point scatter has been reported
with pharmacological inactivation of the FEF (5) and was also
observed with optogenetic inactivation here (Fig. 5C). A Student
’
s
t
test was performed comparing scatter for control conditions at a
given site with scatter for target, delay, and go-cue illuminated
trials at the same site. End-point scatter for targets in the injected
receptive field significantly increased for all illumination
condi-tions in both monkeys (Bonferroni correction for 95% significance
with 12 comparisons,
P
<
0.05/12). For monkey L,
P
=
8.3e-35,
2.5e-19, and 1.3e-34, and for monkey C,
P
=
0.004,
P
=
0.001, and
8.5e-4 for target, delay, and go-cue illumination, respectively, on
the injected side. There was no significant change in starting point
scatter with illumination in either monkey at any condition.
Gen-erally, there was no significant increase in scatter to targets on the
opposite side, except for a slight increase in scatter with
illumi-nation during the delay period for monkey L (P
=
0.0012). Scatter
plots of all saccade end points are shown in
SI Appendix
, Fig. S15
.
Discussion
In summary, we obtained large behavioral changes and nearly
universal neuronal inactivation over 10 mm
3of cortex by
illumi-nating 100-fold more tissue at light power densities two- to 100-fold
lower than those light power densities previously reported. Behavioral
impairments were found during all three phases of the task (target,
delay, and saccade periods), suggesting that the FEF makes a
contribution to each phase.
The large behavioral changes likely result from several key
advances. First, although earlier primate optogenetics studies
reported significant firing rate changes in only 38
–
68% of
neu-rons, all within 400
μ
m to 1 mm of the light source (14, 18, 19),
we found inactivation (>80% firing reduction) over a volume
(>10 mm
3) comparable to the inactivated tissue volumes in
cooling (1) and pharmacological inactivation studies (2, 3, 7, 72),
which silence 80
–
100% of neurons to
<80% of baseline over 4.2
–
14 mm
3. Second, in contrast with previous studies of inhibitory
opsins in primate cortex (14, 18, 19), which report a
sub-population (
∼
10
–
25% of the total cells) that increases its firing
rate during illumination (14, 18, 19) and potentially cancels the
effects of inhibition on behavior, not a single neuron in this study
increased its firing rate in response to illumination. Optogenetics
studies of excitatory opsins have reported similar heterogeneity
(17). Finally, we kept heating effects as small as possible, which
might have contributed to the heterogeneous neuronal effects in
prior studies. This study enables optogenetic silencing to be
applied to a wide variety of primate behavior studies and may
Opposite Injected0 5 30 40
% inc
orr
ec
t or no saccade
Monkey L
No Illumination Target Delay Go-Cue Opposite Injected
0 2 4 6 8
Saccade error rate
Monkey C
. . .
**
**
**
*
*
**
**
*
p < 0.05, χ2 test**
p < 0.05 / 12 (Bonferroni correction)No laser Target Delay Go Cue -20
-15 -10 -5 0 5 10
Change in latency (ms)
w/ std. error
Normalized saccade latencies (correct trials)
No laser Target Delay Go Cue -10
-5 0 5 10 15 20
Monkey L Monkey C
* *p = 0.0076
* **
*p = 0.0007 **p = 0.0014
Opposite
Injected
A
D
2% 4% 6% 8% 10% 12% 14%
Premature saccade rate
***
Opposite Injected Monkey C *** p < 1e-7, χ2 test
Opposite Injected 0
1 2 3 4 5 6 7
degrees
Saccade end-point scatter
0 0.4 0.8 1.2 1.6 2
Monkey L Monkey C
Opposite Injected
* ** ***
* p = 0.0040
** p = 0.0011 ***p = 0.0008 * p = 8.3 x 10⁻³⁵
** p = 2.5 x 10⁻¹⁹ ***p = 1.3 x 10⁻³⁴
+ p = 0.0012
***
** *
+ ***
Premature saccades
B
C
Fig. 5. Optogenetic inactivation significantly
in-creases error rates and alters saccade metrics. (A) Error rates increased significantly during delay and motor illumination. During target illumination, be-havioral disruptions along the error/latency contin-uum included increased error rates (monkey L) and increased saccade latency. (B) Monkey C made many premature saccades. Data from monkey L are not shown because monkey L did not make any pre-mature saccades. Allnvalues are given as the num-ber of premature saccade trials divided by total trials for that condition [no illumination:n=9/611 (In-jected),n=14/592 (Opposite); Target:n=0/272,n=
13/315; Delay:n=29/284,n=58/317; Go-Cue:n=4/ 287, n = 8/290]. Premature saccades were not rewarded despite reaching the proper location. They likely reflect similar neuronal mechanisms to the decreased latency observed for targets to the oppo-site side in monkey C. (C) End-point scatter signifi-cantly increased for targets in the injected receptive field for all illumination conditions in both monkeys, a finding reflecting overall disruption of saccades and consistent with early primate FEF inactivation studies [monkey C: control trials:n=409 (Injected), n=403 (Opposite); Target:n=207,n=219; Delay: n=176,n=206; Go-Cue:n=201,n=208; monkey L: control trials:n=1,470 (Injected),n=1,500 (Oppo-site); Target:n=187,n=174; Delay:n=167,n=
153; Go-Cue:n = 153, n =160]. Mean end-point scatter is plotted with SE bars, and uncorrectedP values (two-tailed Student’s ttest) are shown. (D) Average latency for correct nonlaser trials was sub-tracted from the latencies for correct trials with il-lumination during the target, delay, or go-cue period for both monkeys to yield the average change in latency, plotted with SE bars [monkey C: control tri-als:n=401 (Injected),n=393 (Opposite); Target:n=
175,n=215; Delay:n=193,n=198; Go-Cue:n=
214,n=198; monkey L: control trials:n=1,348 (Injected),n=1,466 (Opposite); Target:n=167,n=
169; Delay:n=156,n=142; Go-Cue:n=137,n=
153]. Latency significantly increased during the target period for monkey C, which is consistent with the latency/error continuum. The optogenetic behavioral disruption during target presentation, which resulted in an increased error rate in monkey L, manifested itself differently in monkey C, as an increase in the latency of correct trials. As expected, we do not see an increase in the latency of correct trials for conditions where the error rate significantly increased. This figure also shows a significant decrease in saccade latency to the opposite hemifield with illumination for monkey L, a finding manifested as an increased premature saccade rate in monkey C.
NEUROSCI
ENCE
PNAS
Chrimson, for optogenetic activation in primate behavior (73).
Technological Advances.
The size of the primate brain has limited
the efficacy of primate optogenetics up to this point because most
primate neuroscience research, and eventual human translation,
requires inactivation of large brain volumes. For example, Ohayon
et al. (14) expressed the green-light
–
sensitive, inhibitory opsin
ArchT in the FEF of monkeys and reported no behavior change,
no bias of saccadic eye movements, no significant change in saccade
direction during combined electrical and optical stimulation, and
no change in saccade latency despite 68% of neurons being
mod-ulated
<1 mm from the light source. Here, the key difference seems
to be inactivation of a larger tissue volume (i.e.,
∼
10 mm, based on
our electrophysiological recordings and modeling).
We present an illuminator that, based on our recordings and
models, delivers light over 10 mm
3, which is a volume at least an
order of magnitude larger than any prior tools with equivalent
penetration damage. Further, the tools presented here optimize the
wavelength of light, based on actual measurements from the living
brain, and control for heating. Previous studies, which used perfused
brain preparations or synthetic brain tissue phantoms (53),
under-estimated tissue absorption for 200
–
600 nm (blue and green) light
propagation. Specifically, we report absorption coefficients two- to
threefold larger than the largest reported in a recent study of fresh
and frozen brain slices (30) and about 10-fold larger than the values
that Yaroslavsky et al. (29) reported based on measurements taken
in postmortem human tissue. Unfortunately, the ex vivo values of
Yaroslavsky et al. (29) have been used widely in the optogenetics
literature (26, 28, 53, 74
–
78) because, before the present study,
techniques were not available for in vivo measurements of light
propagation in living brain tissue across the full spectrum of visible
light. The absorption coefficient that we determined for red light
falls squarely within the range of reported values from extracted
tissue and one in vivo study (i.e.,
μ
a=
0.20
–
4.5 cm
−1) (29, 30, 79
–
83).
To limit penetration damage to the FEF, temperature
mea-surements were performed in mice. We assume that heat
dissi-pates more rapidly in primates than in mice due to the larger
brain volume over which heat can diffuse, the lower baseline
body temperature, and the presence of a large craniotomy
through which electrodes and the illuminator are lowered in the
monkey. Thus, our heat measurements, if anything, err on the
conservative side of overestimation. Vascular densities,
impact-ing light propagation, are similar between mice and monkeys.
Estimates of cortical fractional vascular volume (i.e., the fraction
of cortex occupied by blood vessels) range from 0. 4
–
3.6% in
mice (84), whereas the average fractional vascular volume in
macaque cortex was reported at 2.14%, ranging from 1.93
–
2.7%
across different layers (85). To address the thinner mouse cortex,
we stereotactically aligned the light source and the probe so that
they both remained in rodent gray matter throughout testing to
reflect the cortical primate targets.
Moving beyond the single-area behavioral manipulations shown
here, our tools are especially promising for circuit-level
opto-genetic studies. Inoue et al. (17) evoked saccades with illumination
of ChR2-expressing FEF projections in superior colliculus (SC),
despite small-volume illumination (<1 mm), large light powers
(<1,100 mW/mm
2), and heterogeneous neuronal response (64%
excited and 17% inhibited 0.2 mm away from the light source).
Even though the saccades in the study by Inoue et al. (17) study
were slower, less consistent, and of smaller amplitude than
elec-trically evoked saccades, the demonstration of circuit-level
ma-nipulation in combination with the tools presented here opens the
door to many new advances in the study of primate neural circuits.
Rebound.
We found a rebound in firing rate at the end of the
illumination period, which was more pronounced in one of the
two monkeys. A recent study suggests that it may be possible to
tion over hundreds of milliseconds) to lessen postinhibition
re-bound firing, if desired The rere-bound spikes appear to be far
fewer than needed to induce a saccade in the FEF, and are even
fewer than the briefest FEF microstimulation bias we could
find in the literature (86, 87), where 20 ms of 200-Hz
micro-stimulation (four pulses) was required to enhance V4 firing
statistically in response to visual stimuli and yet no change in
behavior resulted. Thus, it seems unlikely that the rebound
played a role in the behavioral effects. In monkey L, the firing
rate remained elevated after illumination in the target and delay
trials. In monkey C, the postillumination firing rate did not
re-main elevated beyond the brief rebound. Because this firing rate
elevation was only seen in monkey L and did not persist after the
trial, it seems likely to be caused by the monkey
’
s attempted
compensation for the reduced target response.
Behavioral Effects.
The fraction of cells inactivated, the volume of
inactivation, and the decrease in firing rate of individual cells are
comparable between our transient inactivation and prior
phar-macological inactivation, cooling, and lesion studies. Our 300-ms
optogenetic inactivation will likely generate different types of
errors than inactivation lasting hours or more because, in our
experiments, inactivation is too transient for circuit-level
com-pensatory mechanisms to come into play. However, a
pharmaco-logical inactivation study by Sommer and Techovik (2) reports an
increase in the frequency of no-saccade trials from 9% (before
injection of muscimol) to 20% (during injection), which is
com-parable to the change in our total error rate levels. In monkey C,
where the baseline error rate was low, we saw a two- to fourfold
increase in errors (a raw increase of 2.78
–
6.77% incorrect). In
monkey L, where the baseline error rate was high even before virus
injection, there was a 1.45- to 1.76-fold increase (a raw increase of
11.9
–
20.3% incorrect). This task was more difficult for monkey L
than monkey C even without illumination, which may have
af-fected performance during the optogenetic inactivation. Each
an-imal adopts strategies to maximize reward. With different baseline
levels of performance ability, the monkeys may have different
levels of behavioral adaptation to optogenetic manipulation.
Further, we observed synergistic effects between error rate and
latency, and between latency and premature saccades. A pioneering
primate optogenetics study (15) in the superior colliculus noted
changes in saccade metrics (latency, velocity, and end points)
without behavioral performance changes, implying that these
met-rics are altered at lower levels of inactivation than are needed to
disrupt behavior. Previously, we have not had the means to
in-activate with the temporal specificity seen using optogenetics. Now,
with slightly different inactivation levels, we can tease apart related
behavioral continuums. For example, increased saccade latency and
saccade errors form a continuum, with the lowest levels of
in-activation increasing latency and the highest levels of inin-activation
causing errors. Because the optogenetically driven increase in error
rate limits the pool of trials available for latency analysis, we did not
expect increased latency for conditions in which the error rate
in-creased with illumination, which is what we observed.
Finally, the decreased contralateral saccade latencies in monkey L
and the increased premature saccade rate in monkey C may indicate
disruption of similar neural mechanisms (i.e., the reciprocal
trans-callosal FEF projections, through which one FEF inhibits the other),
which may underlie both premature saccades and decreased
contra-lateral saccade latencies. Thus, similar to the continuum of increased
saccade latency and increased error rate on the injected side,
de-creased saccade latency and premature saccades on the opposite side
may represent another continuum of inactivation-driven effects.
Methods
on Animal Care. Two adult, male rhesus monkeys (Macaca mulatta) weighing 13–16 kg were used for the behavioral study. Sixteen male C57BL/6J mice (Taconic) aged 8–16 wk were used for light power measurements (n=5 for 473 nm,n=6 for 532 nm, andn=5 for 635 nm).
Implantation.Anatomical MRI was performed preoperatively to determine stereotactic coordinates for chamber placement. All surgical procedures were carried out under anesthesia and aseptic conditions. Intraoperative i.v. an-tibiotics, fluids, and antiinflammatories, as well as postoperative antibiotics and analgesics, were administered, as needed. A recording well (19-mm inner diameter; Crist Instruments Company) over one FEF and a titanium head post were implanted surgically under aseptic conditions. A craniotomy was made inside the chamber.
MRI.Additional anatomical MRI was performed on each monkey. A custom ultem recoding grid with 1-mm hole spacing was placed in the chamber and filled sterile surgical lubricant (SurgiLube) to allow for grid visualization. A screw on the side of the chamber fit into a notch on one side of the grid to ensure consistent orientation across all imaging, procedures, and testing sessions. MRI was processed offline using software (Amide).
Microstimulation.During awake testing, anx–ystage (NAN Instruments) was fixed in a consistent orientation over the recording chamber with the grid. Microdrives (NAN Instruments) were mounted on thex–ystage and used for microstimulation; electrophysiological recording; and, later, for in vivo illumi-nation. To locate the FEF precisely within the craniotomy, a 220-μm, parylene-coated, tungsten microelectrode (Nimer Lab; WeSense) was lowered to depths spanning the thickness of cortex through the ultem grid. One grid hole per day was tested. The FEF was defined as the region of cortex in the vicinity of the principal and arcuate sulci, where fixed-vector saccades could be evoked with a current of<150μA at least 50% of the time. Here, the monkey per-formed a central fixation task while seated 57 cm in front of a cathode ray tube (CRT) computer monitor (resolution: 1,024×768 pixels, refresh rate of 75 Hz). A video-based eye tracking system (Eye Link II; SR Research) tracked eye position (250 Hz). Between trials, electrical stimulation was triggered manually via a digital stimulator (WPI) and stimulus isolation unit (WPI). A train of 100 bipolar pulses was applied with a frequency of 250 Hz and a total pulse width of 0.2 ms (0.1 ms depolarization followed by 0.1 ms hyperpolarization) via the microelectrode. Applied currents ranged from 10–300μA. Electrical current output was constantly monitored with an oscilloscope. This study specifically sought to find areas of the FEF in which microstimulation evoked visual saccades with eccentricities of∼10 visual degrees.
Electrophysiology and Data Collection.In monkey C, a single-contact, 220-μm, parylene-coated, tungsten microelectrode (Nimer Lab) was lowered into the cortex with a microdrive through a 25-gauge guide tube that just penetrated the dura. In monkey L, a 16-channel, multisite, linear electrode (U-Probe; Plexon) was used instead of the single-contact electrode to allow for better characterization of neuronal populations with fewer penetrations. The electrode, which was lowered and driven in the same way in both primates, was coupled to a pre-amplifier (Plexon) via a head stage (Plexon) and an electrical connector (Omnetics). Spikes and LFPs were recorded using a multichannel acquisition processor (MAP) system or MAP box (Plexon). The output from each electrode was passed through a high-impedance head stage and then to a preamplifier, which split the data into spike channels (0.25–8 kHz) sampled at 40 kHz and LFP channels (0.7–170 Hz) sampled at 1 kHz. Preamplifier output went into the MAP box, where it was filtered and acquired using Rasputin (Plexon) software. Spikes were sorted offline using principal component analysis and manual waveform shape analysis (Offline Sorter; Plexon). Eye movements were tracked (EyeLink II) and recorded in parallel (MonkeyLogic; Plexon). Behavior codes generated in MonkeyLogic were a sent to the Plexon software in real-time via strobe codes. MATLAB (MathWorks) was used for further analysis and plotting.
Virus Injection.The grid holes and depths for virus injections were determined for each monkey using microstimulation and recording during a memory-guided saccade task. The injected locations were determined solely by the physiological map of each monkey. Virus injections were performed under general anesthesia. Dexamethasone was administered several hours before virus injection to prevent brain swelling and potentially improve neuronal virus uptake. The grid used during recording and microstimulation was placed in the recording chamber during the injection procedure. Injection syringes (10μL, gas-tight; Hamilton) were preloaded with 5μL of sterile silicone oil (Sigma) and mounted on a UMP3 microsyringe injector pump (WPI). To prevent air bubbles, the plunger was depressed until a bubble of silicone oil formed at the tip of the injection needle. Next, aliquots of virus (AAV8-hSyn-Jaws-GFP) were removed
from dry ice, quickly thawed on wet ice, diluted 1:10 with sterile PBS (pH 7.4; Life Technologies), centrifuged at 4 °C and 5,000 rpm for 5 min (Beckman Coulter Microfuge 22R Centrifuge, Beckman Coulter, Brea, CA), and loaded into the syringe at a rate of 1μL·min−1. To prevent air bubbles, syringes were
vi-sually inspected during loading and after loading. Experimenters forced a small amount of virus (∼0.1–0.3μL) out of the syringe until no more air bubbles were observed in the resulting virus droplet. The virus-loaded syringe was placed in the microsyringe injector pump on a stereotactic arm (Kopf) and aligned such that its trajectory moved directly along the desired grid hole to the target lo-cation. In both animals, the deepest site along each trajectory was injected first. The injection needle remained at each injection site for 2 min before it was retracted 0.6 mm to the next injection site. For the last, most superficial in-jection site along a given trajectory, the inin-jection needle remained in place for at least 20 min before it was removed from the brain. For monkey C, cortical trajectories along two adjacent grid holes were injected. Along one trajectory, 0.8μL of diluted virus was injected at each of five sites, and along a parallel trajectory 1 mm away, 0.8μL of diluted virus was injected at each of four sites. For monkey L, trajectories of cortex along three grid holes were injected. Along the first trajectory, 0.4μL was injected at each of eight sites. The amount of virus per site was reduced to maintain an equivalent total volume of virus across both monkeys. Along the second trajectory, 0.4μL of virus was injected at each of five sites spaced 0.6 mm apart. Along the third trajectory, 0.4μL was injected at each of five sites spaced 0.6 mm apart. Recording and testing began 71 d after injection for monkey C and 119 d after injection for monkey L. The delay was longer for monkey L due to scheduling and training issues.
Memory-Guided Saccade Task.Each monkey was seated 57 cm in front of a CRT computer monitor (1,024×768 pixels, 75 Hz). The MATLAB-based Monkey-Logic software suite controlled the task and recorded the eye position at 250 Hz using a video-based eye tracking system (Eye Link II). Before each testing session, an eye calibration was performed using the built-in function in the MonkeyLogic software. Both behavior monkeys were trained to perform a memory-guided saccade task (Fig. 1). The trial began with central fixation on a white spot (radius of 0.5 visual degree) for a randomly determined duration of 300–400 ms. Next, while the central fixation spot remained on the screen, a peripheral stimulus (also a white dot with a 0.5-visual degree radius) flashed for 100 ms in one of four (monkey L) or eight (monkey C) predetermined lo-cations, all with an eccentricity of 10 visual degrees (SI Appendix, Fig. S16). Target selection for a given trial was random. Both monkeys maintained central fixation during the stimulus flash and for another 500–1,100 ms until the central spot was extinguished. The disappearance of the central spot served as a“go-cue”for the monkey to make a saccade to the remembered location where the stimulus had flashed. Trials with premature saccade initi-ation were terminated. A juice reward was given for saccades with end points that fell within 3 visual degrees of the flashed stimulus. At one of three pos-sible points in each trial, a shutter (either the laser shutter or an identical
“sham”shutter) opened for 300 ms (Fig. 1). In a third of the trials, one of the two shutters opened at the same time as the peripheral cue appeared. In a different third of the trials, one of the shutters opened 200 ms after the pe-ripheral cue disappeared (during the delay period). In the final third of the trials, one of the shutters opened at the same time as the central fixation spot disappeared. The sham shutter was three times as likely to open as the laser shutter to allow enough time between laser trials to prevent tissue heating (i.e.,> 20-fold pulse duration) and also to improve the morale of the monkeys.
Illumination.The large-volume illuminator was lowered into the brain via a guide tube that penetrated the dura but remained just above the cortex. The electrode and illuminator were lowered into adjacent parallel grid holes lo-cated 1 mm apart. Whereas the electrode was lowered via a microdrive, the experimenter inserted the large-volume illuminator into the brain by hand because the illuminator is too flexible to be lowered into the brain by either an electromechanical or screw drive. Both the electrode and large-volume illuminator were retracted via a microdrive. A 635-nm, 500-mW DPSS laser (SLOC) and two identical mechanical shutters (Oz Optics) were controlled via transistor—transistor logic (TTL) pulses from a pulse generator (DS8000; World Precision Instruments, Inc.) with timing controlled by a computer running the MonkeyLogic software package. The laser was coupled to an electrically con-trolled mechanical shutter via a 200-μm-diameter multimodal optical. The shutter output was coupled to a different 200-μm multimodal diameter optical fiber (ThorLabs) and then to a large-volume illuminator via a ceramic sleeve (Precision Fiber Products, Inc.). Experimenters took several steps to ensure that the monkey could not observe any laser illumination. Any part of the optical fiber that extended into the primate box was shielded with light-absorbing, black electrical tape (3M). All of the hardware that interfaced with the optical fiber was shielded with optically absorbing, black-painted foil (ThorLabs), and
NEUROSCI
ENCE
PNAS
five red LEDs (DigiKey) was placed in the testing box and flashed continuously at 2.5 Hz (50% duty cycle), which prevented the monkey’s eyes from adjusting to darkness and served as an extra precaution against light leakage.
Analysis.A saccade error occurred when the monkey failed to make a saccade to the correct target. We specifically considered trials in which the monkey main-tained fixation until the central spot disappeared. If the monkey failed to move its eyes out of the central fixation window within 500 ms of the go-cue, a“no saccade”error occurred. If the primate attempted to make a saccade but did not move its eyes to the correct target location, an“incorrect”error occurred. If the trials did not end in an error or correct saccade, the monkey either did not ini-tiate the trial or broke fixation at some point during the task. To assess for statistically significant changes in error rates, we used a Pearson’sχ2test to
compare the expected errors for each monkey at each target location (de-termined from the randomly interleaved sham trials with a shutter but no illu-mination) with the observed errors for the same monkey at the same target location for all laser times. Specifically, we compared laser vs. no laser conditions in the injected receptive field against each other, and in a separate comparison, we compared laser vs. no laser conditions in the opposite receptive field.
For each neuron, the average firing rate (spikes per second) was calculated during the illumination period in laser trials and during the equivalent time period in control trials. A paired sample Student’sttest was performed on the average laser and control firing rates for all neurons (or subgroup of neurons) for each monkey. The change in firing rate with illumination was assessed in individual neurons as follows. The number of spikes during the illumination period (or control period) was calculated for each trial in each neuron. The firing rate was normalized based on the location of the target and the period of the trial in which the firing rate was measured (i.e., target vs delay vs. go-cue periods). Specifically, the average firing rate for the target location and task period for control trials was subtracted from the firing rate calculated during the test pe-riod for each trial. This difference was divided by the SD of the control trial firing rates for this testing period and target location. The distribution of normalized trial-by-trial firing rates for a given neuron without illumination was compared with the normalized trial-by-trial firing rates for a given neuron during illumi-nation. AnF-statistic was calculated for each comparison to determine whether the variances were equal at theα=0.95 level, and the appropriate Student’s ttest was applied to the distributions at a 95% confidence level.
Neurons were classified based on whether their firing rate increased at different task times. The firing rate of“visually responsive”neurons increased significantly when a target was presented in the associated receptive field. Specifically, in vi-sually responsive neurons, the firing rate in the period 50 ms to 200 ms after the presentation of the target was significantly higher than the baseline firing rate, 200 ms to 50 ms before target presentation. The firing rate of“delay-responsive” neurons increased significantly during the delay period (relative to the baseline). Specifically, delay-responsive neurons had a significant increase in firing rate for the period 350 ms to 500 ms after the target offset compared with the baseline firing rate (again determined from 200 ms to 50 ms before target presentation). A paired sample Student’sttest was used once again, with a significance level of 0.95. The firing rate of “motor-responsive”neurons increased during motor preparation. Each neuron was tested for a significant increase in firing at its preferred target location at each task time using a paired sample Student’sttest at a 95% confidence level. Motor-responsive neurons had a significant increase in the firing rate during the 100-ms window before the start of the saccade. The rate during this motor preparation period was compared with the firing rate calculated for the 100-ms window before the go-cue.
The number of spikes in the 50-ms period from 20 ms after the end of the laser pulse to 70 ms after the end of the laser pulse was measured and averaged across all trials for each condition, neuron, and monkey. This time period was used to exclude silencing while fully encapsulating the rebound for all neurons. The average number of spikes in this period was calculated for control trials that used a sham shutter as well. For each neuron, the average number of spikes in the rebound period across conditions for laser and control trials was taken by weighting the per-condition averages by the frequency of each condition and calculating the weighted mean. The average number of spikes during this period in the laser trials was subtracted from the average number of spikes during the rebound period in control trials to yield the average increase in the number of spikes in the rebound period for each neuron.
Large-Volume Illuminator Fabrication.A 22-gauge wire stripper (StripMaster) was used to remove the polyethylene jacket 15–20 cm from the end of a 250-μ m-diameter plastic optical fiber (Industrial Fiber Optics). A table vise clamp (Wilton) was locked onto the stripped end of the fiber while the experimenter held the jacketed end taut parallel to the floor (perpendicular to the vise). The stripped section of the fiber was thinned to a diameter of 60–100μm using the lower
holding the fiber taut, the experimenter removed heat and allowed the fiber to cool, which prevents the fiber from curling. Once the fiber cooled, the experi-menter gripped the fiber about an inch to either side of its thinnest point and pulled the fiber apart to create a tapered tip. Although this pulling technique requires some practice, particularly in regulating the heat to prevent the fiber from melting or curling, several members of the laboratory have mastered the technique in less than a day. Next, the tapered tip of the fiber was examined under a 4×dissection microscope (VistaVision). Fibers with forked or curled tips were discarded. To etch the tip to the desired length of light emission and to protect the rest of the fiber during etching, the length of desired light emission (typically 3–7 mm) was measured up from the tip and laboratory tape (VWR) was applied above that level. The exposed tip of the fiber was then uniformly etched on all sides using a 5-μm silicon carbide lapping sheet (ThorLabs) followed by a 3-μm aluminum oxide lapping sheet (ThorLabs). At the other end of the fiber, the 22-gauge wire stripper was used to remove about 5 mm of the jacket. This end was cut flat using a hot knife (Industrial Fiber Optics) and polished to a smooth finish using successively smaller fiber polishing sheets ranging from 5μm to 0.3μm (ThorLabs). A fiber microscope (ThorLabs) was used to ensure a smooth and uniform polish. The flat end of the polished fiber was inserted into a stainless steel ferrule with a 260-μm inner diameter (Precision Fiber Products) until it was flush with the coupling end of the ferrule. The fiber was then secured in the ferrule with plastic epoxy (Industrial Fiber Optics). Excess epoxy was re-moved after 12–24 h of curing. A dust cap (ThorLabs) was placed on the ferrule to protect the fiber. Detailed methods for large-volume illuminator quality control, isometric light probe construction and calibration, and planar illumi-nator construction are provided inSI Appendix.
In Vivo Light Measurements.Before surgery under isoflurane anesthesia, anal-gesics (buprenorphine, 0.1 mg/kg i.p.; meloxicam, 2 mg/kg i.p.) and an antiin-flammatory corticosteroid (dexamethasone, 1 mg/kg i.p.) were administered. A stereotactic, rectangular craniotomy (3 mm medial-lateral×2.5 mm rostral-caudal) was made in the left parietal bone with the rostral-medial corner 0.5 mm caudal and 0.5 mm lateral to bregma. To keep the cortical surface free from blood, a thin coat of transparent silicone (Kwik-Sil) was placed in a ring around the bony margins of the craniotomy, as needed, to prevent bleeding. The cra-niotomy was kept moist with saline.
Once the craniotomy surgery was complete, pentobarbital (50 mg/kg i.p.) was administered, and isoflurane anesthesia was removed 3–5 min later, depending on the depth of anesthesia. Mice remained anesthetized in the stereotax and on the heating pad throughout testing. Reflexes were tested regularly to en-sure an adequate depth of anesthesia. Supplementary pentobarbital (25 mg/kg i.p.) was administered as needed. Euthanasia was performed at the conclusion of testing. If bleeding onto the surface of the craniotomy was detected either pre- or postexperiment, the animal was excluded from this study.
The planar illuminator was lowered onto the surface of the cortex at the center of the craniotomy using a micromanipulator (Siskiyou). The isometric probe was mounted to a stereotactic holder (Kopf) and lowered from the left at a 28° angle through a channel in the custom aligner (SI Appendix, Fig. S6) so that the probe remained in the cortex throughout its trajectory. Ruby fluo-rescence was monitored in real time during lowering and retraction using the spectrometer and SpectraSuite software. Fluence rates were measured in 0.5-mm increments from 0.5 0.5-mm to 2.5 0.5-mm beneath the surface of the cortex. At each depth, continuous light pulses were applied via the planar illuminator at five different power densities in the range of calibration. Integration times ranged from 3–3,000 ms, with higher powers requiring shorter integration times. During a single pulse, the spectral output from the light probe was recorded at least 25 times for each applied light power density. The pulse durations ranged from 5 s to 20 s, depending on the integration time needed to avoid saturation. To minimize bleeding, the probe was not retracted until testing concluded. Offline analysis and plotting were performed in MATLAB.
Determining Coefficients from in Vivo Light Measurements.In the photody-namic therapy literature, in vivo light propagation measurements of red and infrared light are made several millimeters away from a small, narrow light source. This paradigm allows for absorption and scattering coefficients to be estimated using simple diffusion theory equations for isotropic point sources. For visible light of sub-red wavelengths, it is not feasible to use point source estimates because too little light reaches these distant points to get accurate measurements. Thus, this work uses a wide, collimated-beam estimate to determine scattering and absorption coefficients. For this work, a planar illuminator was used to approximate a wide, collimated-beam source.