Role of the chromatin landscape and sequence in
determining cell type-specific genomic glucocorticoid
receptor binding and gene regulation
Michael I. Love
1,2,*, Matthew R. Huska
1, Marcel Jurk
1, Robert Sch ¨
opflin
1, Stephan
R. Starick
1, Kevin Schwahn
1, Samantha B. Cooper
3, Keith R. Yamamoto
3,
Morgane Thomas-Chollier
4, Martin Vingron
1and Sebastiaan H. Meijsing
1,*1Max Planck Institute for Molecular Genetics, Ihnestrasse 63–73 14195, Berlin, Germany,2Department of
Biostatistics, University of North Carolina at Chapel Hill, NC 27599, USA,3Department of Cellular and Molecular Pharmacology, University of California, San Francisco, CA 94158, USA and4Computational Systems Biology, Institut de Biologie de l’Ecole Normale Sup ´erieure (IBENS), CNRS, Inserm, Ecole Normale Sup ´erieure, PSL Research University, F-75005 Paris, France
Received September 27, 2016; Revised November 03, 2016; Editorial Decision November 05, 2016; Accepted November 08, 2016
ABSTRACT
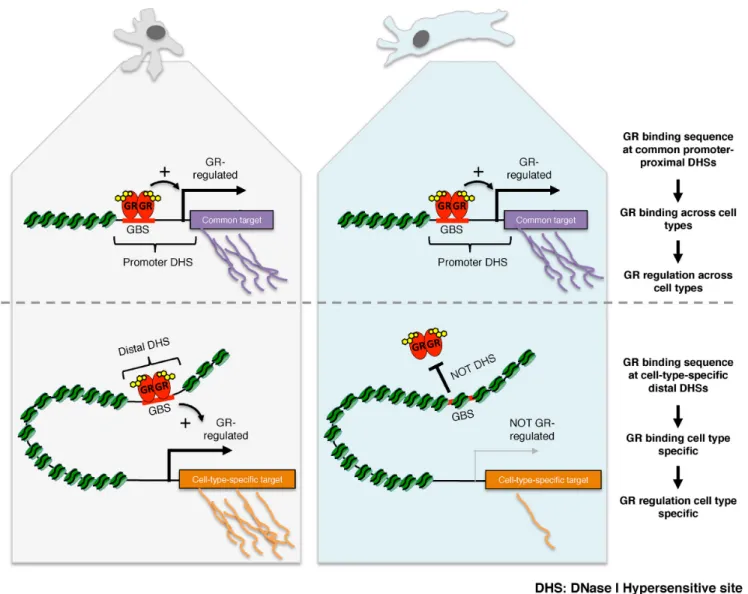
The genomic loci bound by the glucocorticoid recep-tor (GR), a hormone-activated transcription facrecep-tor, show little overlap between cell types. To study the role of chromatin and sequence in specifying where GR binds, we used Bayesian modeling within the uni-verse of accessible chromatin. Taken together, our results uncovered that although GR preferentially binds accessible chromatin, its binding is biased against accessible chromatin located at promoter re-gions. This bias can only be explained partially by the presence of fewer GR recognition sequences, arguing for the existence of additional mechanisms that interfere with GR binding at promoters. There-fore, we tested the role of H3K9ac, the chromatin feature with the strongest negative association with GR binding, but found that this correlation does not reflect a causative link. Finally, we find a higher per-centage of promoter–proximal GR binding for genes regulated by GR across cell types than for cell type-specific target genes. Given that GR almost exclu-sively binds accessible chromatin, we propose that cell type-specific regulation by GR preferentially oc-curs via distal enhancers, whose chromatin acces-sibility is typically cell type-specific, whereas ubiq-uitous target gene regulation is more likely to result from binding to promoter regions, which are often accessible regardless of cell type examined.
INTRODUCTION
Transcription factors (TFs) play a pivotal role in regulating the expression of genes by binding to genomic response el-ements. The recognition sequences for eukaryotic TFs en-coded within these response elements are generally short and degenerate (1). Consequently, only a fraction of all po-tential binding sites of a TF present in the genome is occu-pied. Moreover, for several TFs, the genomic binding pat-tern shows little overlap between cell types (2), further em-phasizing that the presence of a recognition sequence alone provides insufficient information to specify where in the genome TFs bind. Additional information is provided by the combinatorial architecture of response elements that typically harbor recognition sequences for multiple TFs. These TFs can, for example, act cooperatively, when the binding of one TF is stabilized by the presence of another, thereby influencing its genome-wide binding pattern (3,4). In addition to sequence, the local chromatin environment plays an important role in defining where in the genome TFs bind. For example, many TFs preferentially bind to re-gions of accessible chromatin as assayed by DNase I sen-sitivity assays (5). Accordingly, TF-bound regions are en-riched for histone modifications that are associated with ac-tive promoters (e.g. H3K4me3 and H3K9ac) and enhancer elements (H3K4me1 and H3K27ac) (6). Consistent with an important role for the chromatin environment in specifying where TFs bind, genomic TF binding site prediction ben-efits from incorporating both sequence and chromatin ac-cessibility data (7,8). Similarly, histone modification data is highly informative when predicting genomic TF binding (8). The dynamic nature of the chromatin environment pro-vides a mechanism to facilitate cell type-specific TF
bind-*To whom correspondence should be addressed. Tel: +49 30 84131176; Fax: +49 30 8413 1152; Email: [email protected]
Correspondence may also be addressed to Michael I. Love. Email: [email protected]
C
The Author(s) 2016. Published by Oxford University Press on behalf of Nucleic Acids Research.
ing. For example, regions of accessible chromatin show lit-tle overlap between cell types, especially regions that do not locate to the transcriptional start site (TSS) of genes (7,9). Similarly, binding of the glucocorticoid receptor (GR), a hormone-activated TF that predominantly binds to regions of open chromatin, shows little overlap between cell types (10,11). The cell type-specific binding of GR likely also ex-plains the limited overlap in genes regulated by GR when comparing different cell types ((12), this study) and thus could facilitate the diverse range of biological responses to glucocorticoid signaling ranging from gluconeogenesis in the liver, to the suppression of inflammation in chronic in-flammatory diseases like asthma.
Here, we set out to study the role of sequence and the chromatin environment in specifying the genomic loci oc-cupied by GR. Specifically, we explored available data from the ENCODE (13) and the Epigenomics roadmap (14) con-sortia regarding several histone modifications, the histone variant H2A.Z and DNase I sensitivity data in three cell types for which we have genome-wide GR occupancy data. Similar to previous studies (10), we find that GR predom-inantly (94%) binds to accessible (‘open’) chromatin dec-orated with histone modifications found at transcription-ally active regions. Since GR almost exclusively binds to open chromatin, we decided to focus only on the universe of DNase I Hypersensitive Sites (DHSs) to study the role of chromatin environment and sequence in specifying which of the open sites (GR binds∼15% of all DHSs) are bound by GR. We used a hierarchical Bayesian model to quantita-tively describe GR binding in several cell lines based on se-quence and chromatin features. The model is interpreted as an exploratory, hypothesis-generating step towards further investigation of how genomic sequence combines with cell type-specific chromatin state to produce a diversity of cel-lular responses to hormone. This approach uncovered that not all open chromatin is equal and that GR preferentially binds DHSs decorated with chromatin features found at enhancers, whereas binding at DHSs decorated with chro-matin features found at promoters was disfavored. Further, we found that the depletion of promoter–proximal binding could be explained in part by changes in sequence compo-sition, with fewer GR recognition sequences mapping to promoter–proximal DHSs. Together, our studies uncovered a preferential bias against promoter proximal GR binding, and we provide evidence that this may play a role in facili-tating the cell type-specific transcriptional consequences of GR signaling.
MATERIALS AND METHODS
Cell lines
Immortalized wild type mouse embryonic fibroblasts (MEFs) and GCN5/PCAF double knockout (dko) MEFs (15) were a kind gift of Kai Ge. Cells were grown in DMEM supplemented with 10% FBS. A549 cells were grown in DMEM supplemented with 5% FBS, whereas Nalm6 cells were grown in RPMI 1640 supplemented with 10% FBS.
Chromatin immunoprecipiptation (ChIP) and ChIP sequenc-ing (ChIP-seq)
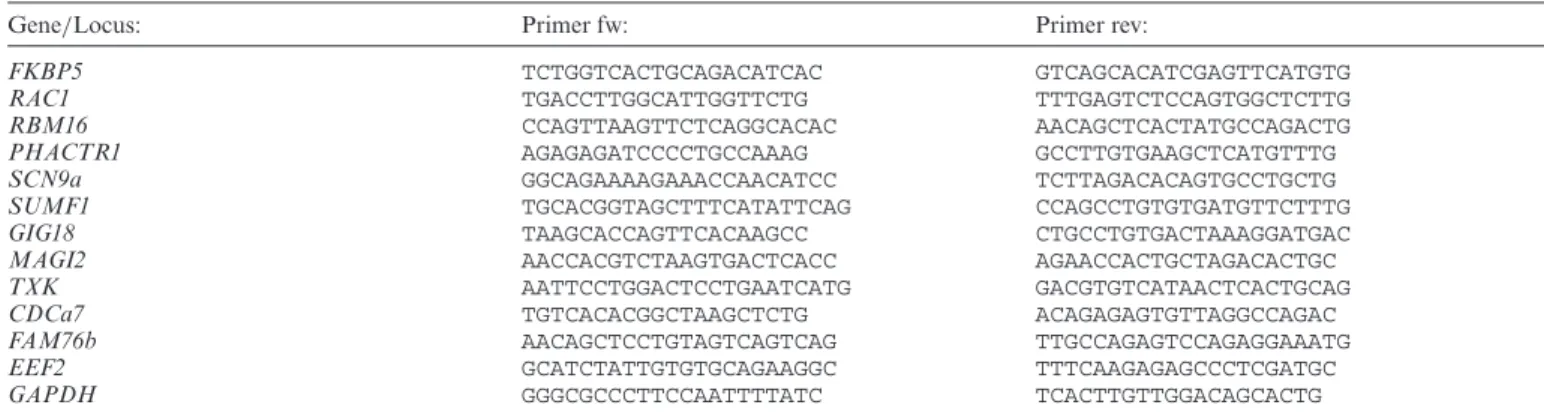
ChIP assays were done essentially as described using ei-ther the N499 GR-antibody ((16), 2l/ChIP) an H3K9ac antibody (C5B11, Cell Signaling, 6 l/ChIP) or as con-trol IgG (cat#: C15410206, Diagenode, 6 l/ChIP). For each ChIP assay, ∼5 million cells were treated with 0.1% ethanol vehicle or 1 M dexamethasone for 1.5 h. For ChIP-seq experiments, the material of multiple ChIP ex-periments was pooled to obtain enough material (∼10 ng) for library preparation. Primers used for qPCR analysis of ChIP experiments are listed in Table1.
Immunoblotting
Total protein isolated from equal amounts of cells were separated with SDS-PAGE gels, transferred to membranes and incubated with either anti-GR (N499, dilution 1:5000, (16)), anti H3K9ac antibody (C5B11, Cell Signaling, dilu-tion 1:1000) or anti-actin (Sc-1616R, Santa Cruz Biotech-nology, dilution 1:1000) antibodies followed by incubation with secondary antibodies conjugated with horseradish per-oxidase. Proteins were visualized using an ECL detection system (Amersham Biosciences).
DNase I assays
DNase I assays were done essentially as described (17) by growing MEFs or dko MEFs in six-well plates (500.000 cells/well), washing cells with PBS and scraping them into 1 ml DNase I buffer (20 mM HEPES pH 7.4, 0.5 mM CaCl2, 5 % glycerol, 3 mM MgCl2, 0.2 mM spermine, 0.2 mM sper-midine) plus 0.2% NP40 alternative. Nuclei from three wells were pooled, isolated by centrifugation and resuspended in 300l DNase I buffer containing 2g/ml RNase A. 55l aliquots were DNase I treated (or mock treated to normal-ize for the amount of chromatin in input) by the addition of 2.05l DNase I (Qiagen, 2.7 u/l) and then incubated at 37◦C for 10 min. The reaction was stopped by addition 1 ml stop buffer (50 mM Tris pH 8.0; 200 mM NaCl; 12.5 mM EDTA; 1% SDS, 200g/ml proteinase K) and samples were incubated at 65◦C for 4 h to remove proteins. Finally, DNA was purified using a PCR purification kit (Qiagen) and regions of interest were analyzed by qPCR (primers listed in Table1).
Computational analysis
Sequencing data.
ChIP-seq data GR. GR ChIP-seq data for GR (U2OS, IMR90, K562) were previously generated by us and de-posited at EBI ArrayExpress under accession number E-MTAB-2955 (18). ChIP-seq data for A549, Nalm-6 and MEFs were deposited at EBI ArrayExpress with this study under accession number E-MTAB-5113.
Table 1. qPCR primers used in this study (all target mouse)
Gene/Locus: Primer fw: Primer rev:
FKBP5 TCTGGTCACTGCAGACATCAC GTCAGCACATCGAGTTCATGTG
RAC1 TGACCTTGGCATTGGTTCTG TTTGAGTCTCCAGTGGCTCTTG
RBM16 CCAGTTAAGTTCTCAGGCACAC AACAGCTCACTATGCCAGACTG
PHACTR1 AGAGAGATCCCCTGCCAAAG GCCTTGTGAAGCTCATGTTTG
SCN9a GGCAGAAAAGAAACCAACATCC TCTTAGACACAGTGCCTGCTG
SUMF1 TGCACGGTAGCTTTCATATTCAG CCAGCCTGTGTGATGTTCTTTG
GIG18 TAAGCACCAGTTCACAAGCC CTGCCTGTGACTAAAGGATGAC
MAGI2 AACCACGTCTAAGTGACTCACC AGAACCACTGCTAGACACTGC
TXK AATTCCTGGACTCCTGAATCATG GACGTGTCATAACTCACTGCAG
CDCa7 TGTCACACGGCTAAGCTCTG ACAGAGAGTGTTAGGCCAGAC
FAM76b AACAGCTCCTGTAGTCAGTCAG TTGCCAGAGTCCAGAGGAAATG
EEF2 GCATCTATTGTGTGCAGAAGGC TTTCAAGAGAGCCCTCGATGC
GAPDH GGGCGCCCTTCCAATTTTATC TCACTTGTTGGACAGCACTG
2 (19) onto theMus musculusassembly mm9. Number of al-lowed mismatches was set to zero; length of seed substrings to align was set to 20; default setting were used for all other parameters. Peak calling was done using MACS2 (20) us-ing the input DNA from each respective cell line as control. Genome size was set to –mm; the keep-dup parameter to 1 and default was used for all remaining parameters. Peaks were called using a FDR cutoff of 0.01.
Overlap GR peaks between wild type and dko MEFs. The differential GR binding analysis between wild type and dko MEFS was done using the R package DiffBind (21,
http://bioconductor.org/packages/release/bioc/vignettes/
DiffBind/inst/doc/DiffBind.pdf.). Differentially bound
peaks where called using the Mann–Whitney-U test with a significance cut off of 0.05. For qPCR validation exper-iments, loci representing the three classes of GR binding sites: common, dko-specific and wt-specific where picked based on peak height (for common peaks we chose ones with high signal) and peak ratio (for dko- and wt-specific loci, we chose peaks with relatively large differences in peak height between dko and wt MEFs).
ChIP-seq data histone variants, histone modifications and TFs. ChIP-seq mapped sequencing data (BAM files) and annotated peaks from the ENCODE project (13) (A549, K562) were downloaded from the UCSC genome browser website. ChIP-seq data for IMR90 was from the Roadmap Epigenomics Mapping project (14) and down-loaded from the NCBI GEO website under the series number GSE16256. H3K9ac ChIP data from primary MEFs was accessed via GEO database series numbers GSM863802 and GSM863804.
The following files were downloaded from the ENCODE project’s Data Coordination Center FTP site and used for comparative analysis:
(http://hgdownload.cse.ucsc.edu/goldenpath/hg19/ encodeDCC/wgEncodeOpenChromChip/)
Pol2: wgEncodeOpenChromChipA549Pol2PkRep 1.narrowPeak ETS1: wgEncodeHaibTfbsA549Ets1V042 2111Etoh02PkIntersect.broadPeak
CEBPB: wgEncodeHaibTfbsA549Cebpbsc150V04221 11PkIntersect.broadPeak
FOXA1: wgEncodeHaibTfbsA549Foxa2V0416102Eto h02PkIntersect.broadPeak FOSL2: wgEncodeHaibTfbs A549Fosl2V0422111Etoh02PkIntersect.broadPeak
TCF12: wgEncodeHaibTfbsA549Tcf12V0422111Etoh0 2PkIntersect.broadPeak
DHS data. DNase I-seq mapped sequencing data (BAM files) from the ENCODE project (13) (A549, K562) were downloaded from the UCSC genome browser website. DNase I data for IMR90 was from the Roadmap Epige-nomics Mapping project (14) and downloaded from the NCBI GEO website under the series number GSE16256. The DHSs as annotated by the ENCODE project (13) were used to compare GR binding patterns at distinct genomic regions (promoters, exons, introns, distal) and are available from the UCSC Genome Browser as ‘narrowPeak’ files. DHS regions mapping to repeats (RepeatMasker (22) score
>1000, track downloaded from repeatmasker.org, Febru-ary 2012) were removed and resulted in 105 121 remaining DHSs for A549, 127 803 for IMR90 and 97 304 for K562 cells.
Motif score calculations
Motif scores were calculated using the GR motif MA0113.1 from the JASPAR database (23) and scanning both strands in a 160 bp range centered on the DHS peak. The maximum log odds score was assigned to each DHS location. Scan-ning was performed using the PWMscoreStartingAt func-tion of the Biostrings R/Bioconductor package (24), with a zero-order background model for DNA with 42% GC con-tent.
% Deviance explained by promoter proximity
rejected the null hypothesis that promoter proximity did not help to explain depletion of GR binding beyond the motif score (P<2×10⁻¹⁶).
Calculation of the overlap between GR peaks and DHSs
The overlap of GR peaks with DHSs (Figure1B) and the overlap of DHSs with GR peaks (Figure2A) was calculated using the GR peak regions as defined by the MACS2 soft-ware (20) for the IMR90 ChIP-seq data, and the DNase I regions reads from the following file for the IMR90 cell line as defined by the ENCODE project: DNase I: wgEn-codeOpenChromDnaseImr90Pk.narrowPeak
Calculation of the overlap with different functionally an-notated genomic regions for GR bound regions, GR-bound DHSs and all DHSs
The overlap of DHSs and GR-bound DHSs with promot-ers, exons, introns and distal regions (Figure3A) was calcu-lated using the genomic annotations defined by the Biocon-ductor package ‘TxDb.Hsapiens.UCSC.hg19.knownGene’ (24). Promoter regions were defined as ±2.5 kb from the TSS of a known gene. Because the genomic features can overlap, the following hierarchy was defined: (i) promoters, (2) exons, (3) intronic, (4) distal. In case a GR peak over-lapped multiple features, it was assigned exclusively to one category according to this hierarchy.
The overlap of TF peaks with promoters, exons, introns and distal regions (Figure3B) was calculated similarly, but using the ENCODE defined peaks from files downloaded from the Data Coordination Center FTP site.
Overlap MEF common, wt-specific, dko-specific map-ping to promoters (Figure5E): The overlap of MEF com-mon, wt-specific, dko-specific GR peaks is based on the same definition of promoter regions described above. A GR peak was considered to map to promoters when at least one promoter region overlapped the middle of the peak region.
Calculation of read count difference for histone marks
To compare the number of ChIP-seq reads within GR peak regions to random regions of the genome (Figure1C), we took the 1000 GR peak regions with the lowest p-value as calculated by MACS (20) and counted the reads within them for each of the histone modifications, DNase I and In-put, then took the median across all 1000 regions. We then defined a background set of non-peak regions by shifting each of the 1000 GR peak regions 5kb away in a random direction (upstream or down), counted the reads there and again calculated the median across all 1000 background re-gions. The ratio of these two medians (GR/background) was then calculated, converted to log2scale and plotted.
Average read count profiles for histone marks±2 kb from the center of DHS (Supplementary Figure S1) were calcu-lated using the R/Bioconductor GenomicRanges package (25), taking the average of read counts at each position rel-ative to the DHS center over the set of DHSs which over-lapped GR peaks, or the set of DHSs which did not overlap a GR peak.
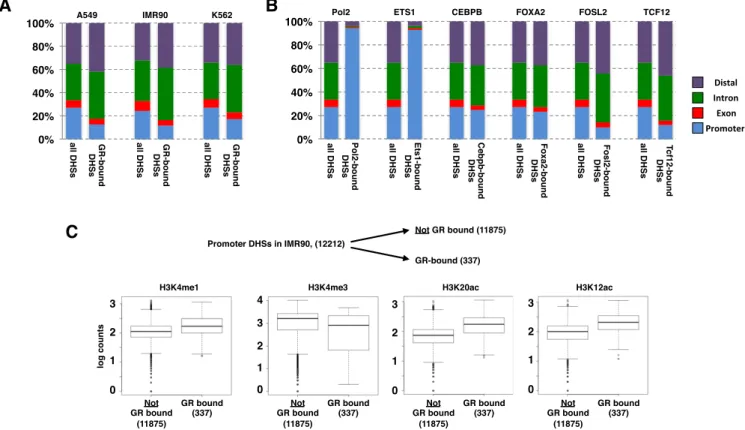
To compare GR-bound promoter DHSs with unbound promoter DHSs in IMR90 cells (Figure3c), reads from EN-CODE histone marks ChIP-seq experiments in IMR90 cells were counted using Bioconductor core packages in 1600 bp windows centered on promoter–proximal DHSs (DHSs within 200 bp of a transcriptional start site defined by Ref-Seq gene annotation). Shown are boxplots of log10 counts of reads across all DHSs, split by whether or not the DHS overlapped a GR peak as identified by MACS software (20). H3K9ac abundance for different classes of GR ChIP-seq peaks in MEFs (common, dko-specific and wt-specific) was computed from datasets GSM863802 and GSM863804 re-trieved from the GEO database. Both datasets were pooled for the analysis. To avoid biases from different widths of GR peaks, we set the width for each peak to 500 bp for each class of GR ChIP-seq peak (middle of peak region -249 bp, +250 bp). A single-end read from H3K9ac ChIP-seq was consid-ered to fall into the 500 bp GR peak region when at least 1bp overlapped.
Gene regulation and promoter–proximal binding
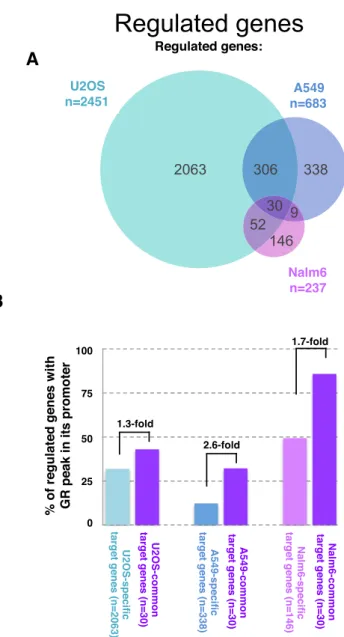
Microarray datasets for U2OS, A549 and Nalm6 cells com-paring dexamethasone treatment (1M, 3h) with vehicle control were downloaded from E-GEOD-38971 (EBI Ar-rayExpress) and processed as described previously (16). To call genes regulated upon treatment with dexamethasone, we used an adjusted p-value cut-off of 0.05 and 1.5 for the fold change (either up- or down-regulated). The overlap of the regulated gene sets between cell lines is visualized as Venn diagram (Figure6A). The percentage of genes with GR binding in the promoter was computed for cell type-specific genes and for genes regulated in all three cell lines examined (common target genes). Promoters were defined as regions ±2.5 kb around all transcript start sites anno-tated in the Ensembl database (grch37) of Homo sapiens genes, accessed via Bioconductor package BioMart (26). In case a gene had several transcripts, all of them were con-sidered. A gene was marked as having a GR peak in the promoter, if at least one of its promoter regions overlapped a GR peak position.
Hierarchical bayesian model
A hierarchical Bayesian model (27) was constructed to correlate binding of GR (as measured by ChIP-Seq read counts) with chromatin features and motif score in DHSs across experiments and across cell types. The log of read counts for various chromatin features plus a pseudocount of 1 and the motif score over the annotated DHSs of a cell type were arranged as columns of a matrix X (Figure
A
B
C
A
C
B
D
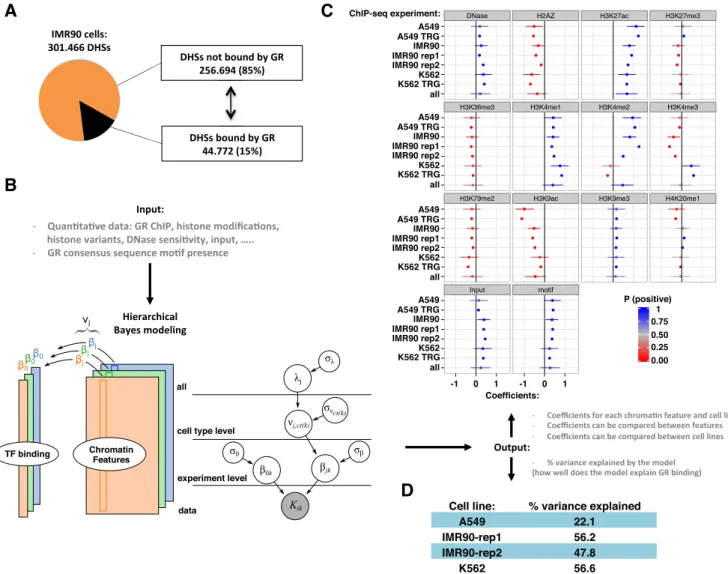
Figure 2. GR binding in the universe of open chromatin. (A) Pie chart showing the percentage of all DHSs in IMR90 cells occupied by GR (15%) in black. (B) Left: The hierarchical Bayesian model for a single cell type to model the read density of GR binding (tall colored columns), based on various chromatin features (colored rectangles). Right: The full hierarchical model. The grey node at the bottom indicates the data. As output, the model generates coefficients () for each chromatin feature and for each experiment. Experiments on the same cell type share a common effect (), and all cell types share a common effect. (C) Estimated coefficients for all levels of the model, with cell type, lab and replicate number indicated e.g. A549 TRG. The cell type parameters () are indicated with only the cell type e.g. A549. The parameteris labeled ‘all’. Dots mark the posterior mean; whiskers indicate the 95% quantile-based interval. P (positive) from 0 to 1 indicates the posterior probability of the coefficient having a positive impact on GR binding, according to the posterior distributions obtained from the hierarchical Bayesian model. (D) % variance explained by the model for each of the cell lines.
DHS, the count of GR ChIP-Seq reads was modeled as fol-lowing a Poisson distribution with a varying mean:
Kik∼Poisson (μik) log (μik)=β0k+Xi∗kβ∗k
The ‘*’ indicates iteration over all j explanatory features. The coefficient0kprovides a sample-specific intercept, or base level of GR ChIP-seq read counts. The coefficientjk is interpreted as the multiplicative effect of chromatin fea-ture j on the GR ChIP-Seq read counts for experiment k. A positive coefficient implies an inductive contribution to GR binding and a negative coefficient implies an inhibitory contribution to GR binding, while fixing the contribution of all other chromatin features.
We specify thatjkfor experiments k of the same cell type are related, with ct(k) denoting the cell type of experiment
k. These coefficients are given a shared prior meanj,ct(k), and experiment-specific variance2
:
β0k∼N
0, σ20
βjk∼N
νj,ct(k), σ2β
A
C
B
Figure 3. Genomic distribution of DHSs and of GR-bound DHSs. (A) Distribution of all DHSs and of GR-bound DHSs in cell lines as indicated relative to annotated genomic features (promoters:±2.5 kb from TSS; exons, introns and distal (rest)). (B) Same as for a) except that ChIP-seq peaks for TFs as indicated (A549 cells) were analyzed. (C) Comparison of GR-bound and unbound promoter DHSs in IMR90 cells uncovered that GR-bound regions have higher levels of enhancer-associated marks (H3K4me1, H3K12ac and H3K20ac) whereas levels for H3K4me3, a typical promoter mark, are lower when compared to their unbound DHS counterparts.
A
score
1
0.8
0.6
0.4
open proximal
open distal
open GR-bound proximal
open GR-bound distal
Cell line:
% deviance explained by promoter proximity while controlling for motif score:
A549 45
IMR90 52
K562 36
B
!" #!" $!" "
" "
A B
Compare genome-wide GR
binding patterns (ChIP-seq)
wild type MEFs
normal H3K9ac levels
GCN5/PCAF dko MEFS
reduced H3K9ac levels
3
2
1
0
FKBP5 RAC1 RBM16 PHACTR1 SCN9a SUMF1 GIG18 MAGI2 TXK
Percent input
MEF wt -H3K9ac MEF wt IgG MEF dko -H3K9ac MEF dko IgG
20 kb
Normalized reads
MEF wt MEF dko RAC1, GR ChIP-seq
MEF wt MEF dko SUMF1, GR ChIP-seq
MEF wt MEF dko
TXK, GR ChIP-seq
C
ChIP-seq GR D
200
1 200
1 200
1 200
1 200
1 200
1
MEF wt specific
MEF dko specific
common
MEF wt 1542 peaks
535 1007 4678
MEF GCN5/PCAF dko 5685 peaks
20
10
0 E
Percentage peaks mapping to promoters
common dko-specific wt-specific
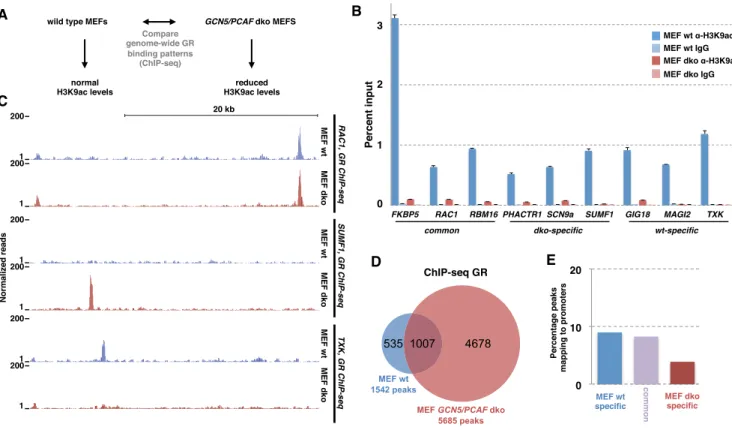
Figure 5.Functional analysis of the correlation between H3K9ac levels and GR binding: correlation=causation. (A) Schematic diagram depicting the design of the study to test if the correlation between H3K9ac levels and GR binding reflects a causative link. (B) Comparison of % input precipitated by ChIP with an H3K9ac-specific antibody versus IgG control at GR-bound genomic loci as indicated was assayed by qPCR (average enrichment + error from 7 pooled biological replicates) in either wild type MEFs (blue) or inGCN5/PCAFdouble knock-out (dko) MEFs (salmon). (C) Normalized tag density from ChIP-seq for GR after hormone treatment for wild type MEFs (blue) and dko MEFs (salmon) for genomic region nearRAC1gene: GR-bound in both wt MEFs and dko MEFS;SUMF1: dko-specific GR binding andTXK: wt-specific GR binding. (D) Venn diagram showing the number and overlap of GR-bound loci in wt and dko MEFs. (E) Comparison of the % of GR ChIP-seq peaks mapping to promoter regions for wt-specific, common and dko-specific peaks.
The parameters of the distributions for the main model coefficientsjkare themselves distributed as follows:
νj,ct(k)∼N
λj, σ2ν: ct (k)
λj∼N
0, σ2λ
σ0, σβ, σν:ct(k), σλ∼(α=10, β=10)
The termjgives the overall contribution of chromatin feature j on GR binding – across all cell types included in the hierarchical model. The zero-mean normal prior forj in practice produces a shrinkage of terms towards zero (no contribution to GR binding) unless the data provides evi-dence to the contrary.
The posterior of the model parameters conditioning on the observed data was sampled using the Stan C++ MCMC package and the rstan R package (28). The model was run for four chains for 4000 iterations (the first 2000 iterations discarded as burn-in) using the ‘no U-turn’ setting. R-hat values near 1 were used as a convergence diagnostic. Exam-ple code for the Bayesian model is provided as a separate supplementary file (bayes model Loveteal 2016.txt).
Variance explained by the hierarchical Bayesian model
An estimate of the percent variance of log-scale GR ChIP-seq read counts explained by the model was calculated by
squaring the Pearson correlation coefficient between the log observed signal and the log of the predicted GR read count for each DHS, using the coefficients estimated by the hi-erarchical Bayesian model. The estimated coefficients used for prediction were the posterior means from the Bayesian model.
RESULTS
GR preferentially binds accessible chromatin decorated with chromatin features associated with transcriptional activity
stud-!" #$" $!" %$" &!!"
2063 306 338
52 146
9 30
Regulated genes
U2OS n=2451
Nalm6 n=237
A549 n=683
A
Regulated genes:Nalm6 n=237
U2OS n=2451
A549 n=683
B
100
75
50
25
0 % of regulated genes with GR peak in its promoter
U2OS-specific
target genes (n=2063)
U2OS-common
target genes (n=30)
A549-common
target genes (n=30)
Nalm6-common
target genes (n=30)
A549-specific
target genes (n=338)
Nalm6-specific
target genes (n=146)
1.3-fold
2.6-fold
1.7-fold
Figure 6. Link between promoter–proximal binding and cell type-specific gene regulation by GR. (A) Venn diagram showing the overlap of genes regulated in response to dexamethasone between three cell lines: U2OS stably expressing GR, A549 and Nalm6 cells. (B) % of promoter regions with a GR-peak is higher for genes regulated across cell types than for cell type-specific target genes in all three cell types examined.
ies have shown that chromatin accessibility pre-determines GR binding patterns, with the majority of binding occur-ring at preexisting loci of accessible chromatin (10,29). Ac-cordingly, we found that the majority of GR binding in IMR90 cells (94%) overlaps with DHSs as annotated by the ENCODE consortium (13) (Figure 1A and B). Next, we compared the levels of chromatin features at GR-bound regions with those found at random genomic regions. As expected, this analysis showed that GR-bound regions have increased levels of DNase I sensitivity for each of the cell lines examined (Figure1C). Furthermore, the DHS signal displays a distinctive pair of peaks flanking the GR-bound regions for all enriched histone modifications (H3K27ac, H3K4me1/2/3, H3K9ac) with the exception of H3K4me3,
which showed a single peak overlapping the GR ChIP-seq peak (Supplementary Figure S1). The pair of peaks is in-dicative of GR binding in between nucleosomes, whereas the single peak for the H3K4me3 modification suggests that GR might bind on top of the nucleosome when this mod-ification is present (Supplementary Figure S1). No strik-ing enrichment at GR-bound regions was observed for hi-stone modifications associated with either transcriptionally inactive regions (H3K9me3 and H3K27me3) or with tran-scriptional elongation (H3K36me3, H3K79me2). Interest-ingly, we found that H4K20me1, a histone mark linked to transcription-linked histone turn-over (30) and Polycomb repression (31), showed a marked enrichment at GR-bound regions in IMR90 and K562 cells, whereas no enrichment was observed in A549 cells (Figure1C), indicative of a pos-sible role of H4K20me1 in generating cell type-specific GR binding patterns.
Hierarchical Bayesian modeling of GR binding within uni-verse of accessible chromatin
H3K4me1) and the GR motif score. Further, within the uni-verse of DHSs, GR preferentially binds to regions with high DNase I and input read counts. Within the model, the fea-tures are scaled to facilitate direct comparisons. Therefore, the similar positive values for the DNase I coefficient and the motif score coefficient indicate that they have a similar positive association with GR binding, whereas the highest positive coefficient is observed for H3K27ac levels indicat-ing that this feature is more important in quantitatively ex-plaining the level of GR binding than any other feature in-cluding motif score (Figure2C).
Four consistently negatively associated chromatin fea-tures are H3K36me3, H3K79me2, H2A.Z and H3K9ac. H3K36me3 is typically found along the gene body of tran-scribed genes and has been linked to suppression of cryptic transcription initiation (33). The negative association with GR binding may thus reflect a link between H3K36me3 lev-els and prevention of TF binding in transcribed regions. H3K79me2 is also enriched in the gene body of transcribed genes and linked to various biological processes includ-ing telomeric silencinclud-ing, DNA repair and cell cycle check-points (34), if and how this could be linked to GR binding however is unclear. The consistent negative association of H2A.Z with GR binding might at first appear incompatible with the findings reported by Johnet al. (29) that H2A.Z is highly enriched at GR binding sites. However, this study compared H2A.Z levels at GR binding sites with nearby re-gions that are not DHSs. Similarly, our genome-wide analy-sis (Figure1C) shows a strong positive correlation between H2A.Z levels and GR binding. In contrast, the hierarchi-cal Bayesian model presented here focuses only on the uni-verse of DHSs and suggests that of all accessible sites, GR preferentially binds DHSs with low H2A.Z levels. Similar to H2A.Z, H3K9ac is enriched at the transcription start site of genes (35) and we find that within the universe of DHSs, GR binding is associated with low levels of H3K9ac (Figure
2C). Interestingly, the coefficients of two chromatin features that show a strong association with GR binding, H3K4me2 and H3K4me3, have a different sign depending on the cell line examined. H3K4me2 is positively associated with bind-ing in A549 and IMR90 cell lines, whereas its negatively as-sociated in K562 cells. In contrast, H3K4me3 levels corre-late negatively with GR binding in A549 and IMR90 cells whereas they are a positive predictor of GR binding in K562 cells.
Together, our hierarchical Bayesian modeling of GR binding within the universe of accessible chromatin uncov-ered that GR preferentially binds regions with a recog-nition motif and chromatin marks associated with (ac-tive) enhancers. Further, some of the chromatin features showed a cell type-specific link to GR binding indicative of context-specific effects of the chromatin environment on GR binding. Unexpectedly, chromatin marks associated with promoter regions (H3K9ac, H2A.Z and to some de-gree H3K4me3) showed a negative association with GR binding, suggesting that mechanisms exist that interfere with promoter–proximal GR binding.
GR binding is depleted at promoter–proximal accessible chro-matin
The negative link between GR binding and chromatin marks found at promoter regions suggests that GR prefer-entially binds to open regions that do not map to the pro-moters of genes. To test this hypothesis, we first determined for each cell line, the fraction of genome-wide DHSs that map to promoters (±2.5 kb around TSS of genes), to ex-ons, to introns and to the rest of the genome (distal). This analysis showed that the percentage of all DHSs mapping to promoter regions ranged from 24% for IMR90 cells to 27% for A549 and K562 cells (Figure3A). In comparison, the percentage of GR-bound DHSs mapping to promot-ers is strikingly lower, especially for A549 and IMR90 cells (A549: 13%; IMR90 12%; K562 17%). Similarly, the per-centage of GR-bound DHSs mapping to exons is lower than the percentage observed for all DHSs whereas GR binding is relatively enriched at intronic and distal DHSs. Together, our analysis shows that GR preferentially binds to intronic and distal DHSs rather than DHSs mapping to promoter and exonic regions.
To test if the relative depletion of promoter–proximal DHS binding is GR-specific, we examined the distribution of other TFs across different genomic locations for ChIP-seq peaks mapping to DHSs. Similar to what we observed for GR, we observed promoter–proximal depletion of bind-ing for FOSL2 and TCF12 TFs (Figure3B). In contrast, ETS1, a member of the ETS family of transcription fac-tors and RNA polymerase II preferentially bind promoter– proximal DHS regions with little binding to either exons, in-trons or distal DHSs (Figure3B; similar patterns observed for ATF3, BHLHE40, c-MYC, E2F6, ELF1, PBX3, USF1, YY1c and ZBTB33, data not shown). A third group of TFs showed no marked bias for DHSs at specific genomic re-gions as their binding distribution followed the distribu-tion observed for all DHSs (Figure 3B, examples shown for FOXA2 and CEBPB; similar pattern seen for JUND and TEAD4, data not shown). Together, our analysis in-dicates that, depending on the TF examined, binding can either be preferentially promoter–proximal, relatively unbi-ased toward a specific genomic location or, as observed for GR, depleted at promoter regions when compared to the distribution of all DHSs found in a cell.
Notably, GR does bind promoter–proximal in a num-ber of cases (337). To determine if the chromatin fea-tures found at GR-bound promoter DHS-regions differ from those present at unbound promoter DHSs, we com-pared their levels. This analysis showed that the level of certain histone modifications differs between GR-bound and unbound promoter DHSs. First, GR-bound promoter DHSs have higher average levels of H3K4me1, whereas H3K4me3 levels were lower than those observed for un-bound promoter DHSs (Figure3C). Moreover, H2BK12 and H2BK20 acetylation levels, which are markers of active enhancers (36), are higher at GR bound promoter DHSs.
GR motif score explains part of the observed promoter prox-imal depletion of GR binding
A simple explanation for the depletion of promoter– proximal GR binding is that many promoters lack a proper sequence motif to support GR binding. To investigate the role of sequence composition, we calculated the distribu-tion of GR motif scores for DHSs grouped by GR peak presence and promoter proximity. As expected, for each of the cell lines, GR-bound DHSs have a slightly higher av-erage motif score than unbound DHSs (Figure4A). Fur-ther, the average motif score for distal DHSs is higher than for their promoter–proximal counterparts arguing that se-quence composition contributes to the promoter–proximal depletion of GR binding observed. However, overall the promoter proximal and distal groups of DHSs have largely overlapping motif score distributions and a more formal ap-proach was needed to determine the contribution of mo-tif score in explaining the promoter proximal depletion ob-served (Figure 4A). Therefore, the contribution of motif score and promoter proximity to GR binding was quan-tified and statistically tested using an analysis of deviance. When controlling for motif score, promoter proximity could still explain a significant portion of the depletion of GR peaks (Figure4B) arguing for the existence of additional mechanisms responsible for the observed promoter proxi-mal depletion of GR binding. Together, our analysis indi-cates that the relatively low frequency of GR consensus mo-tif matches explains part, but not all, of the depletion of GR binding at promoter regions.
Increased genome-wide GR binding in the absence of GCN5 and PCAF
One unexpected finding from our Bayesian modeling was the striking negative association between H3K9ac levels and GR binding. This finding was unexpected because acetylation of H3K9 is linked to transcriptionally active ge-nomic regions and several studies have shown a positive cor-relation between H3K9ac levels and TF binding (37,38). H3K9ac is preferentially found at the TSS of genes and accordingly, H3K9ac levels can be used to accurately clas-sify enhancers and promoters (39). The majority of H3K9 acetylation is carried out by GCN5 and PCAF, two en-zymes that acetylate histones and other proteins including transcription factors (15,40). Of note, consistent with a role of these enzymes in modulating GR binding, overexpres-sion of GCN5 results in a reduced activation of endoge-nous GR target genes and reduced DNA binding of GR (40). To explore the possible causative and mechanistic con-nection between H3K9ac levels and GR binding, we ex-amined how the absence of GCN5 and PCAF influences the genome-wide binding pattern of GR (Figure5A). For these assays, we used mouse embryonic fibroblast (MEF) GCN5/PCAF double knock-out cells (dko MEFs) which show an almost complete loss of global H3K9ac levels whereas acetylation and methylation levels of other lysines in the tails of histones, including H3K27ac, are largely unaf-fected ((15), Supplementary Figure S2A). Accordingly, we found that chromatin-associated H3K9ac levels, as assayed by ChIP, were markedly reduced in dko MEFs when com-pared to wild type (Figure5B). Next, we assayed
genome-wide GR binding in wild type and in dko MEFS by ChIP-seq. These experiments showed that the majority of GR peaks in wild type were also bound in dko MEFs (Figure
5C and D). In addition, we find that some peaks are wild type-specific (Figure5C). Most strikingly however and con-sistent with a role of these enzymes in suppressing GR bind-ing, we find a 3.7 fold increase in the number of genomic GR binding sites in the dko MEFs (Figure5D). Subsequent analysis of GR binding at the three classes of bound loci (common; dko MEF-specific; wild type MEF-specific) by qPCR verified what we observed in the ChIP-seq experi-ments for each of the loci tested (Supplementary Figure S2C), arguing that the observed increase in GR binding in dko MEFs is not simply a consequence of differences in the quality of the ChIP-seq experiments. Further, analysis of two genes each near wild type and dko-specific GR peaks showed differences in GR-dependent regulation consistent with the observed cell type-specific GR binding (Supple-mentary Figure S3). The increase in binding cannot be ex-plained by changes in GR protein levels which are compa-rable for wild type and dko MEFs (Supplementary Figure S2B). Previous studies have shown that deletion of GCN5 results in a redistribution of DHSs in yeast (40). Therefore, we tested if changes in chromatin accessibility could explain the changes in GR binding uponGCN5/PCAFdeletion by comparing DNase I sensitivity for each of the three classes of binding sites. The analysis of control ‘closed’ and ‘open’ regions showed that the assay can be used to distinguish re-gions with different chromatin accessibility and that these control regions yielded comparable results for wild type and dko MEFs (Supplementary Figure S2E). Further, we found that changes in GR binding levels correlated with changes in DNase I sensitivity prior to GR binding for some of the loci examined (Supplementary Figure S2E). For example, the dko-specific binding sites showed higher levels of acces-sibility in dko MEFs than their wild type counterpart for each of the loci examined, arguing that chromatin accessi-bility might contribute to the changes in GR binding we observed uponGCN5/PCAFdeletion.
Next, we set out to determine if the increased genome-wide GR binding in the absence of GCN5 and PCAF might explain the promoter–proximal depletion of GR binding we observe in wild type cells. Therefore, we calculated the per-centage of binding sites mapping to promoter regions for each of the three classes of GR binding sites: dko-specific, wild type-specific and common. If GCN5 and PCAF in-deed play a key role in preventing promoter–proximal GR binding, we would predict that a higher percentage of dko-specific peaks map to promoter regions than for common or wild type-specific peaks. What we observed however is that a smaller percentage of dko-specific peaks maps to promoter regions than for common and wild type-specific peaks (Fig-ure5E). Further, the gained dko sites do not have higher H3K9ac levels prior to GR activation than those observed for common and wild type-specific peaks (Supplementary Figure S2D, Figure5B) indicating that gained binding sites in the dko MEFS are not preferentially regions with high H3K9ac levels in wild type MEFs.
proximal GR binding observed. Nonetheless, PCAF and GCN5 appear to modulate genome-wide GR binding, pos-sibly by inducing locus-specific changes in chromatin acces-sibility or by acetylating GR, which in turn can influence GR’s ability to interact with DNA (41).
Cell type-specific GR target genes have fewer promoter prox-imal GR peaks
The observed bias against GR binding at promoter– proximal DHSs matches findings by others (10,42) and prompts the question what the underlying biological signif-icance might be. One possibility could be that the depletion is linked to the cell type-specific functions of the glucocorti-coid receptor, which regulates vastly different sets of genes in different cell types (Figure6A, (12)). Given the strong link between GR binding and chromatin accessibility, we hypothesized that cell type-specific regulation might pref-erentially occur via distal enhancers, whose chromatin ac-cessibility is typically cell type-specific, whereas the chro-matin of promoter regions is often accessible regardless of tissue examined (7,9). To test this hypothesis, we first com-pared the transcriptional responses to GR activation be-tween three cell types (A549, U2OS and Nalm6) for which we also generated genome-wide GR binding data. Consis-tent with other studies (12), we find that GR target genes show little overlap between cell types (30 out of a total of 2974 regulated genes in three cell lines combined are regu-lated in all three cell types). If cell type-specific gene regula-tion is preferentially driven by distal binding, the expecta-tion would be that cell type-specific target genes have fewer promoter–proximal GR binding events than common tar-get genes. Accordingly, we find that the percentage of genes with a promoter–proximal GR peak is smaller for cell type-specific target genes than for common target genes for each of the three cell lines examined (Figure 6B) and the same trend is seen when cell-type-specific target genes are com-pared to genes that are regulated in two out of three cell lines, indicating that depletion of promoter proximal bind-ing might play a role in safe-guardbind-ing GR’s ability to regu-late target genes in a cell type-specific manner.
DISCUSSION
Prior to the advent of methods to map TF occupancy genome-wide, studies primarily focused on promoter– proximal regions to identify candidate TF binding sites re-sponsible for the regulation of genes. Subsequent genome-wide analysis of TF binding have shown that the major-ity of binding for certain TFs, including GR, actually oc-curs at promoter-distal sites suggesting that certain TFs might preferentially regulate transcription from remote lo-cations. Notably, the majority of open chromatin maps to promoter-distal locations and findings presented here and by others (10) show that most GR binding occurs at chromatin that is accessible prior to hormone treatment. Thus, one explanation for the genomic distribution of GR binding is that it simply follows the genomic distribution of DHSs. Interestingly however, our approach, which fo-cused on the universe of DHSs, uncovered that GR bind-ing is biased against promoter proximal regions (Figure
3A). In agreement with our findings, another study also found that GR binding is biased against promoter prox-imal DHSs with 39% of all DHSs mapping to promoter regions whereas the percentage of GR binding sites map-ping to promoter regions was only 7% (10). Our analysis of other TFs showed different biases towards binding at DHSs located at distinct genomic regions (Figure2B). For some TFs (for example ETS1, c-MYC and E2F6) the major-ity of binding (>75%) occurs at promoter–proximal DHSs whereas other TFs follow the distribution of DHSs or, like GR, show a bias against promoter–proximal binding. This prompts the question what the biological significance of the promoter–proximal depletion of TF binding might be. We propose that gene regulation by distal regulatory elements might play a role in allowing GR to regulate different tar-get genes in different tissues. Our hypothesis is motivated by the fact that promoter–proximal binding sites are typically accessible across cell types, whereas promoter-distal sites are predominantly accessible in a cell type-specific man-ner (7,9). Accordingly, ChIP-seq peaks in promoters fre-quently show a larger percentage overlap between cell types than peaks promoter-distal sites (2,43). We propose that GR might bind and regulate transcription from promoter– proximal regions regardless of cell type, whereas binding and regulation from promoter-distal regions is more likely to direct cell type-specific transcriptional programs (Fig-ure 7). Consistent with our hypothesis, a larger percent-age of genes regulated by GR across cell types harbor a promoter–proximal GR peak than genes regulated in a cell type-specific manner (Figure6B). In contrast, the prefer-ential promoter–proximal binding of other TFs involved in fundamental processes like DNA repair and cell-cycle pro-gression (E2F6, YY1 and c-MYC) might facilitate the reg-ulation of largely overlapping sets of genes across cell types. One way to further test our hypothesis would be to use genome-editing techniques to introduce GR response ele-ments in the promoter–proximal regions of genes and to test if these genes are more prone to be regulated by GR regard-less of cell type than genes whose expression is regulated by GR via distal regulatory elements.
Figure 7. Cartoon depiction of our model how shared and cell type-specific chromatin accessibility direct gene regulation by GR. (top) Shared regulation of GR targets across cell types preferentially occurs via promoter–proximal DHSs which are accessible regardless of cell type. (bottom) In contrast, the expression of cell specific GR target genes preferentially occurs via cell specific GR binding to distal DHSs, which are accessible in a cell type-specific manner.
the rest of the genome, which is mostly not DHSs. Con-sequently, chromatin accessibility and histone modification state might provide redundant information when TF bind-ing is modeled genome-wide. Accordbind-ingly, a previous study has shown that addition of information regarding post-translational histone modification state did not provide ad-ditional predictive power when DNase I data was already included in the model to predict genome-wide TF binding (8). In contrast, our approach showed that certain chro-matin features are specifically enriched or depleted at GR-bound accessible regions and the same approach can be ap-plied to any TF to study the role of chromatin features in specifying which DHSs are preferentially bound by a TF of interest. The hierarchical Bayesian model allows compar-isons to be made directly across experiments and across cell types. This showed, for example, that H3K27ac levels show a stronger association with the levels of GR binding than
consen-sus motif and therefore does not pick-up potential contri-butions of cell type-specific sequence motifs bound by TFs that tether GR to the genome or act cooperatively. Similarly, sequences that prevent GR binding to nearby response ele-ments (46) were not included in the model. Therefore, future iterations of our model, to include additional sequence mo-tifs, might better explain the observed GR binding variance. The results of our modeling are useful to generate hy-potheses, which guide the design of subsequent follow-up experiments. As detailed above, this approach uncovered a depletion of promoter proximal GR binding and yielded indications that this might play a role in facilitating cell type-specific cellular responses to glucocorticoid signaling. In addition, the modeling uncovered several striking corre-lations between chromatin features and GR binding. How-ever, whether observed correlations between histone modi-fications and TF binding reflect a causal relationship is of-ten unclear. Arguing for the exisof-tence of additional mecha-nisms that interfere with promoter–proximal GR binding, we found that motif score distribution only partially ex-plains the depletion. Here, we followed up on the negative correlation between H3K9ac and GR binding and tested the effect of deletion of the two enzymes responsible for H3K9 acetylation, GCN5 and PCAF. Although we found that GR binds to many more genomic loci when PCAF and GCN5 are missing, the gained GR-bound genomic loci did not preferentially map to regions with high H3K9ac levels or promoter regions arguing that the correlation between GR binding and H3K9ac levels does not reflect a causative link. A likely alternative explanation for the observed anti-correlation between H3K9ac levels and GR binding is that high H3K9ac levels are found at promoter regions which have few GR binding sites which is the actual cause for the low levels of GR binding observed. This stresses that ob-served correlations between binding and histone marks do not necessarily imply causation. Nonetheless, the approach to disrupt the enzymes responsible for depositing specific histone marks provides a way to test for causality, which can also be applied to analyze other observed correlations between TF binding and histone modifications.
Taken together, our results uncovered that although GR preferentially binds accessible chromatin, its binding is bi-ased against accessible chromatin located at promoter re-gions. This depletion can be explained in part by the se-quence composition at promoters which harbor fewer bind-ing sites and we hypothesize that depletion of promoter– proximal GR binding might play a role in safe-guarding cell type-specific transcriptional consequences of glucocor-ticoid signaling (Figure 7). Given that many TFs prefer-entially bind accessible chromatin, modeling their binding in the universe of open chromatin, as we did here for GR, might provide additional insights into the mechanisms that direct TFs to specific genomic loci.
ACCESSION NUMBERS
ChIP-seq data for A549, Nalm-6 and MEFs were deposited at EBI ArrayExpress with this study under accession num-ber E-MTAB-5113.
SUPPLEMENTARY DATA
Supplementary Data are available at NAR Online.
ACKNOWLEDGEMENTS
We thank Edda Einfeldt for excellent technical support and Kai Ge for sharing immortalized wild type and dko MEFs.
FUNDING
Deutsche Forschungsgemeinschaft [ME4154/1-1 to M.J.]; National Institutes of Health [R01 CA20535 to KRY]. Funding for open access charge: Core Max Planck Insti-tute.
Conflict of interest statement.None declared.
REFERENCES
1. Mathelier,A., Fornes,O., Arenillas,D.J., Chen,C.Y., Denay,G., Lee,J., Shi,W., Shyr,C., Tan,G., Worsley-Hunt,R.et al.(2016) JASPAR 2016: a major expansion and update of the open-access database of transcription factor binding profiles.Nucleic Acids Res.,44, D110–D115.
2. Handstad,T., Rye,M., Mocnik,R., Drablos,F. and Saetrom,P. (2012) Cell-type specificity of ChIP-predicted transcription factor binding sites.BMC Genomics,13, 372.
3. Siersbaek,R., Rabiee,A., Nielsen,R., Sidoli,S., Traynor,S., Loft,A., La Cour Poulsen,L., Rogowska-Wrzesinska,A., Jensen,O.N. and Mandrup,S. (2014) Transcription factor cooperativity in early adipogenic hotspots and super-enhancers.Cell Rep.,7, 1443–1455. 4. Jolma,A., Yin,Y., Nitta,K.R., Dave,K., Popov,A., Taipale,M.,
Enge,M., Kivioja,T., Morgunova,E. and Taipale,J. (2015) DNA-dependent formation of transcription factor pairs alters their binding specificity.Nature,527, 384–388.
5. Li,X.Y., Thomas,S., Sabo,P.J., Eisen,M.B., Stamatoyannopoulos,J.A. and Biggin,M.D. (2011) The role of chromatin accessibility in directing the widespread, overlapping patterns of Drosophila transcription factor binding.Genome Biol.,12, R34. 6. Heintzman,N.D., Stuart,R.K., Hon,G., Fu,Y., Ching,C.W.,
Hawkins,R.D., Barrera,L.O., Van Calcar,S., Qu,C., Ching,K.A.et al. (2007) Distinct and predictive chromatin signatures of transcriptional promoters and enhancers in the human genome.Nat. Genetics,39, 311–318.
7. Natarajan,A., Yardimci,G.G., Sheffield,N.C., Crawford,G.E. and Ohler,U. (2012) Predicting cell-type-specific gene expression from regions of open chromatin.Genome Res.,22, 1711–1722. 8. Pique-Regi,R., Degner,J.F., Pai,A.A., Gaffney,D.J., Gilad,Y. and
Pritchard,J.K. (2011) Accurate inference of transcription factor binding from DNA sequence and chromatin accessibility data.
Genome Res.,21, 447–455.
9. Song,L., Zhang,Z., Grasfeder,L.L., Boyle,A.P., Giresi,P.G., Lee,B.K., Sheffield,N.C., Graf,S., Huss,M., Keefe,D.et al.(2011) Open chromatin defined by DNaseI and FAIRE identifies regulatory elements that shape cell-type identity.Genome Res.,21, 1757–1767. 10. John,S., Sabo,P.J., Thurman,R.E., Sung,M.H., Biddie,S.C.,
Johnson,T.A., Hager,G.L. and Stamatoyannopoulos,J.A. (2011) Chromatin accessibility pre-determines glucocorticoid receptor binding patterns.Nat. Genet.,43, 264–268.
11. Gertz,J., Savic,D., Varley,K.E., Partridge,E.C., Safi,A., Jain,P., Cooper,G.M., Reddy,T.E., Crawford,G.E. and Myers,R.M. (2013) Distinct properties of cell-type-specific and shared transcription factor binding sites.Mol. Cell,52, 25–36.
12. John,S., Johnson,T.A., Sung,M.H., Biddie,S.C., Trump,S.,
Koch-Paiz,C.A., Davis,S.R., Walker,R., Meltzer,P.S. and Hager,G.L. (2009) Kinetic complexity of the global response to glucocorticoid receptor action.Endocrinology,150, 1766–1774.
13. Consortium,E.P. (2012) An integrated encyclopedia of DNA elements in the human genome.Nature,489, 57–74.
Ecker,J.R.et al.(2010) The NIH Roadmap Epigenomics Mapping Consortium.Nat. Biotechnol.,28, 1045–1048.
15. Jin,Q., Yu,L.R., Wang,L., Zhang,Z., Kasper,L.H., Lee,J.E., Wang,C., Brindle,P.K., Dent,S.Y. and Ge,K. (2011) Distinct roles of
GCN5/PCAF-mediated H3K9ac and CBP/p300-mediated
H3K18/27ac in nuclear receptor transactivation.EMBO J.,30, 249–262.
16. Thomas-Chollier,M., Watson,L.C., Cooper,S.B., Pufall,M.A., Liu,J.S., Borzym,K., Vingron,M., Yamamoto,K.R. and Meijsing,S.H. (2013) A naturally occurring insertion of a single amino acid rewires transcriptional regulation by glucocorticoid receptor isoforms.Proc. Natl. Acad. Sci. U.S.A.,110, 17826–17831. 17. Shipp,L.E., Lee,J.V., Yu,C.Y., Pufall,M., Zhang,P., Scott,D.K. and
Wang,J.C. (2010) Transcriptional regulation of human dual specificity protein phosphatase 1 (DUSP1) gene by glucocorticoids.PLoS One, 5, e13754.
18. Starick,S.R., Ibn-Salem,J., Jurk,M., Hernandez,C., Love,M.I., Chung,H.R., Vingron,M., Thomas-Chollier,M. and Meijsing,S.H. (2015) ChIP-exo signal associated with DNA-binding motifs provides insight into the genomic binding of the glucocorticoid receptor and cooperating transcription factors.Genome Res.,25, 825–835. 19. Langmead,B. and Salzberg,S.L. (2012) Fast gapped-read alignment
with Bowtie 2.Nat. Methods,9, 357–359.
20. Zhang,Y., Liu,T., Meyer,C.A., Eeckhoute,J., Johnson,D.S., Bernstein,B.E., Nusbaum,C., Myers,R.M., Brown,M., Li,W.et al. (2008) Model-based analysis of ChIP-Seq (MACS).Genome Biol.,9, R137.
21. Stark,R. and Brown,G. (2011) DiffBind: differential binding analysis of ChIP-Seq peak data. http://bioconductor.org/packages/release/
bioc/vignettes/DiffBind/inst/doc/DiffBind.pdf.
22. Tarailo-Graovac,M. and Chen,N. (2009) Using RepeatMasker to identify repetitive elements in genomic sequences. In: Baxevanis,AD (ed).Current Protocols in Bioinformatics.
doi:10.1002/0471250953.bi0410s25.
23. Sandelin,A., Alkema,W., Engstrom,P., Wasserman,W.W. and Lenhard,B. (2004) JASPAR: an open-access database for eukaryotic transcription factor binding profiles.Nucleic Acids Res.,32, D91–D94.
24. Huber,W., Carey,V.J., Gentleman,R., Anders,S., Carlson,M., Carvalho,B.S., Bravo,H.C., Davis,S., Gatto,L., Girke,T.et al.(2015) Orchestrating high-throughput genomic analysis with Bioconductor.
Nat. Methods,12, 115–121.
25. Lawrence,M., Huber,W., Pages,H., Aboyoun,P., Carlson,M., Gentleman,R., Morgan,M.T. and Carey,V.J. (2013) Software for computing and annotating genomic ranges.PLoS Comput. Biol.,9, e1003118.
26. Durinck,S., Moreau,Y., Kasprzyk,A., Davis,S., De Moor,B., Brazma,A. and Huber,W. (2005) BioMart and Bioconductor: a powerful link between biological databases and microarray data analysis.Bioinformatics,21, 3439–3440.
27. Gelman,A. (2004)Bayesian Data Analysis. 2nd edn. Chapman & Hall/CRC, Boca Raton.
28. Carpenter,B., Gelman,A., Hoffman,M., Lee,D., Goodrich,B., Betancourt,M., Brubaker,M.A., Guo,J., Li,P. and Riddell,A. (2016) Stan: A probabilistic programming language.J. Stat. Softw.,76, doi:10.18637/jss.v076.i01.
29. John,S., Sabo,P.J., Johnson,T.A., Sung,M.H., Biddie,S.C., Lightman,S.L., Voss,T.C., Davis,S.R., Meltzer,P.S., Stamatoyannopoulos,J.A.et al.(2008) Interaction of the
glucocorticoid receptor with the chromatin landscape.Mol. Cell,29, 611–624.
30. Yang,H., Kwon,C.S., Choi,Y. and Lee,D. (2016) Both H4K20 mono-methylation and H3K56 acetylation mark
transcription-dependent histone turnover in fission yeast.Biochem.
Biophys. Res. Commun.,476, 515–521.
31. Perner,J., Lasserre,J., Kinkley,S., Vingron,M. and Chung,H.R. (2014) Inference of interactions between chromatin modifiers and histone modifications: from ChIP-Seq data to chromatin-signaling.Nucleic
Acids Res.,42, 13689–13695.
32. Vockley,C.M., D’Ippolito,A.M., McDowell,I.C., Majoros,W.H., Safi,A., Song,L., Crawford,G.E. and Reddy,T.E. (2016) Direct GR Binding Sites Potentiate Clusters of TF Binding across the Human Genome.Cell,166, 1269–1281.
33. Wagner,E.J. and Carpenter,P.B. (2012) Understanding the language of Lys36 methylation at histone H3.Nat. Rev. Mol. Cell Biol.,13, 115–126.
34. Nguyen,A.T. and Zhang,Y. (2011) The diverse functions of Dot1 and H3K79 methylation.Genes Dev.,25, 1345–1358.
35. Wang,Z., Zang,C., Rosenfeld,J.A., Schones,D.E., Barski,A., Cuddapah,S., Cui,K., Roh,T.Y., Peng,W., Zhang,M.Q.et al.(2008) Combinatorial patterns of histone acetylations and methylations in the human genome.Nat. Genet.,40, 897–903.
36. Kumar,V., Rayan,N.A., Muratani,M., Lim,S., Elanggovan,B., Xin,L., Lu,T., Makhija,H., Poschmann,J., Lufkin,T.et al.(2016)
Comprehensive benchmarking reveals H2BK20 acetylation as a distinctive signature of cell-state-specific enhancers and promoters.
Genome Res.,26, 612–623.
37. Liu,L., Jin,G. and Zhou,X. (2015) Modeling the relationship of epigenetic modifications to transcription factor binding.Nucleic
Acids Res.,43, 3873–3885.
38. Calo,E. and Wysocka,J. (2013) Modification of enhancer chromatin: what, how, and why?Mol. Cell,49, 825–837.
39. Rajagopal,N., Ernst,J., Ray,P., Wu,J., Zhang,M., Kellis,M. and Ren,B. (2014) Distinct and predictive histone lysine acetylation patterns at promoters, enhancers, and gene bodies.G3,4, 2051–2063. 40. Zelin,E., Zhang,Y., Toogun,O.A., Zhong,S. and Freeman,B.C. (2012) The p23 molecular chaperone and GCN5 acetylase jointly modulate protein-DNA dynamics and open chromatin status.Mol. Cell,48, 459–470.
41. Nader,N., Chrousos,G.P. and Kino,T. (2009) Circadian rhythm transcription factor CLOCK regulates the transcriptional activity of the glucocorticoid receptor by acetylating its hinge region lysine cluster: potential physiological implications.FASEB J.,23, 1572–1583.
42. Grontved,L., John,S., Baek,S., Liu,Y., Buckley,J.R., Vinson,C., Aguilera,G. and Hager,G.L. (2013) C/EBP maintains chromatin accessibility in liver and facilitates glucocorticoid receptor recruitment to steroid response elements.EMBO J.,32, 1568–1583. 43. Oldfield,A.J., Yang,P., Conway,A.E., Cinghu,S., Freudenberg,J.M., Yellaboina,S. and Jothi,R. (2014) Histone-fold domain protein NF-Y promotes chromatin accessibility for cell type-specific master transcription factors.Mol. Cell,55, 708–722.
44. Arvey,A., Agius,P., Noble,W.S. and Leslie,C. (2012) Sequence and chromatin determinants of cell-type-specific transcription factor binding.Genome Res.,22, 1723–1734.
45. Shu,W., Chen,H., Bo,X. and Wang,S. (2011) Genome-wide analysis of the relationships between DNaseI HS, histone modifications and gene expression reveals distinct modes of chromatin domains.Nucleic
Acids Res.,39, 7428–7443.