Cover Page
The handle
http://hdl.handle.net/1887/66665 h
olds various files of this Leiden University
dissertation.
Author: Suzuki, Y.
Title: From the macro- to the microvasculature : temporal and spatial visualization using
arterial spin labeling
From the Macro- to
the Microvasculature:
From the Macro- to the Microvasculature:
Temporal and Spatial Visualization using Arterial Spin Labeling
Cover designed by proefschrift-aio.nl and Yuriko Suzuki (Inspired by beautiful canals and streets in Leiden) Print & layout by proefschrift-aio.nl
ISBN: 978-94-92801-53-1
The research in this thesis was funded by the EU under the Horizon2020 program (project: CDS-QUAMRI, project number 634541).
© Yuriko Suzuki, 2018
From the Macro- to Microvasculature:
Temporal and Spatial Visualization using
Arterial Spin Labeling
Proefschrift
Ter verkrijging van
de graad van Doctor aan de Universiteit Leiden, op gezag van Rector Magnificus prof.mr. C.J.J.M. Stolker,
volgens besluit van het College voor Promoties te verdedigen op donderdag 1 november 2018
klokke 13:45 uur
door
Yuriko Suzuki
Promotor: Prof. dr. A.G. Webb
Co-promotores: Prof. dr. ir. M.J.P. van Osch
Dr. T.W. Okell
University of Oxford
Promotiecommissie: Prof. dr. ir. B.P.F. Lelieveldt
Prof. dr. ir. A.J. Nederveen
Academic Medical Center Amsterdam
Dr. I. Asllani
Rochester Institue of Technology
P.D. Dr. M. Helle
Table of Contents
Chapter 1
Introduction and thesis outline
Chapter 2
Acceleration of ASL-Based Time-Resolved MR Angiography
by Acquisition of Control and Labeled Images in the Same
Shot (ACTRESS)
Magn Reson Med 2018;79(1):224-233.
Chapter 3
Optimization of the Spatial Modulation Function of
Vessel-Encoded Pseudo-Continuous ASL and its Application to
Dynamic Angiography
Magn Reson Med 2018;00:1-13. https://doi.org/10.1002/mrm.27418
Chapter 4
Acceleration of Vessel-Selective Dynamic MR Angiography
by pCASL in Combination with Acquisition of Control and
Labeled Images in the Same Shot (ACTRESS)
Magn Reson Med, in revision
09
25
45
Chapter 5
Simultaneous Acquisition of Perfusion Image and Dynamic
Angiography Using Time-Encoded Pseudo-Continuous ASL
Magn Reson Med 2018;79(5):2676-2684.Chapter 6
A Framework for Motion Correction of Background
Suppressed Arterial Spin Labeling Perfusion Images
Acquired with Simultaneous Multi-Slice EPI
Magn Reson Med 2018: 1-13. https://doi.org/10.1002/mrm.27499
Chapter 7
Summary and general discussion
Nederlandse samenvatting
Acknowledgements
Curriculum Vitae
List of publications
95
115
141
1
Introduction and thesis outline
Blood circulation, which delivers oxygen and nutrition by arterial blood, while removing waste products on the venous side, is an essential prerequisite for the survival of biological tissue. Particularly for brain tissue, even a short interruption of the blood circulation can result in critical consequences (1). Because of this great importance, the vascular system has amazing compensatory mechanisms. One of the most important mechanisms is the circle of Willis, which is a circular structure of arteries in the brain allowing collateral blood flow from one hemisphere to the other as well as between the anterior and posterior circulation (2,3). However, when the collateral circulation at the circle of Willis is not sufficient, the pre-existing collateral arterioles start to expand their lumen and eventually result in the development of functional collateral circulation (4-6). This process is induced by increased shear stress following the stenosis/occlusion of a main artery, which is termed arteriogenesis. In contrast, angiogenesis is triggered by tissue hypoxia and results in sprouting of new capillaries. Because these newly generated capillaries do not have vascular smooth muscle cells, they are more fragile.
1
stroke. However, because the progression of the steno-occlusion cannot be stopped by medication, the revascularization surgery is recommended proactively to avoid further ischemic or hemorrhagic events (16,17). Successful restoration of the cerebral blood supply by revascularization can reduce the risks for further events, as well as improving the postoperative activities of daily living (ADL) and long-term prognosis of higher brain functions (16). Therefore, postoperative assessments of revascularization and follow-up are considered very important. Untreated asymptomatic Moyamoya patients (diagnosed before the events) are also considered potentially at risk for future progress and onset of event, thereby requiring careful long-term observation.
On the other hand, angiogenesis is also a hallmark of pathological processes, e.g. to supply tumors with oxygen and nutrient rich blood which is needed to support tumor growth (18,19). Perfusion measurements of tumor blood flow provide important information for condition, staging and differentiation of the disease (20-23). For highly vascularized tumors, such as meningioma, preoperative endovascular embolization is often applied before surgical resection to reduce blood loss during surgery (24). In such cases, information about the feeding arteries (e.g. whether the dominant supply is from internal carotid artery or external carotid artery) is useful for treatment planning. Cerebral arteriovenous malformation (AVM) is also an example of a cerebrovascular disease with increased vascularity, in which abnormal, tangled blood vessels connect arteries directly to veins without the presence of a normal capillary bed in between. Such AVMs provided an increased risk of intracranial hemorrhages. General treatment options of AVMs are surgical resection, gamma knife and endovascular embolization, and the optimal treatment is decided upon by taking the anatomic and hemodynamic properties of the AVM (e.g. size and location of nidus, arterial feeders and pattern of the venous drainage) into account.
Introduction and thesis outline
patients with Moyamoaya disease (the highest peak onset is between 5 to 9 years of age (32)), need numerous diagnostic scans to monitor disease progression and for them establishment of a non-invasive examination without the associated risks of catheter procedures, anesthesia or contrast agent injections would be highly desirable. Moreover, the recently found accumulation of Gadolinium in the brain is another urgent reason to develop non-invasive alternatives.
This doctoral thesis describes the development of several new techniques for dynamic MRA (4D-MRA) and perfusion imaging based upon ASL MRI. The purpose of those developments is to implement clinically useful and feasible techniques, while being as patient-friendly as possible.
Acceleration of ASL-based dynamic angiography (ACTRESS)
In the last decade, 4D-MRA using ASL has become an important alternative to CE-4D-MRA in the brain, by demonstrating advantages over a CE-CE-4D-MRA examination, such as, needless to say, the ability to visualize arteries without using contrast agent, as well as two other main advantages: firstly, in the acquisition of CE-4D-MRA, it is desired to capture the first passage of the contrast agent bolus by means of a real-time dynamic acquisition. Due to very fast passage of the contrast agent through the vascular tree and the early appearance of venous signal, each dynamic must be acquired very quickly, and therefore spatial resolution is usually compromised. In ASL, on the other hand, the labeling of the arterial blood and following data acquisition can be repeated until sufficient information is acquired for both high spatial and temporal resolution, because it is not necessary to acquire all information during a single passage of the bolus.
It should be noted that, however, the scan time of ASL-based 4D-MRA acquisition is generally much longer than CE-4D-MRA. This is not only because of the repeated acquisition to achieve high spatial and temporal resolution, but also because ASL techniques require the acquisition of two types of images: labeled and control images. Subtraction of these two images eliminates the background static tissue signal, thereby isolating the signal of the labeled blood. As Figure 1 illustrates, labeled and control images are usually acquired in separate Look-Locker cycles, resulting in a doubling of the scan time. In previous studies, the mean scan time of ASL-based 4D-MRA was approximately 7 minutes (5 min – 8.5 min) (33-38), which is not always suitable for clinical use.
1
the ACTRESS approach, a single control image is acquired before applying the labeling pulse followed by multi-phase Look-Locker readout, and all labeled images are subtracted from this single control image (39). This allows 4D-MRA images to be acquired with similar image quality in nearly half the scan time of the conventional ASL-based 4D-MRA acquisition using pulsed ASL (PASL).
Figure 1: A schematic figure of ASL-based 4D-MRA using Look-Locker readout.
Vessel-selective dynamic angiography using vessel-encoded
pseudo-continuous ASL
The second advantage of ASL-based 4D-MRA over CE-4D-MRA is the ability to perform vessel specific visualization, in which the vascular tree arising from a selected artery can be exclusively visualized by means of spatially selective labeling. This technique could provide clinically important information for smoother examination and treatment by X-ray DSA, or even be a potential alternative of X-ray DSA examination for treatment planning and follow-up of many cerebrovascular diseases, such as depiction of collateral flow in patients with steno-occlusive diseases (48) and identification of feeding arteries for AVM (40).
Introduction and thesis outline
and ECA) is difficult because the labeling slab usually includes the common carotid artery. In contrast, in pseudo-continuous ASL (pCASL), labeling of arterial blood is performed by means of flow-driven pseudo-adiabatic inversion in a thin labeling plane planned perpendicular to the flow direction. Vessel-selective labeling can be achieved by applying additional gradients in the in-plane direction, generating in-plane differences in labeling efficiency. Therefore, pCASL allows vessel-selective planning with very little restrictions and a low risk of partial labeling of blood in untargeted arteries when tortuous vascular anatomy is present.
In chapter 3, a new implementation of vessel-selective 4D-MRA using vessel-encoded (ve) pCASL (41) is proposed. Ve-pCASL consists of several labeling patterns played out according to a Hadamard matrix, instead of pair-wise acquisition of labeled and control images. For successful implementation, there are two hurdles to overcome. First, the scan time of 4D-MRA using ve-pCASL will increase proportionally to the number of Hadamard-encodings. For perfusion imaging, the acquisition of different encodings can be performed instead of signal averaging, therefore vessel-selective imaging can be achieved without extra scan time or loss in signal to noise ratio (SNR). However, this is not true for an MRA acquisition, because in ASL-based MRA the entire scan time is usually spent to obtain high spatial resolution, rather than signal averaging. In this study, therefore, separate visualization of three arterial trees arising from the right ICA (RICA), left ICA (LICA) and both vertebral arteries (VAs) is proposed by using four Hadamard-encodings, to minimize the scan time. The measured signal in this study can be written as follows:
-1 1 1 -1 RICA LICA VAs S 1 1 -1 -1 1 -1 1 -1 1 1 1 1
y =
[1]
where yis the measured signal and S is static tissue. Each arterial tree arising from RICA, LICA and VAs is calculated by applying the pseudo-inverse matrix of equation [1].
1
broad and flat enough, thereby increasing the risk of partial labeling of non-targeted arteries, which will compromise the accurate separation of the arterial trees in the selective angiograms. In this chapter the shape of the spatial inversion modulation is optimized by changing the pCASL labeling parameters (maximum and mean labeling gradient strength), so that a sharper transition between the labeling and control conditions and broader, flatter control regions can be achieved. This enables the acquisition of ve-pCASL 4D-MRA in half the time of previous implementations (42).
Acceleration of vessel-selective dynamic angiography using the
ACTRESS approach
When considering the separate visualization of the ICA and the ECA, applying ve-pCASL with four Hadamard encodings will be difficult due to the number of arteries that need to be differentiated and their location with respect to each other. Instead of ve-pCASL scan, therefore, a simple one-by-one labeling of ICA and ECA might be easier to obtain the desired information. However, a pair-wise acquisition of labeled and control images for each target artery will be time-consuming.
Introduction and thesis outline
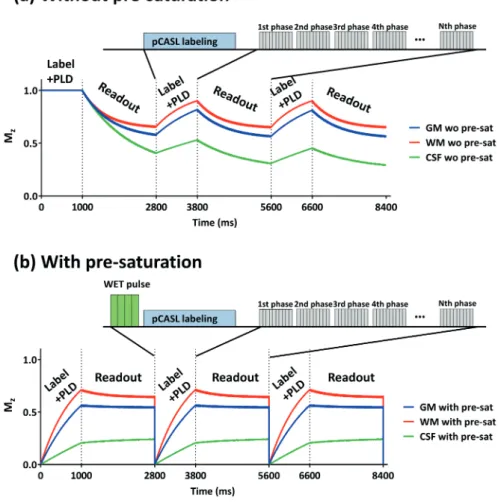
Moreover, there is another inconvenience caused by the long pCASL labeling train. Unlike the PASL technique that relies on a very short labeling pulse (approximately 10-20 ms), the pCASL labeling train lasts from hundreds to thousands of milliseconds, after which the front of the bolus of labeled blood will already have reached the peripheral arteries. Therefore, the conventional subtraction would only depict the outflow of labeled blood.
In this study, a WET pre-saturation module (43) was inserted before the pCASL labeling train to minimize the signal variation of the static tissue over the Look-Locker acquisitions. Moreover, a new subtraction scheme was introduced to depict arteries with wide range of temporal information from the early inflow to the late peripheral phase.
Simultaneous acquisition of 4D-MRA and perfusion images
using time-encoded pCASL
For assessment of the hemodynamic condition of brain tissue, it is essential not only to visualize large vessel pathology, such as stenosis or collateral flow, but also to know the microvascular status of downstream tissue, i.e. quantitative information on the cerebral perfusion of the tissue. However, including both acquisitions of 4D-MRA and perfusion imaging into a clinical protocol would be hampered by long scan time. To address this issue, in chapter 5, the development of a simultaneous acquisition scheme of 4D-MRA and perfusion imaging is described.
1
In chapter 5, we propose the use of time-encoded pCASL (te-pCASL) to obtain the different temporal information for the 4D-MRA and perfusion image (44). Unlike the Look-Locker readout that was used in previous chapters, in te-pCASL images with N delays are obtained by dividing the long pCASL labeling train into N segments (a.k.a. subboli) with either a label or a control condition. The acquisitions are repeated N+1 times, with different combinations of label/control condition according to a Hadamard matrix of order N+1 (N=7 in Figure 2). By employing the appropriate decoding step, only the ASL signal from a single subbolus can be reconstructed, i.e. N ASL images with different post-labeling delays (PLDs) are obtained. In this study, the first subbolus was optimized for perfusion imaging with a long labeling duration and a PLD of 1.8 sec, whereas the other subboli were optimized for 4D-MRA with relatively short labeling durations to achieve a high temporal resolution as desired in 4D-MRA.
Figure 2: A schematic figure of time-encoded (te) pCASL.
ASL perfusion imaging with simultaneous multi-slice EPI
acquisition
Introduction and thesis outline
There is another factor why ASL signal in perfusion imaging is much lower compared to 4D-MRA: during the delay time that allows all labeled arterial blood to arrive in the brain tissue, the ASL signal will decrease with the T1 relaxation of the blood. In general, a PLD of 1.8 to 2 seconds is recommended for adult examinations, because too short PLD would not only cause an underestimation of the perfusion signal, since not all labeled arterial blood has arrived yet, but also cause hyperintense vascular artefacts from arteries where labeled blood is still present.
Compared to a 3D readout, unfortunately, multi-slice 2D acquisitions will face even lower SNR, since optimization of BGS-timing is usually performed for the first slice. In distal slices that are typically acquired hundreds of milliseconds later than the first slice, the effectiveness of BGS will be reduced due to longitudinal relaxation. Similarly, the effective PLD of the distal slices will be hundreds of milliseconds longer than the PLD of the first slice, leading again to a loss of SNR in more distal slices.
1
References
1. Saver JL. Time is brain--quantified. Stroke 2006;37(1):263-266. 2. Liebeskind DS. Collateral circulation. Stroke 2003;34(9):2279-2284.
3. Hartkamp MJ, van Der Grond J, van Everdingen KJ, Hillen B, Mali WP. Circle of Willis collateral flow investigated by magnetic resonance angiography. Stroke 1999;30(12):2671-2678. 4. Heil M, Eitenmuller I, Schmitz-Rixen T, Schaper W. Arteriogenesis versus angiogenesis: similarities
and differences. J Cell Mol Med 2006;10(1):45-55.
5. Liu J, Wang Y, Akamatsu Y, Lee CC, Stetler RA, Lawton MT, Yang GY. Vascular remodeling after ischemic stroke: mechanisms and therapeutic potentials. Prog Neurobiol 2014;115:138-156. 6. Buschmann I, Schaper W. The pathophysiology of the collateral circulation (arteriogenesis). J
Pathol 2000;190(3):338-342.
7. Henderson RD, Eliasziw M, Fox AJ, Rothwell PM, Barnett HJ. Angiographically defined collateral circulation and risk of stroke in patients with severe carotid artery stenosis. North American Symptomatic Carotid Endarterectomy Trial (NASCET) Group. Stroke 2000;31(1):128-132. 8. Maas MB, Lev MH, Ay H, Singhal AB, Greer DM, Smith WS, Harris GJ, Halpern E, Kemmling A,
Koroshetz WJ, Furie KL. Collateral vessels on CT angiography predict outcome in acute ischemic stroke. Stroke 2009;40(9):3001-3005.
9. Lima FO, Furie KL, Silva GS, Lev MH, Camargo EC, Singhal AB, Harris GJ, Halpern EF, Koroshetz WJ, Smith WS, Yoo AJ, Nogueira RG. The pattern of leptomeningeal collaterals on CT angiography is a strong predictor of long-term functional outcome in stroke patients with large vessel intracranial occlusion. Stroke 2010;41(10):2316-2322.
10. Liebeskind DS, Cotsonis GA, Saver JL, Lynn MJ, Turan TN, Cloft HJ, Chimowitz MI, Warfarin-Aspirin Symptomatic Intracranial Disease I. Collaterals dramatically alter stroke risk in intracranial atherosclerosis. Ann Neurol 2011;69(6):963-974.
11. Kucinski T, Koch C, Eckert B, Becker V, Kromer H, Heesen C, Grzyska U, Freitag HJ, Rother J, Zeumer H. Collateral circulation is an independent radiological predictor of outcome after thrombolysis in acute ischaemic stroke. Neuroradiology 2003;45(1):11-18.
12. Bang OY, Saver JL, Kim SJ, Ha Y, Kim GM, Chung CS, Ovbiagele B, Lee KH, Liebeskind DS. Collateral Flow Predicts Response To Endovascular Therapy For Acute Ischemic Stroke. Stroke 2011;42(3):E95-E95.
13. Bang OY, Saver JL, Kim SJ, Kim GM, Chung CS, Ovbiagele B, Lee KH, Liebeskind DS, Collaborators U-SS. Collateral Flow Averts Hemorrhagic Transformation After Endovascular Therapy for Acute Ischemic Stroke. Stroke 2011;42(8):2235-U2329.
14. Ribo M, Flores A, Rubiera M, Pagola J, Sargento-Freitas J, Rodriguez-Luna D, Coscojuela P, Maisterra O, Pineiro S, Romero FJ, Alvarez-Sabin J, Molina CA. Extending the time window for endovascular procedures according to collateral pial circulation. Stroke 2011;42(12):3465-3469. 15. Rafat N, Beck G, Pena-Tapia PG, Schmiedek P, Vajkoczy P. Increased levels of circulating
endothelial progenitor cells in patients with Moyamoya disease. Stroke 2009;40(2):432-438. 16. Research Committee on the P, Treatment of Spontaneous Occlusion of the Circle of W, Health
Labour Sciences Research Grant for Research on Measures for Infractable D. Guidelines for diagnosis and treatment of moyamoya disease (spontaneous occlusion of the circle of Willis). Neurol Med Chir (Tokyo) 2012;52(5):245-266.
17. Acker G, Fekonja L, Vajkoczy P. Surgical Management of Moyamoya Disease. Stroke 2018;49(2):476-482.
18. Folkman J. Tumor angiogenesis: therapeutic implications. N Engl J Med 1971;285(21):1182-1186.
Introduction and thesis outline
20. Fujima N, Kudo K, Yoshida D, Homma A, Sakashita T, Tsukahara A, Khin Khin T, Yuri Z, Satoshi T, Hiroki S. Arterial spin labeling to determine tumor viability in head and neck cancer before and after treatment. J Magn Reson Imaging 2014;40(4):920-928.
21. Kikuchi K, Hiwatashi A, Togao O, Yamashita K, Kamei R, Yoshimoto K, Iihara K, Suzuki SO, Iwaki T, Suzuki Y, Honda H. Arterial spin-labeling is useful for the diagnosis of residual or recurrent meningiomas. Eur Radiol 2018.
22. Kikuchi K, Hiwatashi A, Togao O, Yamashita K, Yoshimoto K, Mizoguchi M, Suzuki SO, Iwaki T, Suzuki Y, Honda H. Correlation between arterial spin-labeling perfusion and histopathological vascular density of pediatric intracranial tumors. J Neurooncol 2017;135(3):561-569.
23. Yamashita K, Yoshiura T, Hiwatashi A, Togao O, Yoshimoto K, Suzuki SO, Kikuchi K, Mizoguchi M, Iwaki T, Honda H. Arterial spin labeling of hemangioblastoma: differentiation from metastatic brain tumors based on quantitative blood flow measurement. Neuroradiology 2012;54(8):809-813. 24. Raper DM, Starke RM, Henderson F, Jr., Ding D, Simon S, Evans AJ, Jane JA, Sr., Liu KC. Preoperative
embolization of intracranial meningiomas: efficacy, technical considerations, and complications. AJNR Am J Neuroradiol 2014;35(9):1798-1804.
25. Dixon WT, Du LN, Faul DD, Gado M, Rossnick S. Projection angiograms of blood labeled by adiabatic fast passage. Magn Reson Med 1986;3(3):454-462.
26. Nishimura DG, Macovski A, Pauly JM, Conolly SM. MR angiography by selective inversion recovery. Magn Reson Med 1987;4(2):193-202.
27. Nishimura DG, Macovski A, Jackson JI, Hu RS, Stevick CA, Axel L. Magnetic resonance angiography by selective inversion recovery using a compact gradient echo sequence. Magn Reson Med 1988;8(1):96-103.
28. Edelman RR, Siewert B, Adamis M, Gaa J, Laub G, Wielopolski P. Signal targeting with alternating radiofrequency (STAR) sequences: application to MR angiography. Magn Reson Med 1994;31(2):233-238.
29. Edelman RR, Siewert B, Darby DG, Thangaraj V, Nobre AC, Mesulam MM, Warach S. Qualitative mapping of cerebral blood flow and functional localization with echo-planar MR imaging and signal targeting with alternating radio frequency. Radiology 1994;192(2):513-520.
30. Williams DS, Detre JA, Leigh JS, Koretsky AP. Magnetic resonance imaging of perfusion using spin inversion of arterial water. Proc Natl Acad Sci U S A 1992;89(1):212-216.
31. Detre JA, Leigh JS, Williams DS, Koretsky AP. Perfusion imaging. Magn Reson Med 1992;23(1):37-45. 32. Hoshino H, Izawa Y, Suzuki N, Research Committee on Moyamoya D. Epidemiological features of
moyamoya disease in Japan. Neurol Med Chir (Tokyo) 2012;52(5):295-298.
33. Yan L, Wang S, Zhuo Y, Wolf RL, Stiefel MF, An J, Ye Y, Zhang Q, Melhem ER, Wang DJ. Unenhanced dynamic MR angiography: high spatial and temporal resolution by using true FISP-based spin tagging with alternating radiofrequency. Radiology 2010;256(1):270-279.
34. Yan L, Salamon N, Wang DJ. Time-resolved noncontrast enhanced 4-D dynamic magnetic resonance angiography using multibolus TrueFISP-based spin tagging with alternating radiofrequency (TrueSTAR). Magn Reson Med 2014;71(2):551-560.
35. Iryo Y, Hirai T, Kai Y, Nakamura M, Shigematsu Y, Kitajima M, Azuma M, Komi M, Morita K, Yamashita Y. Intracranial dural arteriovenous fistulas: evaluation with 3-T four-dimensional MR angiography using arterial spin labeling. Radiology 2014;271(1):193-199.
36. Iryo Y, Hirai T, Nakamura M, Inoue Y, Watanabe M, Ando Y, Azuma M, Nishimura S, Shigematsu Y, Kitajima M, Yamashita Y. Collateral circulation via the circle of Willis in patients with carotid artery steno-occlusive disease: evaluation on 3-T 4D MRA using arterial spin labelling. Clin Radiol 2015;70(9):960-965.
1
38. Yu S, Yan L, Yao Y, Wang S, Yang M, Wang B, Zhuo Y, Ai L, Miao X, Zhao J, Wang DJ. Noncontrastdynamic MRA in intracranial arteriovenous malformation (AVM), comparison with time of flight (TOF) and digital subtraction angiography (DSA). Magn Reson Imaging 2012;30(6):869-877. 39. Suzuki Y, Fujima N, Ogino T, Meakin JA, Suwa A, Sugimori H, Van Cauteren M, van Osch MJP.
Acceleration of ASL-based time-resolved MR angiography by acquisition of control and labeled images in the same shot (ACTRESS). Magn Reson Med 2018;79(1):224-233.
40. Fujima N, Osanai T, Shimizu Y, Yoshida A, Harada T, Nakayama N, Kudo K, Houkin K, Shirato H. Utility of noncontrast-enhanced time-resolved four-dimensional MR angiography with a vessel-selective technique for intracranial arteriovenous malformations. J Magn Reson Imaging 2016;44(4):834-845.
41. Wong EC. Vessel-encoded arterial spin-labeling using pseudocontinuous tagging. Magnetic Resonance in Medicine 2007;58(6):1086-1091.
42. Okell TW, Schmitt P, Bi X, Chappell MA, Tijssen RH, Sheerin F, Miller KL, Jezzard P. Optimization of 4D vessel-selective arterial spin labeling angiography using balanced steady-state free precession and vessel-encoding. NMR Biomed 2016;29(6):776-786.
43. Ogg RJ, Kingsley PB, Taylor JS. WET, a T1- and B1-insensitive water-suppression method for in vivo localized 1H NMR spectroscopy. J Magn Reson B 1994;104(1):1-10.
44. Wells JA, Lythgoe MF, Gadian DG, Ordidge RJ, Thomas DL. In vivo Hadamard encoded continuous arterial spin labeling (H-CASL). Magn Reson Med 2010;63(4):1111-1118.
45. Alsop DC, Detre JA, Golay X, Gunther M, Hendrikse J, Hernandez-Garcia L, Lu H, MacIntosh BJ, Parkes LM, Smits M, van Osch MJ, Wang DJ, Wong EC, Zaharchuk G. Recommended implementation of arterial spin-labeled perfusion MRI for clinical applications: A consensus of the ISMRM perfusion study group and the European consortium for ASL in dementia. Magn Reson Med 2015;73(1):102-116.
46. Feinberg DA, Beckett A, Chen L. Arterial spin labeling with simultaneous multi-slice echo planar imaging. Magn Reson Med 2013;70(6):1500-1506.
47. Zhang K, Yun SD, Shah NJ. Tripled Readout Slices in Multi Time-Point pCASL Using Multiband Look-Locker EPI. PLoS One 2015;10(11):e0141108.
2
Acceleration of ASL-Based
Time-Resolved MR Angiography
by Acquisition of Control and
Labeled Images in the Same
Shot (ACTRESS)
Yuriko Suzuki
Noriyuki Fujima Tetsuo Ogino
James Alastair Meakin
Akira Suwa Hiroyuki Sugimori Marc Van Cauteren Matthias J. P. van Osch
Chapter 2
ACTRESS
Abstract
Purpose: Non-contrast 4D-MR-angiography (MRA) using arterial spin labeling
(ASL) is beneficial because high spatial and temporal resolution can be achieved. However, ASL requires acquisition of labeled and control images for each phase. The purpose of this study is to present a new accelerated 4D-MRA approach that requires only a single control acquisition, achieving similar image quality in approximately half the scan time.
Methods: In a multi-phase Look-Locker sequence, the first phase was used
as the control image and the labeling pulse was applied before the second phase. By acquiring the control and labeled images within a single Look-Locker cycle, 4D-MRA was generated in nearly half the scan time of conventional ASL. However, this approach potentially could be more sensitive to off-resonance and magnetization transfer (MT) effects. To counter this, careful optimizations of the labeling pulse were performed by Bloch simulations. In in vivo studies arterial visualization was compared between the new and conventional ASL approaches.
Results: Optimization of the labeling pulse successfully minimized
off-resonance effects. Qualitative assessment showed that residual MT effects did not degrade visualization of the peripheral arteries.
Conclusion: This study demonstrated that the proposed approach achieved
2
Introduction
Evaluation of cerebrovascular hemodynamics provides crucial information for accurate diagnosis, treatment selection and follow-up of diseases such as arteriovenous malformation, arteriovenous fistula and steno-occlusive disease. Recently, there has been an increasing number of clinical reports using arterial spin labeling (ASL) for non-contrast enhanced (non-CE) magnetic resonance angiography (MRA) (1-6), mainly due to the possibility of time-resolved (4D) MRA as well as vessel-specificity by restricting the labeling to a single vessel (7,8).
4D-MRA can be achieved by acquiring images with different inversion time (TIs), for example, by using a Look-Locker readout (9). The benefit of 4D-MRA using ASL is that injection of the contrast agent is not required and that both high temporal and spatial resolution can be achieved. Unlike CE-MRA, which must capture the quick first passage of the contrast agent and therefore suffers from a compromise between temporal and spatial resolution, labeling of arterial blood can be repeated until sufficient data are acquired to achieve both high temporal and spatial resolution, thus enabling detailed visualization of arterial flow hemodynamics by ASL. To achieve this advantage, ASL-based 4D-MRA usually requires a longer acquisition time than CE-MRA. A second reason for the longer acquisition time of ASL-based 4D-MRA is that ASL techniques require acquisition of two images: one in which the arterial blood is inverted (labeled image) and in the other in which the arterial blood is not inverted (control image). By subtraction of these two images, the background static tissue signal is cancelled out and the inflow of the labeled arterial blood is visualized. The mean acquisition time of previously reported ASL-based 4D-MRA is approximately 7 minutes (5 min – 8.5 min) (1-6), which is not always fast enough to enable its use in clinical protocols.
ACTRESS
The purpose of this article is to optimize ACTRESS MRA so that it enables generation of 4D-MRA images of a similar quality to the conventional ASL sequence in nearly half the scan time while avoiding possible artefacts caused by the absence of the separate acquisition of control images. This approach can significantly improve the clinical usability of 4D-MRA due to shorter scan time, which also reduces the occurrence of motion artefacts associated with longer scan duration.
METHODS
Introduction of the ACTRESS Sequence
The principle of ACTRESS-MRA is illustrated in Figure 1. The sequence consists of a 3D multi-shot, multi-phase (multi-TI) Look-Locker readout in combination with a spatially selective labeling pulse, which is applied prior to the readout of the second phase. It is assumed that the image acquired in the first phase does not have a contribution from labeled blood and can therefore be employed as a control image. In the second and later phases, arterial blood that has been inverted by the labeling pulse will flow into the arterial system, thereby reducing the signal from blood. 4D-MRA images can be generated by subtracting all labeled images (2nd – Nth phase) from the single control image, that is, the first phase. By choosing a long-enough cycle duration, all labeled blood has left the arterial system before the next control phase is acquired. The ACTRESS approach acquires all images necessary to generate 4D-MRA in approximately half the scan time of a conventional ASL approach because by employing the first phase as control image it is no longer necessary to acquire a full, separate set of control images.
2
of off-resonance effects include fat and tissue surrounding the paranasal sinuses. Such an influence would result in changes of the static tissue signal after the labeling pulse and recovery in the following phases, leading to subtraction artefacts. In a conventional ASL sequence, such off-resonance effects are avoided by saturating the imaging slices before and after the labeling pulse. For ACTRESS, however, saturation pulses cannot be used because the signal from static tissue should be as constant as possible over all phases to avoid subtraction artefacts. Similarly, on-resonant tissue can show subtraction artefacts when the inversion profile of the labeling pulse is not sharp enough and the tissue magnetization inside the imaging volume is directly affected by the labeling pulse. Finally, MT effects from the labeling pulse could affect the static tissue signal. In conventional ASL, MT effects are eliminated by using a noninverting control pulse with the same RF power for the control condition so that MT effects will be similar between label and control images and therefore subtracted out. For pulsed ASL (PASL) techniques, application of a post-labeling saturation pulse helps to eliminate residual MT effects even further. However, to minimize MT effects in ACTRESS-MRA for which no RF pulse is applied for the control condition and a post-labeling saturation pulse cannot be applied, RF energy for the labeling pulse should be kept as low as possible. Considering all these potential issues, the labeling RF pulse should be optimized to 1) exhibit minimal off-resonance and 2) minimal
Figure 1: Basic sequence diagram of ACTRESS approach. A spatially selective labeling pulse is
ACTRESS
MT effects, 3) provide an excellent labeling efficiency and 4) a sharp profile. In this study, we will consider both hyperbolic secant (HS) (10) as well as Frequency offset corrected inversion (FOCI) (11) pulses for performing the labeling.
Optimization of the Labeling RF Pulse
The HS inversion pulse is one of the most commonly used adiabatic labeling pulses for PASL. It enables uniform inversion over a wide range of B1 amplitudes and can be described by:
BHS(t) = [ A
0sech (βt)]1+iµ
1 [1]
in which A0 is the maximum B1 field, β is the angular frequency which determines the truncation level, and μ is a dimensionless scaling parameter that defines the degree of phase modulation (12,13). The BW of the HS inversion pulse can be calculated to be
Δf = μβ / π (in Hz) [2]
For convenience of RF pulse implementation, the parameter βnorm was introduced (defined as
βnorm = β RFdur / 2 [3] with RFdur the duration of the RF pulse in seconds).
A disadvantage of the HS pulse is that the BW is rather narrow and therefore is prone to exert large off-resonance effects, which therefore might be less ideal for our single acquisition approach. The FOCI pulse is a modification of the HS inversion pulse (11,14-16), which provides a sharper inversion profile as well as a broader BW by multiplying the RF amplitude, frequency modulation and gradient amplitude with an additional modulation function α(t):
AFOCI(t) = α(t) AHS(t)
ΔωFOCI(t) = α(t) ΔωHS(t)
GFOCI(t) = α(t) GHS
α(t) = cosh(βt) when cosh(βt) < αmax otherwise
2
in which GHS is the selection gradient amplitude used for the HS pulse. In this study,
an additional Gaussian modulation is applied to the amplitude modulation aiming for further improvement of the slab profile:
AFOCI(t) = α(t) AHS(t) exp (–GG2 t2) [5]
in which GG2 is a parameter that defines the strength of Gaussian modulation.
Bloch equation simulations were performed in MATLAB (Mathworks, Natick, MA, USA) using the maximum B1 amplitude of 13.47 μT allowed on our clinical 3.0 tesla (T) scanner. The inversion profile, off-resonance effects and labeling efficiency of HS and FOCI pulses were investigated while optimizing the RF pulse parameters: βnorm, µ and RF integral (defined as
RF integral = γ ∫RF dur A(t)dt
0 [6]
corresponding to the RF energy needed to achieve a certain flip angle by a simple nonadiabatic RF pulse) for both the HS and FOCI pulses, and αmax and GG2 for the FOCI pulse. The time-varying BW of FOCI pulse ΔfFOCI(t) was calculated from the
time-varying gradient GFOCI(t), the labeling slab thickness Δz and gyromagnetic ratio γ,
ΔƒFOCI(t) = γGFOCI(t)Δz [7]
and its mean value was defined as the effective BW of the FOCI pulse to reduce the resulting off-resonance effects. The default settings on our scanner for βnorm, µ and RF integral of the HS labeling pulse for the Signal Targeting with Alternating Radio Frequency (STAR) sequence (17) are 4.0, 5.0 and 850, respectively. These values were used for comparison and will be referred to as default settings. In this simulation, the labeling slab thickness was set to 100 mm, and the T1 and T2 value of 1450 ms and 85 ms, which were approximate mean value of gray matter and white matter in 3T (18), were used.
In Vivo Healthy Volunteer Study
ACTRESS
Following the results of the Bloch equation simulation (see Results/Discussion section), an in vivo healthy volunteer study was performed using the optimized HS- and FOCI-labeling pulses focusing on finding the optimal inversion thickness of the labeling slab. Also, the images acquired with the ACTRESS sequence were compared to a traditional ASL-based 4D-MRA sequence (STAR), with similar imaging parameters.
The thickness of the labeling slab was set to 80, 100, 120, 160 and 200 mm, whereas the gap between the labeling and imaging volume was fixed at 20 mm. Care was taken to select the appropriate polarity of the volume selection gradient of the labeling pulse to avoid off-resonance effects of the fat within the imaging volume. For the first volunteer, the default settings of the HS labeling pulse were used and compared to the optimized HS and FOCI pulses. However, because severe off-resonance effects were observed with the default HS pulse (see Figure 4), only the optimized HS and FOCI pulses were used for the other five volunteers. For these five volunteers, 4D-MRA using the STAR sequence was added for comparison. Table 1b shows the RF pulse parameters used for the first and other five volunteers.
2
Image Processing of In Vivo Data
First, magnitude subtraction of all labeled images (2nd – Nth phase; N=12) from the control image acquired during the first phase of the sequence was performed. Maximum intensity projection (MIP) images for each temporal phase were generated in sagittal, transverse and coronal directions.
In order to assess MT effects of the tested labeling pulses, the signal intensity of the background brain tissue on the subtracted images was measured through all temporal phases. For each volunteer, MIPs were produced across all temporal phases for each slice (temporal MIP), and two regions of interest (ROIs) were manually drawn on the left and right side of the brain on the 10th, 20th, 30th, 40th and 50th slice, avoiding obvious vessels and artefacts. These ten ROIs were copied to the substracted, non-MIP images and the mean value was calculated as a function of TIs.
To investigate the relation between the labeling slab thickness and the bolus shape of the labeled blood, signal intensity in the M3 segment of both middle cerebral arteries was measured. A MIP image across all phases in the transverse orientation was generated (4D-MIP). On one of them, two ROIs were manually drawn to indicate the M3, and these two ROIs were copied to all other 4D-MIPs. In these ROIs, 20 pixels with the highest signal intensity were chosen, and the mean signal intensity curves over all temporal phases were obtained.
Finally, a qualitative comparison of image quality and visualization of arteries was performed between ACTRESS-MRA and 4D-MRA acquired using the STAR sequence by a board-certified neuroradiologist with 12 years of experience (N.F.). The scoring system was as following:
• Visualization of peripheral arteries, superficial temporal artery (STA) and occipital artery (OA):
4 = excellent, 3 = good, 2 = moderate, 1 = poor
• Noise from the background tissue and off-resonance artefacts:
ACTRESS
Results
Optimization of the Labeling RF Pulse
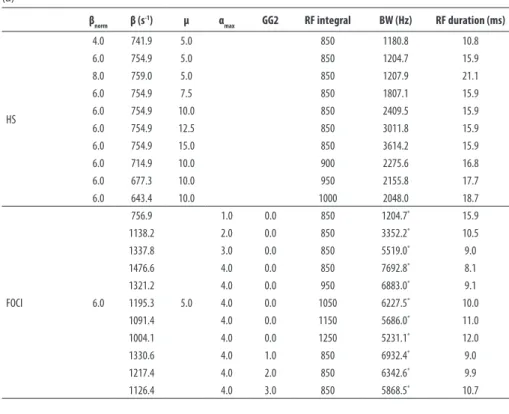
Table 1a shows the simulated values of BW and RF duration produced by changing the RF pulse parameters. When varying βnorm while keeping µ and the RF integral fixed at default settings of 5.0 and 850, respectively, a higher βnorm prolonged the RF pulse duration in a nearly linear relationship, because the maximum B1 amplitude was limited by that of the MRI scanner. Due to the concomitant increase in pulse duration, the increase of BW, which would help to reduce the off-resonance effects, was limited. Therefore, similar inversion profiles and off-resonance effects were observed for βnorm of 4.0, 6.0 and 8.0 (Figure 2a). For further optimization, βnorm was set to 6.0 with a truncation level of 0.5 % of the maximum HS amplitude and RF duration of 15.9 ms (for an RF integral of 850), both which are presumed not to generate degradation of the slice profile. A higher value of µ resulted in an increase of BW. However, the simulated inversion profile showed reduced labeling efficiency with higher µ (Figure 2b), which can be counteracted by increasing the RF integral (Figure 2c). Based on these results, βnorm of 6.0, µ of 10.0 and an RF integral of 1000, resulting in RF duration of 18.7 ms, were used as the optimized HS pulse in the in vivo studies.
2
Table 1: RF Parameters Used in the Bloch Equation Simulation (a), and In Vivo study (b).
(a)
βnorm β (s-1) µ α
max GG2 RF integral BW (Hz) RF duration (ms)
HS
4.0 741.9 5.0 850 1180.8 10.8
6.0 754.9 5.0 850 1204.7 15.9
8.0 759.0 5.0 850 1207.9 21.1
6.0 754.9 7.5 850 1807.1 15.9
6.0 754.9 10.0 850 2409.5 15.9
6.0 754.9 12.5 850 3011.8 15.9
6.0 754.9 15.0 850 3614.2 15.9
6.0 714.9 10.0 900 2275.6 16.8
6.0 677.3 10.0 950 2155.8 17.7
6.0 643.4 10.0 1000 2048.0 18.7
FOCI 6.0
756.9
5.0
1.0 0.0 850 1204.7* 15.9
1138.2 2.0 0.0 850 3352.2* 10.5
1337.8 3.0 0.0 850 5519.0* 9.0
1476.6 4.0 0.0 850 7692.8* 8.1
1321.2 4.0 0.0 950 6883.0* 9.1
1195.3 4.0 0.0 1050 6227.5* 10.0
1091.4 4.0 0.0 1150 5686.0* 11.0
1004.1 4.0 0.0 1250 5231.1* 12.0
1330.6 4.0 1.0 850 6932.4* 9.0
1217.4 4.0 2.0 850 6342.6* 9.9
1126.4 4.0 3.0 850 5868.5* 10.7
(b)
Default HS** 4.0 741.9 5.0 850 1180.8 10.8
Optimized HS 6.0 643.4 10.0 1000 2048.0 18.7 Optimized Foci 6.0 1168.3 3.0 4.0 1.2 950 3652.1* 10.3
* Effective BW calculated using equation [7] **Also used for STAR sequence
ACTRESS
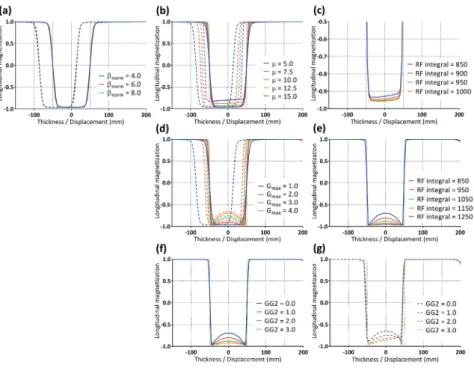
Figure 2: Simulated inversion profile curves. (a) HS pulse, varying βnorm with fixed µ and RF integral at default settings of 5.0 and 850, (b) HS pulse with varying µ (βnorm = 6.0, RF integral = 850), (c) HS pulse with varying RF integral (βnorm = 6.0 µ = 10.0), (d) FOCI pulse with varying αmax (βnorm = 6.0 µ = 5.0, RF integral = 850, GG2 = 0.0), (e) FOCI pulse with varying RF integral (βnorm = 6.0 µ = 5.0, αmax = 4.0, GG2 = 0.0), (f) FOCI pulse with varying GG2 (βnorm = 6.0 µ = 5.0, RF integral = 850, αmax = 4.0) at on-resonance, and (g) off-resonance of 3.4 ppm. For all graphs, solid-line and dashed-line represent on-resonance and off-resonance of 3.4 ppm, respectively.
Figure 3: Simulated inversion
2
In Vivo Studies
Figure 4 shows that severe signal elevation was observed in off-resonant regions, such as tissue surrounding the paranasal sinuses and the petrous part of the temporal bone when the HS labeling pulse with the default settings was used. Similar artefacts were only present for the optimized HS pulses when a labeling slab of 200 mm thickness or thicker were employed. With the optimized FOCI pulses, no off-resonance artefacts were observed in any of the volunteers.
Figure 4: Severe signal elevation was observed at tissue surrounding the paranasal sinuses (yellow
arrows) and the petrous part of the temporal bone (red arrow heads) when the HS labeling pulse with the default settings was used. Similar artefacts were only present for the optimized HS pulses when 200 mm thick (or thicker) labeling slabs were employed. With the optimized FOCI pulses, no off-resonance artefacts were observed in any of the volunteers.
ACTRESS
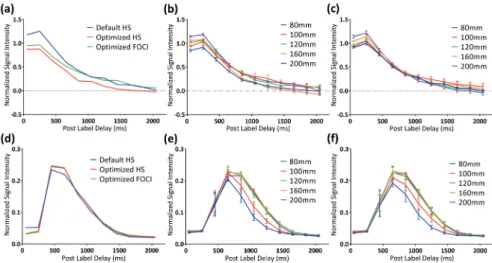
Figure 5d shows the averaged signal intensity time courses, as measured in the M3 segment using the default HS, optimized HS and FOCI pulses. The optimized HS and FOCI pulses generated very similar arterial signal, whereas the default HS pulse showed slightly lower signals during the peak of the bolus curve (Figure 5d). For both optimized pulses (Figure 5e and f ), a thinner labeling slab of 80 and 100 mm resulted in lower maximum signal intensity, as well as smaller full-width half-maximum of the bolus curve. However, results from thicker labeling slabs of 160 and 200 mm did not differ significantly from the 120 mm labeling slab thickness, presumably due to the limited range of the body transmit coil.
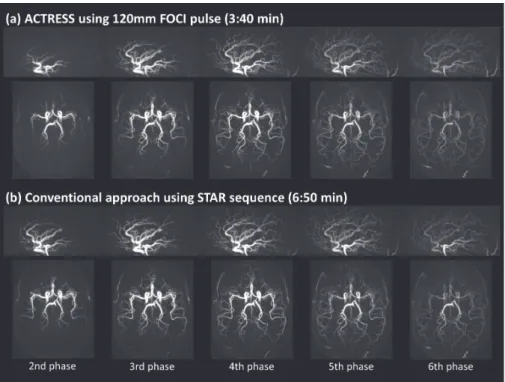
The results of the qualitative comparison of image quality and visualization of arteries between ACTRESS-MRA and 4D-MRA using the STAR sequence are shown in Table 2, and Figure 6 shows example images from a representative volunteer. These images demonstrate that the ACTRESS approach can provide visualization of the dynamic passage of labeled blood flow through the vascular tree of a similar quality to the standard STAR sequence. This similar performance was corroborated by the observer study, which showed no difference in qualitative scoring measures between ACTRESS and the conventional ASL technique (STAR). Slightly reduced visibility of peripheral arteries was observed for ACTRESS-MRA, with thickness of 80 and 100 mm labeling slab thickness as compared to 120, 160 and 200 mm, as well as the STAR images. Similarly, labeling slab thicker than 120 mm did not have an obvious benefit for visualization of the STA, OA or the peripheral arteries as compared to the labeling slab of 120 mm. In fact, the visibility of OA was slightly weaker for ACTRESS-MRA for a labeling thickness of 160 and 200 mm as compared to 120 mm thickness.
2
Figure 5: Signal intensity curves over the readout phases acquired from in vivo study. (a) Background
static tissue signal acquired with different RF pulses as measured in the first volunteer. (b) Averaged background static tissue signal over all six volunteers acquired with different labeling slab thickness of the optimized HS pulses, and (c) optimized FOCI pulses. (d) Arterial signal measured in the M3 segment using different RF pulses as measured in the first volunteer. (e) Averaged arterial signal over all six volunteers using the optimized HS pulses, and (f) optimized FOCI pulses.
Table 2: The scores of the qualitative comparison of image quality and visualization of arteries
between ACTRESS-MRA and conventional 4D-MRA using the STAR sequence.
Thickness (mm) Visualization of peripheral arteries Visualization of STA Visualization of OA
Noise on the background tissue
Off-resonance artefacts
ACTRESS (Optimized HS)
80 3.2 3.8 3.6 2.8 3.0
100 3.8 3.8 3.6 2.8 3.0
120 4.0 3.8 3.6 2.8 3.0
160 4.0 3.8 3.4 2.8 2.4
200 4.0 3.8 3.4 2.8 1.6
ACTRESS (Optimized Foci)
80 3.0 3.8 3.6 2.8 3.0
100 3.6 3.8 3.6 2.8 3.0
120 4.0 3.8 3.6 2.8 3.0
160 4.0 3.8 3.4 2.8 3.0
200 4.0 3.8 3.4 2.8 3.0
STAR 300 3.8 3.8 3.8 2.8 3.0
ACTRESS
Figure 6: Example images of ACTRESS-MRA and conventional 4D-MRA using the STAR sequence.
Discussion
In this study, we have presented a new ASL-based 4D-MRA technique, ACTRESS, which nearly halves the acquisition time of the conventional sequence by acquiring the labeled and control images in a single Look-Locker readout cycle. This brought down the typical acquisition time of a 4D-MRA sequence from approximately 7 to 3.5 minutes, which in clinical practice could be the difference between inclusion or exclusion of a 4D-MRA sequence in an examination protocol. We optimized the labeling RF pulse to minimize potential artefacts, and our observer study demonstrated that the ACTRESS-MRA achieved a very similar image quality to the standard ASL 4D-MRA.
2
allowed by the employed scanner, or by increasing the RF integral. However, these improvements would be achieved at the expense of increased MT effects. By applying the Gaussian modulation, the distortion of the inversion profile was reduced without a concomitant increase of MT effects, although very strong Gaussian modulation induced asymmetrical distortions at off-resonance. Considering these observations and the fact that our ACTRESS approach is sensitive to MT effects, combination of the increase of RF integral and moderate Gaussian modulation was found to be optimal for the ACTRESS approach. Potentially, other adiabatic pulses such as BASSI-pulses (Bandwidth-modulated Adiabatic RF pulses for uniform Selective Saturation and Inversion) (19) could achieve similar or even slightly better results, which could be tested for future implementations.
After the optimization of the labeling pulse, our in vivo study showed that the artefacts due to the off-resonance effects were minimized by increasing the BW of the HS labeling pulse, and completely annulled by use of the FOCI pulse. Furthermore, it was found that the optimization of the labeling pulse was accompanied by a reduction of MT effects in the static tissue. For both optimized HS and FOCI pulses, a wider range of frequency sweeps was applied to achieve a wider BW as compared to the default settings, and we can deduce that the MT effects within the imaging volume were reduced due to these larger frequency offsets. Control for MT effects is especially essential for perfusion imaging such that the signal intensity of the subtracted image reflects only the inflow of labeled arterial blood, hereby enabling accurate estimation of the cerebral blood flow (CBF). However, the prime goal of 4D-MRA is visualization of blood flow within the vasculature, which allows for some background signal to be present as long as it does not obscure visualization of the small vessels. The observer study demonstrated that the remaining MT effects for the optimized HS and FOCI pulses did not degrade the visualization of peripheral arteries in ACTRESS-MRA. However, it should be noted that for now this approach is applicable only for 4D-MRA, whereas for perfusion imaging it will be difficult to use the same approach because it will be more sensitive to MT effects due to the much lower perfusion signal compared to the intensity of background tissue.
ACTRESS
paranasal sinuses, it could cause larger off-resonance, and artefacts may appear even with a labeling thickness of 120 mm. To minimize the risk of artefacts, the use of FOCI pulses is recommended to achieve wider BW.
In the ACTRESS approach, it is assumed that the image acquired in the first phase does not have any labeled blood present to enable the use of the first phase image as the control image. However, this assumption could fail if the Look-Locker multi-phase acquisition is terminated before all labeled blood has disappeared from the arterial vessels by flow and/or decay of the labeling due to T1 relaxation. If labeled blood were still present in the arterial vessels, this will cause reduced signal intensity from those arteries in the control image, because the last phase of the Look-Locker readout is immediately followed by the first phase of the next Look-Locker readout cycle. Therefore, it is important to set the Look-Locker readout cycle duration long enough such that all labeled blood has flowed away or disappeared due to T1 relaxation. This requires special attention in patients who have slow arterial flow and thus late arrival of label. Due to the cyclic properties of ACTRESS, an alternative way of presenting the technique would be that the last phase of the Look-Locker readout is used as control image with the label pulse played out just before the readout of the first Look-Locker phase. This alternative viewpoint might be helpful to understand the influence of slow flow on the 4D-MRA ACTRESS images.
2
Conclusion
ACTRESS
References
1. Yan L, Wang S, Zhuo Y, Wolf RL, Stiefel MF, An J, Ye Y, Zhang Q, Melhem ER, Wang DJ. Unenhanced dynamic MR angiography: high spatial and temporal resolution by using true FISP-based spin tagging with alternating radiofrequency. Radiology 2010;256(1):270-279.
2. Yan L, Salamon N, Wang DJ. Time-resolved noncontrast enhanced 4-D dynamic magnetic resonance angiography using multibolus TrueFISP-based spin tagging with alternating radiofrequency (TrueSTAR). Magn Reson Med 2014;71(2):551-560.
3. Iryo Y, Hirai T, Kai Y, Nakamura M, Shigematsu Y, Kitajima M, Azuma M, Komi M, Morita K, Yamashita Y. Intracranial dural arteriovenous fistulas: evaluation with 3-T four-dimensional MR angiography using arterial spin labeling. Radiology 2014;271(1):193-199.
4. Iryo Y, Hirai T, Nakamura M, Inoue Y, Watanabe M, Ando Y, Azuma M, Nishimura S, Shigematsu Y, Kitajima M, Yamashita Y. Collateral circulation via the circle of Willis in patients with carotid artery steno-occlusive disease: evaluation on 3-T 4D MRA using arterial spin labelling. Clin Radiol 2015;70(9):960-965.
5. Uchino H, Ito M, Fujima N, Kazumata K, Yamazaki K, Nakayama N, Kuroda S, Houkin K. A novel application of four-dimensional magnetic resonance angiography using an arterial spin labeling technique for noninvasive diagnosis of Moyamoya disease. Clin Neurol Neurosurg 2015;137:105-111.
6. Yu S, Yan L, Yao Y, Wang S, Yang M, Wang B, Zhuo Y, Ai L, Miao X, Zhao J, Wang DJ. Noncontrast dynamic MRA in intracranial arteriovenous malformation (AVM), comparison with time of flight (TOF) and digital subtraction angiography (DSA). Magn Reson Imaging 2012;30(6):869-877. 7. Fujima N, Osanai T, Shimizu Y, Yoshida A, Harada T, Nakayama N, Kudo K, Houkin K, Shirato H.
Utility of noncontrast-enhanced time-resolved four-dimensional MR angiography with a vessel-selective technique for intracranial arteriovenous malformations. J Magn Reson Imaging 2016. 8. Jensen-Kondering U, Lindner T, van Osch MJ, Rohr A, Jansen O, Helle M. Superselective
pseudo-continuous arterial spin labeling angiography. Eur J Radiol 2015;84(9):1758-1767.
9. Gunther M, Bock M, Schad LR. Arterial spin labeling in combination with a look-locker sampling strategy: inflow turbo-sampling EPI-FAIR (ITS-FAIR). Magn Reson Med 2001;46(5):974-984. 10. Silver MS, Joseph RI, Hoult DI. Selective spin inversion in nuclear magnetic resonance and
coherent optics through an exact solution of the Bloch-Riccati equation. Phys Rev A Gen Phys 1985;31(4):2753-2755.
11. Ordidge RJ, Wylezinska M, Hugg JW, Butterworth E, Franconi F. Frequency offset corrected inversion (FOCI) pulses for use in localized spectroscopy. Magn Reson Med 1996;36(4):562-566. 12. Norris DG. Adiabatic radiofrequency pulse forms in biomedical nuclear magnetic resonance.
Concept Magnetic Res 2002;14(2):89-101.
13. Bernstein MA, King KF, Zhou XJ. Handbook of MRI Pulse Sequences: Elsevier Science; 2004. 14. Payne GS, Leach MO. Implementation and evaluation of frequency offset corrected inversion
(FOCI) pulses on a clinical MR system. Magn Reson Med 1997;38(5):828-833.
15. Yongbi MN, Branch CA, Helpern JA. Perfusion imaging using FOCI RF pulses. Magn Reson Med 1998;40(6):938-943.
16. Yongbi MN, Yang Y, Frank JA, Duyn JH. Multislice perfusion imaging in human brain using the C-FOCI inversion pulse: comparison with hyperbolic secant. Magn Reson Med 1999;42(6):1098-1105.
17. Edelman RR, Siewert B, Darby DG, Thangaraj V, Nobre AC, Mesulam MM, Warach S. Qualitative mapping of cerebral blood flow and functional localization with echo-planar MR imaging and signal targeting with alternating radio frequency. Radiology 1994;192(2):513-520.
2
19. Warnking JM, Pike GB. Bandwidth-modulated adiabatic RF pulses for uniform selectivesaturation and inversion. Magn Reson Med 2004;52(5):1190-1199.
3
Optimization of the Spatial
Modulation Function of
Vessel-Encoded Pseudo-Continuous
ASL and its Application to
Dynamic Angiography
Yuriko Suzuki
Matthias J. P. van Osch Noriyuki Fujima Thomas W. Okell
Chapter 3
Optimization of ve-pCASL 4D-MRA
Abstract
Purpose: In vessel-encoded pseudo-continuous arterial spin labeling (ve-pCASL), vessel-selective labeling is achieved by modulation of the inversion efficiency across space. However, the spatial transition between the labeling and control conditions is rather gradual, which can cause partial labeling of vessels, reducing SNR-efficiency and necessitating complex post-processing to decode the vessel-selective signals. The purpose of this study is to optimize the pCASL labeling parameters to obtain a sharper spatial inversion profile of the labeling and thereby minimizing the risk of partial labeling of untargeted arteries.
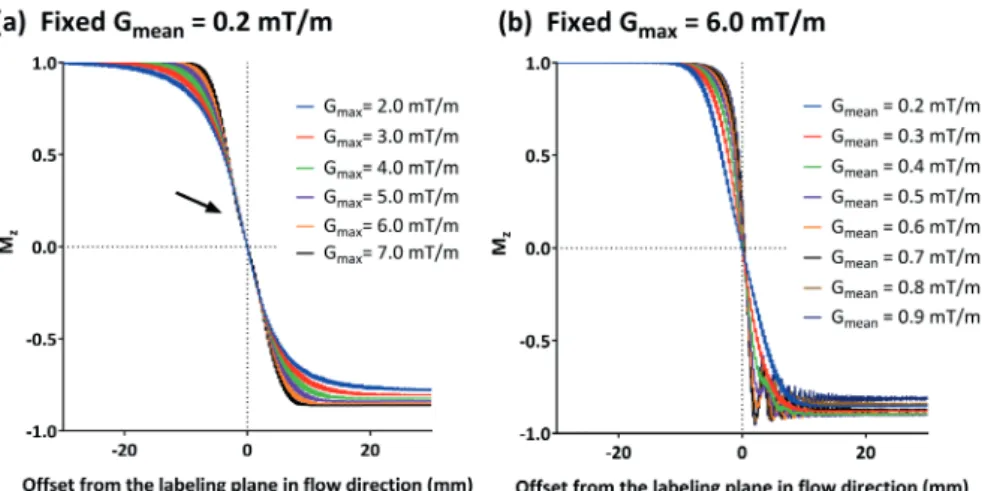
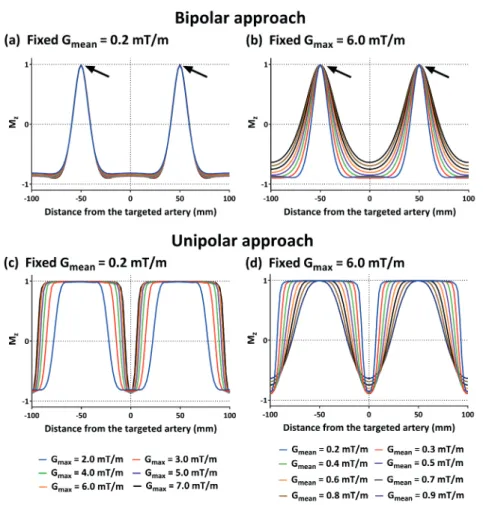
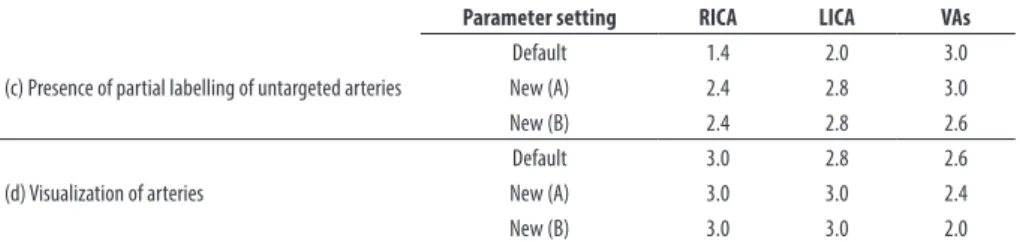
Methods: Bloch simulations were performed to investigate how the inversion profile was influenced by the pCASL labeling parameters: the maximum (Gmax) and mean (Gmean) labeling gradient were varied for ve-pCASL with unipolar and bipolar gradients. The findings in the simulation study were subsequently confirmed in an in vivo volunteer study. Moreover, conventional and optimized settings were compared for 4D-MRA using four-cycle Hadamard ve-pCASL; the visualization of arteries and the presence of the partial labeling were assessed by an expert observer.
Results: When using unipolar gradient, lower Gmean resulted in a steeper spatial transition, whereas the width of the control region was broader for higher Gmax. The in vivo study confirmed these findings. When using bipolar gradients, the control region was always very narrow. Qualitative comparison of the 4D-MRA demonstrated lower occurrence of partial labeling when using the optimized gradient parameters.
3
Introduction
In the last decade, dynamic MRA (4D-MRA) using arterial spin labeling (ASL) has become an important alternative to contrast-enhanced (CE) 4D-MRA in the brain. The use of ASL for 4D-MRA has several advantages, which are not only its ability to visualize arteries without using contrast agent, but also fewer constraints on the attainable spatial and temporal resolution, because ASL does not need to capture the first passage of the bolus (labeled blood) in real-time, unlike CE-4D-MRA. The ability to exclusively visualize the vascular tree arising from a selected artery by means of vessel selective labeling is an additional advantage of ASL-based MRA, which provides beneficial information for the diagnosis, treatment planning and follow-up of many cerebrovascular diseases (1,2).
Both pulsed-ASL (PASL) and pseudo-continuous ASL (pCASL) can provide vessel selective labeling, but their approaches are fundamentally different. In PASL, a spatially selective inversion slab is applied to the targeted artery or arteries, which is usually planned parallel to the arteries in the neck, so that the labeling pulse covers the target arteries over a long distance to label a sufficient amount of arterial blood (2-4). The benefit of the PASL technique for selective labeling is a sharp profile of the labeling slab, which achieves clear selectivity of the targeted artery from untargeted arteries. However, to label as much arterial blood as possible, the labeling slab has to cover a large part of the target artery, which frequently results in erroneous inclusion of other, untargeted arteries, because of tortuous vascular anatomy (5).
Optimization of ve-pCASL 4D-MRA
individual contributions from each vessel. Previously, ve-pCASL with eight-cycled Hadamard-encodings was presented for ve-4D-MRA of four arteries with relatively high spatial and temporal resolution (10). For post-processing this study relied on Bayesian inference analysis to solve partial labeling of untargeted arteries (11). When considering application in clinical protocols, the eight encodings and their associated long scan time of 18 minutes, would be an important hurdle for its use and would make the examination prone to artefacts due to subject motion.
In this article, we investigate how the in-plane spatial modulation of the vessel selective inversion labeling in ve-pCASL can be controlled by changing the labeling parameters such as the maximum (Gmax) and mean (Gmean) labeling gradient strength, so that a sharper spatial modulation and broader, flatter control regions can be achieved. With these improvements, a more SNR-efficient encoding can be performed. Moreover, the sharper inversion profile and broader, flatter control regions could enable two or more spatially distinct arterial branches to be encoded in a near-identical manner, such that they can be treated as a single artery in the analysis, allowing a reduced number of vessel-encodings to be performed. To this end, first Bloch simulations are performed to elucidate the relationship between the shape of the inversion profile and the pCASL labeling parameters. Subsequently, these findings are validated in an in vivo study. Finally, the optimized inversion profile of the ve-pCASL sequence is applied to a 4D-MRA protocol (6) to demonstrate the ability to allow both vertebral arteries (VAs) to be encoded as a single entity, despite their spatial separation. This enables a three-vessel encoding scheme, which only requires four-cycled Hadamard-encodings (12), thereby reducing the scan time by a factor of two compared to our previous sequence based on eight Hadamard-encodings (10).
Methods
Spatial modulation of ve-pCASL labeling
To devise a strategy for optimizing the inversion profile of ve-pCASL, we first revisit the mechanism which underlies this process and consider how it might be affected by various sequence parameters. For vessel selective labeling in ve-pCASL, additional gradients (Gxy) are applied in between the labeling RF pulses to generate in-plane phase differences. In one implementation Gxy is applied alternately positive and negative (Figure 1a) (6), whereas in another approach Gxy is not alternated (Figure 1b) (9). These two approaches will be subsequently referred to as the bipolar approach
3
Figure 1: Schematic diagrams of pCASL labeling and additional gradients applied in the in-plane
direction (Gxy), which are colored in red and blue, to achieve the spatial modulation. (a) In the bipolar approach, Gxy is applied alternately positive and negative, and (b) in the unipolar approach, Gxy is always played out with the same polarity.
Optimization of ve-pCASL 4D-MRA
Figure 2: Schematic drawings illustrating: (a) the “inversion line”, which is determined by the two
orthogonal gradients, Gmean and Gxy, (b) wflow indicating the distance over which adiabatic inversion occurs in the flow direction, θinversion the angle between the inversion line and the labeling plane, and Wlabel which represents the width of the labeling condition for vessel selective labeling. (c) In the bipolar approach, the inversion line is flipped every other Gxy, resulting in an averaged inversion line parallel to the labeling plane.
Bloch equation simulations
3
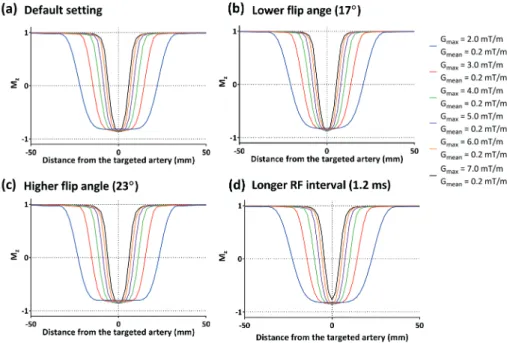
pulse interval of 1.2 ms, and different flip angles of 17º and 23º were also simulated. T2 of blood was assumed to be 200 ms and T1 recovery was neglected (6,14).
In vivo healthy volunteer study
Following the simulation study, two in vivo volunteer studies were conducted (i) to validate the spatial modulation of the inversion as observed in the simulation study, and (ii) to demonstrate the potential improvement of ve-pCASL 4D-MRA when using the selected optimal settings. All scans were performed on a Siemens 3T TIM Verio (Siemens Healthineers, Erlangen, Germany) under a technical development protocol agreed by local ethics and institutional committees. A total of six volunteers (female = 3, mean age = 36 years [range 27 – 46 years]) without known cerebrovascular disease participated in the studies, in which one participated only in study-(i), one participated in both studies, and the other four volunteers participated only in study-(ii).
(i) Validation of the inversion spatial modulation
To validate the inversion profile vessel selective labeling was performed within a labeling plane approximately 8cm below the circle of Willis, through the proximal V3 segment of the vertebral arteries (VAs), where the internal carotid arteries (ICAs) and VAs form an approximately rectangular arrangement. The transverse gradient (Gxy) was applied in the right-left (RL) direction with the amplitude corresponding to a π phase difference between the right ICA (RICA) and left ICA (LICA). The center of the selective labeling was first located at the RICA (i.e. the center of the control condition at the LICA) and was subsequently shifted toward the LICA in steps of 2 mm until the center of labeling condition reached the LICA (at the same time, the RICA will experience the center of the control condition). At each offset, two acquisitions were performed with an alternating π-phase difference of the labeling RF pulse train for the second acquisition, which effectively swaps the location of the control and labeling condition. Additionally, a pair of non-selective labeling and control conditions was acquired.
Optimization of ve-pCASL 4D-MRA
Following the results of the Bloch equation simulations (see Results section), the unipolar approach was adopted and two combinations of Gmax and Gmean were compared with the default settings (as defined in the simulation study) new setting-(A): Gmax of 6.0 mT/m and Gmean of 0.4 mT/m, and new setting-(B): Gmax of 3.0 mT/m and Gmean of 0.2 mT/m. All other parameters were kept equal to the default settings. Other perfusion imaging parameters were as follows: FOV 220 × 220mm, scan matrix 64×64, 4.5 mm slice thickness, 22 slices, echo time (TE)/repetition time (TR) of 14/3440 ms. A WET pre-saturation scheme was inserted before labeling (3,15), and two non-selective hyperbolic secant inversion pulses were applied during the PLD for background suppression. The number of offset steps from RICA to LICA varied depending on the distance between them: 27 and 24 steps for volunteer 1 and 2, respectively, which resulted in an average scan time of approximately 3 min for each setting of labeling parameters.
To measure the perfusion signal arising from the RICA and LICA separately, masks for the vascular territories were generated from a separate ve-pCASL scan acquired with eight Hadamard-encodings, as previously described (16). Using these masks, the mean signal intensity of each perfusion territory was measured for each offset, and they were normalized to values using non-selective labeling and control images as follows:
Normalised signal = – nonselective control – selective labeling
nonselective control – nonselective labeling
[1]
This suggests that perfect control or inversion will yield a values of 0 or -1, respectively. Finally, the normalized inversion profile curves were plotted as a function of the offset.
(ii) ve-pCASL 4D-MRA
3
gradient. The labelling was performed as follows: 1st cycle: label condition at RICA, 2nd cycle: label condition at LICA, 3rd cycle: label condition at both VAs (see Figure 3b), and 4th cycle: label condition for all arteries (non-selective). The measured signal y can subsequently be written as follows:
[2]
Figure 3: (a) Illustration of the planning of the pCASL labeling plane on the coronal and transverse
angiography surveys. (b) Schematic figure illustrating the planning for the vessel-selective labeling of 1st (RICA-label), 2nd (LICA-label) and 3rd cycle (VAs-label). Red, green and blue colors indicate the 1st, 2nd and 3rd cycle. The dashed lines indicate the center of control condition of each cycle.
where S is static tissue. By applying the pseudo-inverse matrix of equation [2], vessels supplied by each feeding artery are visualized separately. For an optimal encoding function both VAs need to be placed equally well in the label or control conditions across all encoding cycles, allowing them to be treated as a single artery
-1 1 1 -1
RICA LICA VAs S
1 1 -1 -1 1 -1 1 -1