SEARCHING FOR MEANING: NEW METHODS, MEASURES, AND MODELING APPROACHES IN THE SOCIOLOGY OF RELIGION
George M. Hayward
A dissertation submitted to the faculty at the University of North Carolina at Chapel Hill in partial fulfillment of the requirements for the degree of Doctor of Philosophy in the Department
of Sociology in the College of Arts and Sciences.
Chapel Hill 2020
Approved by:
Lisa D. Pearce
Kenneth A. Bollen
Andrew J. Perrin
Jane C. Fruehwirth
ABSTRACT
George M. Hayward: Searching for Meaning: New Methods, Measures, and Modeling Approaches in the Sociology of Religion
(Under the direction of Lisa D. Pearce)
This dissertation uses a combination of new measures and modeling approaches in the
sociology of religion to advance our understanding of three substantive topics. In the first
chapter, I use data from the National Study of Youth and Religion (NSYR) to answer the
question of how a multidimensional model of religiosity fits an adolescent and young adult
sample. Additionally, this chapter considers multiple ways to build longitudinal models of these
dimensions over time, and ultimately uses autoregressive latent trajectory models to show that
each of these dimensions are predicted over time, sometimes in different ways, by their prior
values, individuals’ background characteristics, and life course changes during the transition to
adulthood.
In the second chapter, I explore another dimension of religiosity: religious knowledge.
This relatively understudied topic has long lacked ample measures, though the recent Pew
Religious Knowledge Survey (2010) provides a rich set of religious knowledge questions, thus
allowing for a fresh evaluation of this topic and assessment of these new measures. Accordingly,
this chapter proposes and tests a multidimensional model of religious knowledge and provides
support for a model spanning several religious traditions with twenty-four indicators. As an
external validity check and application to personal religiosity, this chapter shows that knowledge
Finally, the third chapter in this dissertation takes on a broader question: what can
internet search data tell us about the dynamics of the U.S. religious landscape? Using Google
search data from 2004 to 2019, this paper examines the trends in online searches for world
religions, other religions, conventional religious terms, and a host of quasi-religious, spiritual,
and areligious terms. The results show that, while terms related to institutional religion tend to be
declining in popularity, many terms related to minority religious traditions and terms related to
general spirituality are increasing in popularity. Nevertheless, searches for institutional religion
still dominate the overall volume of religious searching. Comparisons with data from the General
Social Survey suggest that internet search data can serve as a reasonable proxy for societal
ACKNOWLEDGEMENTS
This dissertation has tremendously benefitted from the support and guidance of so many
people. In many ways, it really took a village to get to this point. Below, I attempt to adequately,
yet succinctly, capture in words what is surely an indescribable amount of generosity from an
equally indescribable number of sources. Accordingly, please forgive omissions of praise that
words cannot capture, or omissions of people that are simply due to space constraints or my
imperfect memory.
To my dissertation committee, thank you for taking the time to read and critique this
project. While I have not personally served on a dissertation committee (yet), I know it is no
small task to read 175+ pages of academic writing and prepare insightful feedback on it. Your
ideas and encouragement have been invaluable to me, and I will always remember how
supportive you were during this time. Thank you!
To my advisor and mentor, Lisa Pearce: you are a role model and inspiration to me in so
many ways. Thank you for six years of generous support and encouragement. Thank you for all
the little things, and big things, you did for me over the years, including those that may have
gone unnoticed. From answering emails, to reading my papers, to challenging my ideas, to
writing me recommendations, to nominating me for various awards or opportunities, you have
been simply amazing. Your help with the dissertation alone was exceedingly more than I could
have asked for in an advisor. I am truly grateful for all that you have done for me. While “thank
for everything you have done for me. I will carry your impact on my life wherever I go. You are
the kind of advisor I want to be one day.
To Ken Bollen: thank you for all of your methods help and patience with my questions.
You are an inspiration for how to teach methods and a role model for how to mentor. As busy as
you are, you always made time for me, including your thorough responses to methodological
questions via email. This work could not have been done without you.
To Roger Finke: you have been an inspiration to me from my undergraduate days.
Academically, I have learned so much from your work, but I have also learned so much from
your kindness and supportiveness as a colleague and friend. I am so glad that we have stayed in
touch these last six years! It is no exaggeration to say that I am a sociologist today because of
your mentoring and encouragement. I look forward to continuing to work with you in the future.
To the UNC faculty in general: I loved being in our department. While I did not always
interact much with everyone, I loved the professionalism of the department and the aura of
intellectual curiosity that was always present at our colloquium meetings and other gatherings.
Thank you for making our department such a great place for graduate students to develop. In
particular, I would also like to thank S. Philip Morgan for his support and friendship both
academically and personally. Our conversations about football and occasional golf outings
showed me that sociologists do indeed have a fun side!
To my wife, Michelle: it is impossible to summarize the impact of your presence on my
life and this dissertation. From the hundreds of dinner conversations in which you provided a
listening ear for my ideas, to your unwavering belief in me – even when I started doubting
into the late night or in the early morning. Thank you, so much, for being there for me and
supporting me every step of the way.
To my future son: at the time of this writing, you are due to be born in one month! While
technically some parts of this dissertation may have been more stressful because of your
impending arrival, I was so incredibly motivated to finish because of you. Thank you for also
reminding me that there is more to life than a dissertation. I cannot wait to meet you!
To my family, including but not limited to my mom (Irene), dad (Justin), sister
(Guinevere), and brother (Alfred): thank you for your continued patience and belief in me. I
know that the move to Chapel Hill put some geographical distance between us, and I know that
was really hard at times. But I am so glad that we found other ways to support each other and
build our relationships from a distance. Thank you for your patience and understanding. I was
motivated to finish this work by the prospect that we could be closer together again. I love you
all so much!
To the many UNC graduate students, who at one point or another either provided specific
feedback or advice, or just emotional support and comfort. In no particular order, these include
all students in Lisa Pearce’s religion workshop(s) over the years, Sam Fishman, Max Reason,
Anna Rybinska, David Braudt (thanks for the methods help, in particular), Jessica Pearlman (also
methods help), Michael Schultz, Sarah Davis, Caiping Wei, Laura Krull, and Claire Chipman. I
look forward to continuing our friendships into the future!
To the Carolina Population Center: thank you for providing me office space, a computer,
access to terminal servers and software support, funding, and a professional community over
these past six years. I have greatly enjoyed being a part of the CPC and will never forget the
Finally, to my good friends in Chapel Hill, many of whom are from our church
community and small group: without social support outside of work, I would not have had the
mental energy nor fortitude to complete this dissertation. These include AJ Farthing, Griff
Crews, the “Shermen” (Matthew and Ash), Brian Reilly (whose computer help kept my 2010
Macbook Pro alive until convincing me to upgrade), Mike Giarla, Ellen Michelson, and Sam
George (who helped especially with the Google Trends API in the third chapter of this
dissertation).
Despite this overwhelming support, any errors remain my own. I hope to make everyone
TABLE OF CONTENTS
LIST OF FIGURES ... xii
LIST OF TABLES ... xiii
INTRODUCTION ... 1
CHAPTER ONE: A MULTIDIMENSIONAL MODEL OF RELIGIOSITY FROM ADOLESCENCE THROUGH THE TRANSITION TO ADULTHOOD ... 9
THEORETICAL BACKGROUND ... 11
Religiosity During Adolescence ... 11
Five Dimensions of Religiosity During Adolescence ... 12
Extending the Multidimensional Model of Religiosity to the Transition to Adulthood ... 13
Changes in Religious Dimensions Over Time from Adolescence to Adulthood ... 17
DATA AND METHODS ... 19
Measurement Model Indicator Variables ... 20
Analytic Strategy ... 22
RESULTS ... 29
Model Confirmation at Waves 3 and 4 ... 29
Autoregressive Latent Trajectory Models ... 31
DISCUSSION ... 36
Limitations and Conclusions... 39
CHAPTER TWO: MEASURING RELIGIOUS KNOWLEDGE: A MULTIDIMENSIONAL
MODEL AND APPLICATION TO PERSONAL RELIGIOSITY... 62
THEORETICAL BACKGROUND ... 64
Religious Knowledge as a Social Good and Personal Resource ... 64
Religious Knowledge and Personal Religiosity ... 68
DATA AND METHODS ... 72
Analytic Strategy ... 73
Alternative Models ... 75
RESULTS ... 80
DISCUSSION ... 86
Multidimensional Model ... 87
Personal Religiosity ... 89
Limitations and Conclusions... 93
REFERENCES ... 96
CHAPTER THREE: SEARCHING FOR RELIGION AND SPIRITUALITY (LITERALLY): U.S. TRENDS IN RELIGIOUS AND SPIRITUAL SEARCH TERMS, 2004-2019 ... 113
THEORETICAL BACKGROUND ... 114
The Religious Landscape of the United States ... 114
Religion Online and Online Religion: The Virtual Religious Landscape... 118
The Sociological Significance of Religion Online ... 119
DATA AND METHODS ... 127
Religious and Spiritual Search Terms ... 129
Trends in Religious Searching ... 132
Relative Popularities Over Time ... 134
Comparisons with Other Data on the Religious Landscape ... 136
DISCUSSION ... 138
Limitations and Conclusions... 143
REFERENCES ... 146
CONCLUSION ... 158
REFERENCES ... 166
LIST OF FIGURES
Figure 1.1 – Proposed Measurement Model of Religiosity at a Given Point in
Time (Wave)...47
Figure 1.2 – Proposed Longitudinal Model of Religiosity...48
Figure 1.3 – Three Alternative, Unconditional Longitudinal Models for Latent
Dimensions of Religiosity over Time (Waves 1-4) ...49
Figure 1.4 – Conditional ALT Model Predicting Latent Dimension(s) of Religiosity
over Time (Waves 1-4) ...50
Figure 2.1 – Implied Model of Religious Knowledge...102
Figure 2.2 – Starting Specifications and Alternative Specifications for Various
Knowledge Dimensions...103
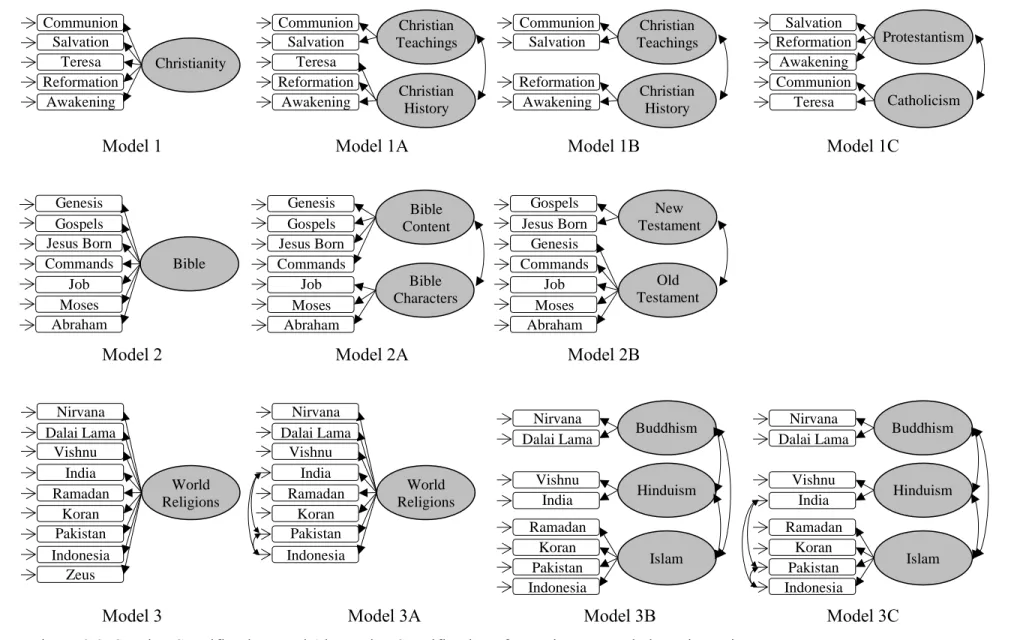
Figure 2.3 – Alternative Models of Religious Knowledge...104
Figure 2.4 – Visual Diagram of Christian-only Model, Truncated...105
Figure 2.5 – Correlations between Religious Practice, Religious Salience, and Eight
Dimensions of Religious Knowledge...106
Figure 3.1 – Relative Search Popularities by Category of Search Terms, 2004-2019...151
Figure 3.2 – Google Search Popularities of Select Terms Compared to Religious
Beliefs and Identifications on the General Social Survey...152
Figure 3.3 – Google Search Popularities of Select Terms Compared to Religious
Behaviors and Affiliations on the General Social Survey...153
Figure 3.4 – Google Search Popularities of Terms Related to Minority Religious Traditions and Percentage of Adherents of those Traditions Based on the
LIST OF TABLES
Table 1.1 – Latent Variables, Indicators, and Associated Questions...51
Table 1.2 – Descriptive Statistics of Indicator Variables...53
Table 1.3 – Descriptive Statistics of Covariates in Longitudinal Models...54
Table 1.4 – Global Fit Statistics of Five Latent Variable Model...55
Table 1.5 – Chi-square Tests Comparing Longitudinal Model with Models Combining Latent Variables...56
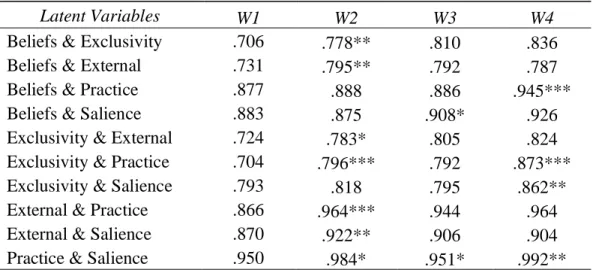
Table 1.6 – Correlations between Latent Variables by Wave, Longitudinal Model...57
Table 1.7 – Component Measures of Fit, by Wave, From Longitudinal Model...58
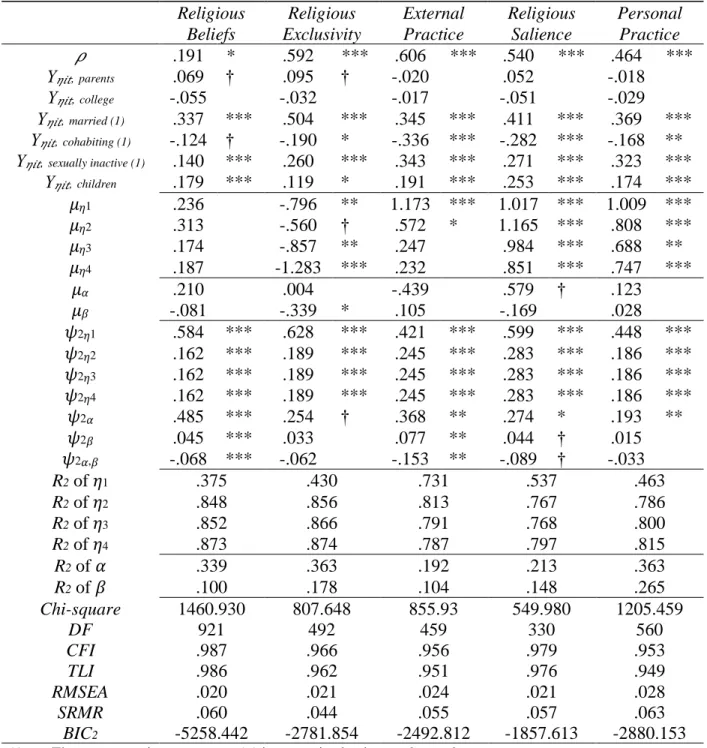
Table 1.8 – Parameter Estimates from Conditional ALT Models Predicting Change Over Time in Religion Latent Varibles...59
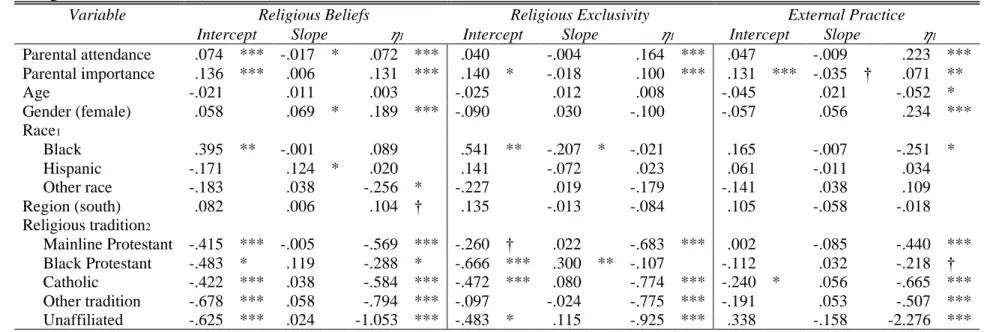
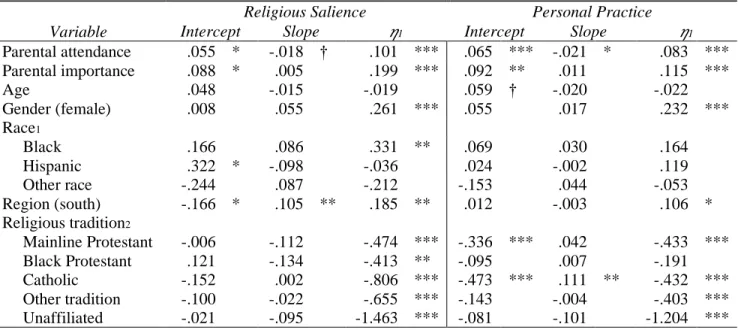
Table 1.9 – Parameter Estimates from Conditional ALT Models Predicting Growth Factor Intercepts, Slopes, and Predetermined Religion Latent Variables...60
Table 2.1 – Latent Variable, Indicators, and Associated Questions...107
Table 2.2 – Descriptive Statistics of Indicator Variables...109
Table 2.3 – Model Comparisons...110
Table 2.4 – Model Comparisons, Full Models ...111
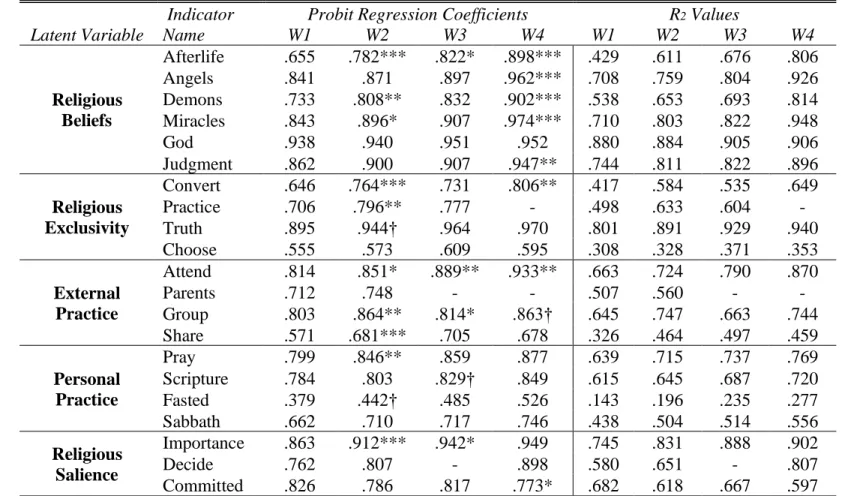
Table 2.5 – Standardized Probit Regression Coefficients and R2 Values for Each Indicator Variable, Final Model...112
Table 3.1 – Search Terms Used in Analysis of Major World Religions...155
Table 3.2 – Search Terms of Religion and Spirituality Outside of Dominant World Religions...156
INTRODUCTION
Religion and religiosity are notoriously difficult to measure, but there have been
significant strides in the past hundred years or so. In that time frame, local community surveys of
religion have given way to polls and academic surveys (Wuthnow 2015), many of which are
international, nationally representative, longitudinal, and replete with questions about religion.
The Association of Religion Data Archives (theARDA.com), founded in 1997, now houses many
of these data collections and provides researchers free access to them.
This proliferation of data and their availability over time has spawned many creative
methods to measure religion. For example, hundreds of scales and indices of religiosity have
been created (Hill and Hood Jr. 1999; Hill and Pargament 2017). Multidimensional models have
developed since around the middle of the twentieth century (Fukuyama 1961; Glock 1962; Wach
1944) and continue to be improved upon today with new data and analytical techniques (Chao
and Yang 2018; Pearce, Hayward, and Pearlman 2017). More recently, attention has been given
to indirect and implicit measures of religiosity (Jong, Zahl, and Sharp 2017) and person-centered
approaches (adams, Schaefer, and Ettekal 2020; Pearce, Foster, and Hardie 2013). Many religion
researchers are also taking advantage of the digital data available online today
(Cheruvallil-Contractor and Shakkour 2016; Salganik 2017), which often provide unobtrusive measures of
religiosity, such as data from search queries (Jansen, Tapia, and Spink 2010; Wan‐Chik, Clough,
and Sanderson 2013), Google NGrams (Finke and McClure 2017), and Amazon purchase
Despite all of this recent and continuing progress, there is still much room for
improvement in the measures and methods used to study religion (Finke and Bader 2017; Martí
2014). As a recent example that illustrates the timeliness of this topic, the December 2018 issue
of the Journal for the Scientific Study of Religion had a forum pertaining to measuring religious
identification (or affiliation) that included nine different papers. In fact, some of the
methodological progress on studying religion is so recent (e.g., big data analysis on unobtrusive
measures) that additional research is needed to push these developments past their infancy. In
other words, the time is rife with opportunity for new data, methods, and ideas in the sociology
of religion that can push the field forward. In response to this opportunity, this dissertation will
use three different data sources and several innovative methods to contribute to sociological
approaches of measuring and modeling religiosity. This will be accomplished through the
production of three papers, outlined individually below.
The first paper will use confirmatory factor analyses within a structural equation
modeling framework (Bollen 1989) to estimate a measurement model of religiosity from
adolescence through the transition to adulthood. This is an expansion and continuation of recent
work in this area (Pearce et al. 2017) and will use four waves of data from the National Study of
Youth and Religion. While many multidimensional models of religiosity have been proposed
over the years across a range of samples, most are cross-sectional and use small or
non-representative samples (Cornwall et al. 1986; King and Hunt 1969, 1972; Levin, Taylor, and
Chatters 1995). This prohibits the detection of changes over time and at critical junctures in the
life course (e.g., finishing college, getting married, and having a child). Thus, the first paper will
extend a theoretically-motivated measurement model of religiosity from adolescence into early
life course. It will also go beyond this measurement portion and explicitly model change in each
of the distinct dimensions over time. To accomplish this task, autoregressive latent trajectory
models will be used (Bianconcini and Bollen 2018; Bollen and Curran 2004), which account for
the effects of each dimension’s prior values on itself, in addition to a latent growth process that
may be simultaneously governing the change. Other contextual variables, such as family
background and sociodemographic characteristics, as well as time-varying life course changes,
will be incorporated in the predictions of each dimension over time. Thus, the results will show
how an array of different dimensions change and respond to life course transitions over a crucial
developmental period.
The second paper will address another shortcoming of sociological research on religion:
very little attention is given to religious knowledge. At the macro level, religious knowledge is
becoming increasingly important as religious pluralism grows and diverse religious groups come
into contact with each other. This has prompted several scholars to call for improved religious
literacy in the population (Moore 2010; Prothero 2007; Prothero and Kerby 2015) for its
potential to create a robust tolerance for religious differences. At the micro level, studies of
individual religiosity almost never measure religious knowledge. In other words, researchers
either suppose people are knowledgeable about their religion or that religious knowledge is
irrelevant (or inconsequential) for understanding personal religiosity. Unfortunately, there is little
research on religious knowledge and only a few attempts to measure it, which hinders research
on both of these fronts.
This paper will capitalize upon rich and unique survey data from the Pew Religious
Knowledge Survey (2010) to theorize about the structure of religious knowledge and to evaluate
religious traditions. This will be accomplished using confirmatory factor analyses within a
structural equation modeling framework (Bollen 1989). As an application to personal religiosity,
and as an external validity check, this paper will also evaluate the strength of the correlations
between dimensions of religious knowledge and other dimensions of religiosity on a Christian
sample. Overall, these analyses will lay the groundwork for future researchers to incorporate
religious knowledge components into survey collections, interviews, or other data analyses, and
will suggest theoretical avenues for which research on religious knowledge may continue.
Finally, the third paper will take a broader approach to measuring religiosity and will
analyze data from Google searches at the national level using Google Trends. Specifically, these
analyses will use time series models to estimate trends for a wide array of search terms related to
institutionalized world religions, other religions, general forms of spirituality or spiritual
practice, and nonreligion. Analyses will cover the time period from 2004 to 2019, and will thus
provide a longitudinal picture of changing population-level interests over nearly two decades.
Because Google Trends aggregates individual-level searches, other scholars have argued, and
provided evidence for, the claim that these data can serve as reasonable proxies for broader
societal characteristics, such as religiosity (Scheitle 2011). Indeed, Google Trends has recently
been used to study a range of similar phenomena, such as population-level interest in science
(Baram-Tsabari and Segev 2011) and the environment (Mccallum and Bury 2013). Accordingly,
this paper will further our understanding of the religious and spiritual trends taking place in the
U.S., capitalizing on an unobtrusive approach that offers unique advantages over survey and poll
research, which has dominated the study of religious trends over time (Gorski and Altinordu
2008; Wuthnow 2015). For additional external validation, however, these analyses will also
Social Survey. By providing a macro-level analysis of U.S. interest in religious and spiritual
search terms, this research will contribute to our understanding of macro-level changes in
REFERENCES
adams, jimi, David R. Schaefer, and Andrea V. Ettekal. 2020. “Crafting Mosaics: Person-Centered Religious Influence and Selection in Adolescent Friendships.” Journal for the Scientific Study of Religion.
Baram-Tsabari, Ayelet, and Elad Segev. 2011. “Exploring New Web-Based Tools to Identify Public Interest in Science.” Public Understanding of Science 20(1):130–43.
Bianconcini, Silvia, and Kenneth A. Bollen. 2018. “The Latent Variable-Autoregressive Latent Trajectory Model: A General Framework for Longitudinal Data Analysis.” Structural Equation Modeling: A Multidisciplinary Journal 25(5):791–808.
Bollen, Kenneth A. 1989. Structural Equations with Latent Variables. New York: John Wiley & Sons.
Bollen, Kenneth A., and Patrick J. Curran. 2004. “Autoregressive Latent Trajectory (ALT) Models: A Synthesis of Two Traditions.” Sociological Methods & Research 32(3):336– 83.
Chao, L. Luke, and Fenggang Yang. 2018. “Measuring Religiosity in a Religiously Diverse Society: The China Case.” Social Science Research 74:187–95.
Cheruvallil-Contractor, Sariya, and Suha Shakkour, eds. 2016. Digital Methodologies in the Sociology of Religion. New York: Bloomsbury Academic.
Cornwall, Marie, Stan L. Albrecht, Perry H. Cunningham, and Brian L. Pitcher. 1986. “The Dimensions of Religiosity: A Conceptual Model with an Empirical Test.” Review of Religious Research 27(3):226–44.
Finke, Roger, and Christopher D. Bader, eds. 2017. Faithful Measures: New Methods in the Measurement of Religion. New York: New York University Press.
Finke, Roger, and Jennifer M. McClure. 2017. “Reviewing Millions of Books: Charting Cultural Religious Trends with Google’s Ngram Viewer.” Pp. 287–316 in Faithful Measures: New Methods in the Measurement of Religion, edited by R. Finke and C. D. Bader. New York: New York University Press.
Fukuyama, Yoshio. 1961. “The Major Dimensions of Church Membership.” Review of Religious Research 2(4):154–61.
Glock, Charles Y. 1962. “On the Study of Religious Commitment.” Religious Education 57(4):98–110.
Hill, Peter C., and Ralph W. Hood Jr., eds. 1999. Measures of Religiosity. Birmingham, AL: Religious Education Press.
Hill, Peter C., and Kenneth I. Pargament. 2017. “Measurement Tools and Issues in the
Psychology of Religion and Spirituality.” Pp. 48–77 in Faithful Measures: New Methods in the Measurement of Religion, edited by R. Finke and C. D. Bader. New York: New York University Press.
Jansen, Bernard J., Andrea Tapia, and Amanda Spink. 2010. “Searching for Salvation: An Analysis of US Religious Searching on the World Wide Web.” Religion 40(1):39–52.
Jong, Jonathan, Bonnie P. Zahl, and Carissa A. Sharp. 2017. “Indirect and Implicit Measures of Religiosity.” Pp. 78–107 in Faithful Measures: New Methods in the Measurement of Religion, edited by R. Finke and C. D. Bader. New York: New York University Press.
King, Morton B., and Richard A. Hunt. 1969. “Measuring the Religious Variable: Amended Findings.” Journal for the Scientific Study of Religion 8(2):321–23.
King, Morton B., and Richard A. Hunt. 1972. “Measuring the Religious Variable: Replication.” Journal for the Scientific Study of Religion 11(3):240–51.
Levin, Jeffrey S., Robert J. Taylor, and Linda M. Chatters. 1995. “A Multidimensional Measure of Religious Involvement for African Americans.” The Sociological Quarterly
36(1):157–73.
Martí, Gerardo. 2014. “Present and Future Scholarship in the Sociology of Religion.” Sociology of Religion 75(4):503–10.
Mccallum, Malcolm L., and Gwendolyn W. Bury. 2013. “Google Search Patterns Suggest Declining Interest in the Environment.” Biodiversity and Conservation 22(6–7):1355–67.
Moore, Diane L. 2010. American Academy of Religion Guidelines for Teaching About Religion in K-12 Public Schools in the United States. American Academy of Religion.
Pearce, Lisa D., E. Michael Foster, and Jessica H. Hardie. 2013. “A Person-Centered
Examination of Adolescent Religiosity Using Latent Class Analysis.” Journal for the Scientific Study of Religion 52(1):57–79.
Pearce, Lisa D., George M. Hayward, and Jessica A. Pearlman. 2017. “Measuring Five Dimensions of Religiosity Across Adolescence.” Review of Religious Research 59(3):367–93.
Pew Research Center. 2010. U.S. Religious Knowledge Survey. Washington, D.C.
Porter, Nathaniel D., and Christopher D. Bader. 2017. “Pathways to Discovery and
Methods in the Measurement of Religion, edited by R. Finke and C. D. Bader. New York: New York University Press.
Prothero, Stephen. 2007. Religious Literacy: What Every American Needs to Know-And Doesn’t. First. New York: HarperCollins.
Prothero, Stephen, and Lauren R. Kerby. 2015. “The Irony of Religious Illiteracy in the USA.” Pp. 55–75 in Religious Literacy in Policy and Practice, edited by A. Dinham and M. Francis. Chicago, IL: Policy Press.
Salganik, Matthew J. 2017. Bit by Bit: Social Research in the Digital Age. Princeton, NJ: Princeton University Press.
Scheitle, Christopher P. 2011. “Google’s Insights for Search: A Note Evaluating the Use of Search Engine Data in Social Research.” Social Science Quarterly 92(1):285–95.
Wach, Joachim. 1944. Sociology of Religion. Chicago: University of Chicago Press.
Wan‐Chik, Rita, Paul Clough, and Mark Sanderson. 2013. “Investigating Religious Information Searching Through Analysis of a Search Engine Log.” Journal of the American Society for Information Science and Technology 64(12):2492–2506.
CHAPTER ONE: A MULTIDIMENSIONAL MODEL OF RELIGIOSITY FROM ADOLESCENCE THROUGH THE TRANSITION TO ADULTHOOD
Religion plays an important role in individuals’ lives throughout the life course. While
relatively little work has been done on religion during childhood (Cooey 2010), much more work
has been done on religion during adolescence (Pearce and Denton 2011; Smith and Denton
2005), the transition to adulthood (Arnett and Jensen 2002; Barry et al. 2010; Chan, Tsai, and
Fuligni 2015; Smith and Snell 2009), adulthood (Hayward and Krause 2015; McCullough et al.
2005; Schwadel 2011), and late life (Hayward and Krause 2014; Krause 2016). One overarching
theme from this research is that religion remains pervasive and influential in the lives of
individuals, in a number of different ways, at each of these distinct time points. Another
overarching theme is the heterogeneity of trajectories that religious development can follow,
ranging everywhere from stability to recurrent change (Ingersoll-Dayton, Krause, and Morgan
2002).
In addition to these major life course themes, another dominant thread of research on
religion – even across scholarly fields – is that it is best conceptualized as a multidimensional
construct (Hill and Pargament 2017; Idler et al. 2003; Pearce, Hayward, and Pearlman 2017;
Saroglou 2011). Scholars have long recognized that people can be religious in myriad ways, and
these various aspects of religiosity have often been organized into multidimensional models – a
literature that spans over fifty years (see (Fukuyama 1961; Glock 1962; King 1967) for some of
psychology and health (Chao and Yang 2018; Fetzer Institute 1999; Joseph and DiDuca 2007;
Kendler et al. 2003; Pearce et al. 2017; Saroglou 2011).
Despite the progress that has been made in both life course studies of religion and the
multidimensionality of religion, there is little work at the nexus between them. This shortcoming
has two facets. First, we do not know much about how, if at all, the multidimensionality of
religiosity varies by stage in the life course. Unfortunately, most multidimensional models of
religiosity do not adequately incorporate life course considerations into their designs. For
example, this is the case when the dimensionality of religion is presented as stagnant rather than
as subject to change in response to aging, developmental periods, or important life events. This is
also the case when proposed models of religiosity are only validated on cross-sectional data and
not cross-validated on populations experiencing different phases of life or undergoing different
life course transitions. Thus, the first aim of this paper is to analyze a multidimensional model of
religiosity at multiple time points that span a critical developmental period – that between
adolescence and young adulthood.
The second facet of the research gap at the nexus of life course theory and the
dimensionality of religion pertains to change over time. While studies on the trajectories of
religious change over time are increasing, the emphasis in most of this research is on patterns of
change among singular measures of religiosity (e.g., religious service attendance). These are
useful in a number of ways, but these single indicators may also be reflective of latent
dimensions of religiosity that are driving their change, and are substantively more meaningful,
but are not examined in their own right. Further, different dimensions of religiosity may differ in
their responsiveness to changes in life stage or significant life events, and thus they warrant
change in multiple dimensions of religiosity over time, examining how and why different
dimensions are affected by life course stages and transitions.
To accomplish both aims of this paper, this work will build upon a recently validated,
five-dimensional model of religiosity during adolescence that was based on data from the first
two waves of the National Study of Youth and Religion (Pearce et al. 2017). For the first aim,
this five-dimensional model will be replicated, using confirmatory factor analysis, on the young
adult sample from the National Study of Youth and Religion (Waves 3 and 4). It will also be
replicated on the full sample (Waves 1-4), which spans approximately 10 years of available data
through four repeated surveys, as individuals age from adolescence into young adulthood. For
the second aim, each of these five dimensions will be modeled, individually, across all four
waves of data using autoregressive latent trajectory models (Bianconcini and Bollen 2018).
These models combine the best components of both autoregressive and growth curve modeling,
while also being flexible enough to account for a range of covariates that are relevant to both
religious development and life course transitions over time.
THEORETICAL BACKGROUND
Religiosity During Adolescence
The most comprehensive works on religiosity during adolescence support the contention
that adolescents are religious in many ways and that it affects their lives in many ways (Pearce
and Denton 2011; Pearce, Uecker, and Denton 2019; Smith and Denton 2005). For example,
adolescents have high levels religious affiliation, belief in God, religious importance, and a host
of faith-related practices like prayer and scripture reading. As a way to summarize different
patterns of religiosity during the teenage years, scholars have developed various typologies of
Denton 2005). Building upon these works, which recognize patterns of religious beliefs and
behaviors, in addition to the multidimensionality of religion, Pearce et al. (2017) use a latent
variable approach to identify five unique dimensions of religiosity during adolescence. The
authors also test alternative models that combine some of these dimensions, but none were
superior to the five-dimensional model, suggesting that these five dimensions are distinct yet
interrelated across two time points during adolescence. It is this model that serves as the
foundation for the rest of the analyses here.
Five Dimensions of Religiosity During Adolescence
Below, each of the five proposed dimensions from Pearce et al. (2017) will be more fully
defined, as I specifically delineate each dimension and what it encompasses. For a review of the
motivation behind each dimension and the prior research that informed them, readers are directed
to the original article. Following these definitions, explanations of how and why they might
change from adolescence to the transition to adulthood are discussed.
(1) Religious Beliefs: convictions or opinions that accept the existence of supernatural or
metaphysical beings, forces, or meaning systems.
(2) Religious Exclusivity: acceptance of moral absolutes, definite right and wrongs, and
the infallible authority of a meaning system or God(s).
(3) External Practice: performance of religious functions in the presence of other
individuals with similar beliefs performing similar functions.
(4) Personal Practice: performance of religious functions in solitude or without overt
participation from others.
(5) Religious Salience: the importance of religion to one’s life, both in absolute terms and
In the original study, these dimensions were distinct yet interrelated to one another,
typically with high correlations, and most of these correlations improved significantly over time.
Likewise, the dimensions explained a high amount of the variation in each of the observed
indicators at both waves, indicating that they are reliable measures (Bollen 1989), with most of
these relationships becoming stronger over time. These improvements in the model components
over time during adolescence support the idea that religious faith becomes more consistent and
internalized as individuals gain autonomy to develop their own identities, as opposed to
following the expectations of their parents or other influential adults (Pearce and Denton 2011).
Relatedly, the authors argue that Religious Salience is the most central dimension for adolescent
religiosity, since it is the most highly correlated with each of the other dimensions.
Extending the Multidimensional Model of Religiosity to the Transition to Adulthood
Will this five-dimensional model accurately describe the religiosity of individuals
transitioning to adulthood, though? Or, will it have to be modified to accommodate religious
change during this period? To contextualize why this model could change during the transition to
adulthood, the following discussion considers a range of biological and life course factors.
To begin, the transition to adulthood overlaps with a period of significant brain
development and advances in moral and religious reasoning. Day (2017:316) states:
“There is thus strong empirical evidence, from studies with hundreds of participants, across a variety of religious groups, and denominations within religious traditions, that there are stages in moral and religious cognition and thinking about spiritual sayings that qualify as postformal stages, and that these are specific, with the exception of a very small number of adolescents, to psychological development and learning in adulthood” (emphasis added).
In other words, the kinds of religious and moral considerations that begin at the onset of
though, the pairing of this ability with the cultural norm of identity exploration during this time
period (Arnett 2004) could lead to an amalgam of beliefs and practices that do not necessarily
cohere but are still meaningful to the one exercising them. In fact, Chaves (2010) makes the
argument that people generally do not have neatly cohering belief systems that are adaptable
across contexts. During the transition to adulthood, this could especially be the case, since life
tends to be characterized by identity explorations and is less predictable than the times before or
after it (Arnett 2000, 2004). Because individuals’ peers are also experiencing this period of rapid
change simultaneously, young adults have a tendency to “honor diversity” and shy from
judgment (Smith and Snell 2009); this could lead to increasingly relativistic, and perhaps even
unorthodox, religious views in themselves (Arnett and Jensen 2002). In a multidimensional,
longitudinal framework, evidence for this effect would be weakening correlations during this
time period between dimensions such as Religious Beliefs and Religious Exclusivism with other
dimensions of religiosity.
As a counterpoint, however, the cognitive advancements during the transition to
adulthood that facilitate moral reasoning could lead to more internal consistency when it comes
to religious beliefs. Additionally, the increasing autonomy one develops during this period could
facilitate individuals bringing their religious beliefs, practices, salience, and so on, into
agreement, since they are better able to enact their preferences than they were during
adolescence. In a multidimensional, longitudinal framework, evidence for this effect would be
strengthening correlations during this time period between dimensions such as Religious Beliefs
and Religious Exclusivism with other dimensions of religiosity.
Beyond biological changes associated with aging, the transition to adulthood is also filled
life course (Rindfuss 1991). Relatedly, Arnett (2000, 2004) has argued that the period between
ages 18 and 29 is marked by identity explorations, instability, self-focus, “feeling in-between,”
possibilities, and optimism.1 It is during this time period that many individuals leave home for
the first time, enroll in a college program, have short-term relationships, develop an identity for
themselves, pick-up part-time jobs, switch residences, and seek out new experiences that come
with the relative freedom they are experiencing. In regard to how this unique period of the life
course affects religious belief and practice, Smith and Snell (2009:75–87) note a number of
factors that may have a negative effect on religiosity: disruptions, distractions, differentiation,
postponed family formation and childbearing, keeping options open, honoring diversity,
self-confident self-sufficiency, self-evident morality, partying, hooking up, having sex, and
cohabiting. Many of these are related to the identity explorations and freedom associated with
this time period (Arnett 2000, 2004). Indeed, this is often a period marked by low religiosity
overall, though not necessarily lower now than in decades past (Smith and Snell 2009).2
Two particular transitions that often happen by this time period, or during this time
period, are the transition to sexual intercourse and the start of cohabiting relationships. Just over
half of 18-year-olds report having had sexual intercourse, but this increases to about 75 percent
by age 20 (Abma and Martinez 2017). Younger cohorts are increasingly likely to have premarital
sex compared to older ones (Wu, Martin, and England 2017), and by age 29, more than half of
women have cohabited with a romantic partner outside of marriage (Kennedy and Bumpass
1 It is important to note here that Arnett’s arguments are based on his developmental theory of “emerging adulthood,” which is often criticized for being only, or mostly, applicable to socially privileged individuals, particularly those who are enrolled in college, at least middle-class, and white. For recent overviews of these critiques, see Cote (2014) and Syed (2016). For an example of “expedited” adulthood – a shortened path to adulthood – by less privileged youth, see Deluca, Clampet-Lundquist, and Edin (2016).
2008). These are notable transitions because, not only are they increasingly common during the
transition to adulthood, but both premarital sex and cohabitation are predictive of subsequent
declines in religiosity (Thornton, Axinn, and Hill 1992; Uecker, Regnerus, and Vaaler 2007;
Vasilenko and Lefkowitz 2014).
The latter half of the transition to adulthood – the late 20s – on average, are more likely
to contain major family transitions than the early 20s. The estimated mean age at marriage in the
United States is now at an all-time high for both males (29.5 years) and females (27.4 years)
(U.S. Census Bureau 2017). The birth rate for women ages 25-29 is about 35% higher than for
20-24 year-olds, and the average age at first birth is 26.4 years (Martin et al. 2017). During this
time period, most people finish their educational pursuits and enter a period of relative stability
compared to the years just prior (Arnett 2004).
Compared to the period of markedly low religiosity during the earlier part of the
transition to adulthood, the latter half of the transition tends to be associated with slightly higher
religiosity overall (Ryberg, Harris, and Pearce 2018), perhaps due to the family-related changes
taking place. For example, getting married and having a child have been associated on numerous
occasions with bringing people back to institutional religion or increasing religiosity for those
already religious (Roof 1999; Schleifer 2015; Schleifer and Chaves 2017; Stolzenberg,
Blair-Loy, and Waite 1995; Thornton et al. 1992; Uecker, Mayrl, and Stroope 2016; Wuthnow 2007).
In light of this discussion, there are competing expectations for if, and how, the
five-dimensional model may change compared to adolescence. On the one hand, it could be expected
that the model will not describe young adult religiosity as well as it does adolescent religiosity,
particularly for the early part of the transition to adulthood. This would be indicated by poorer
between them, do not reflect the data as accurately as they did during adolescence. Given the
association of this time period with various personal, social, and geographical transitions, it
could be expected that the relationships between different dimensions will, in general and on
average, weaken or fail to improve from adolescence. This could result from the tendency of this
age group to experiment with new religious practices and beliefs and to have irregular, transient
commitments. This would be indicated by weaker correlations between the dimensions of
religiosity during young adulthood, which would suggest religious profiles are not as consistent
across dimensions as they were previously. Nevertheless, it could also be expected that the
five-dimensional model of religiosity will improve during the transition to adulthood. After all, some
of the transience and instability of the initial period of the transition (e.g., during ages 18-22),
will eventually subside and family transitions that bring people back to institutionalized religion
become more common with age. Individuals also gain more autonomy during this time period to
enact their preferences, and thus may have improved alignment between dimensions of their
religiosity. These kinds of effects would be reflected by improved overall model fit, suggesting
that they hypothesized model better explains the observed data for young adults, and increased
correlations between the religiosity dimensions, suggesting that religious profiles become more
internally consistent across dimensions.
Changes in Religious Dimensions Over Time from Adolescence to Adulthood
In addition to evaluating the multidimensional model during the transition to adulthood,
this study will also estimate changes within specific dimensions over time based on some of the
life course factors just discussed. Several studies present similar analyses but important gaps
remain. For example, Petts (2009) uses growth curve modeling to estimate trajectories of
this analysis, though, is attention to the other dimensions of religiosity. While religious
attendance is one of the most popular measures of religious practice, it is only one indicator and
may not reflect religious practices more broadly. Further, the respondents in Petts (2009) only go
up to age 25, though the transition to adulthood generally extends beyond that. In a similar
analysis, Desmond, Morgan, and Kikuchi (2010) use growth curve modeling to predict religious
attendance and importance of religious faith during the transition from adolescence to young
adulthood, but again the primary limitation is the lack of outcomes reflecting the
multidimensionality of religion.
Lee, Pearce, and Schorpp (2018) use latent class analysis to identify pathways of
religious change from adolescence to adulthood (up to age 32) using combinations of four
religious indicator variables: religious affiliation, religious attendance, religious salience, and
frequency of prayer. However, these variables are not assessed individually, but only as part of
distinct pathways. Further, two life course variables of particular interest, getting married and
having a child, are only included as measures at the final wave of analysis; thus, their effects on
the prior time points cannot be determined. Finally, Smith and Snell (2009) devote a chapter to
modeling religious trajectories beginning in adolescence, but their data only go up to about age
23 and their trajectories are based on an index combining religious attendance, importance of
faith, and frequency of prayer. Thus, the trajectories of distinct religious dimensions are missing,
as well as data from the latter part of the transition to adulthood. Other longitudinal studies of
religious development from adolescence through the transition to adulthood have similar
shortcomings as those discussed above so are not described individually here (Aalsma et al.
2013; Chan et al. 2015; Denton and Uecker 2018; Hall, Edwards, and Wang 2016; Vasilenko and
In sum, the current studies that have modeled religious trajectories through the transition
to adulthood have not contained a broad scope of religious indicators, have not incorporated
time-varying life course transitions, have not had enough data to go from adolescence through
the entire transition to adulthood period, or have not been able to account for prior (lagged)
values of religiosity in predicting change. This analysis seeks to advance research in this area,
respectively, by 1) modeling five distinct dimensions of religiosity with numerous indicators
each, 2) incorporating time-varying life course transitions into each model, 3) using data that
cover the span of ages from 13-28, and 4) explicitly modeling autoregressive effects of religion
alongside those of other covariates. As a result, these analyses will have significant advantages
over prior studies and will greatly contribute to our understanding of religious development from
adolescence through the transition to adulthood.
DATA AND METHODS
Data from four waves of the National Study of Youth and Religion (NSYR) are used for
analyses. The NSYR is a nationally-representative, longitudinal survey of 3,290 youth and one of
their parents. It also includes an oversample of 80 Jewish respondents and their parents, bringing
the total sample to 3,370 initial participants. Data collection for Wave 1 began in 2002 using a
random digit dial (RDD) method to contact participants. Adolescent respondents were between
13-17 years old at Wave 1 and 23 to 28 years old by Wave 4. The second, third, and fourth
waves of data collection were conducted in 2005, 2007, and 2012, respectively. Comparisons of
the NYSR with Census data and other national surveys of youth, such as the National
Longitudinal Study of Adolescent to Adult Health and Monitoring the Future, confirm its
representativeness at Wave 1 without bias from sampling or nonresponse. For more information
For these analyses, data from all four waves of the NYSR are used. Due to loss from
attrition, the full sample at Waves 2, 3, and 4 contains 2,604, 2,432, and 2,144 respondents,
respectively. However, the missingness within wave on the variables of interest here was very
low – less than 6 percent at any given wave. For the measurement models, the subsequent
analyses are limited to respondents with full data across all four waves (N = 1,539).3 For the
longitudinal models in the second part of the analysis, the incorporation of baseline and
time-varying covariates across waves further reduces the sample to 1,474 respondents with full data.
Measurement Model Indicator Variables
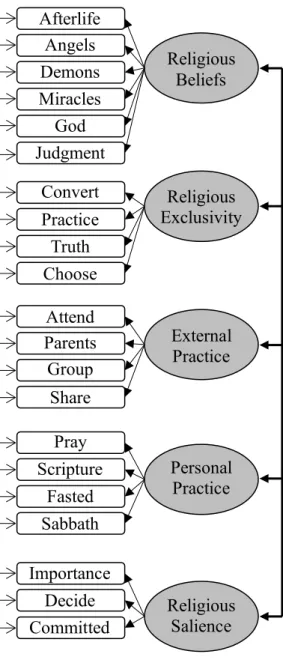
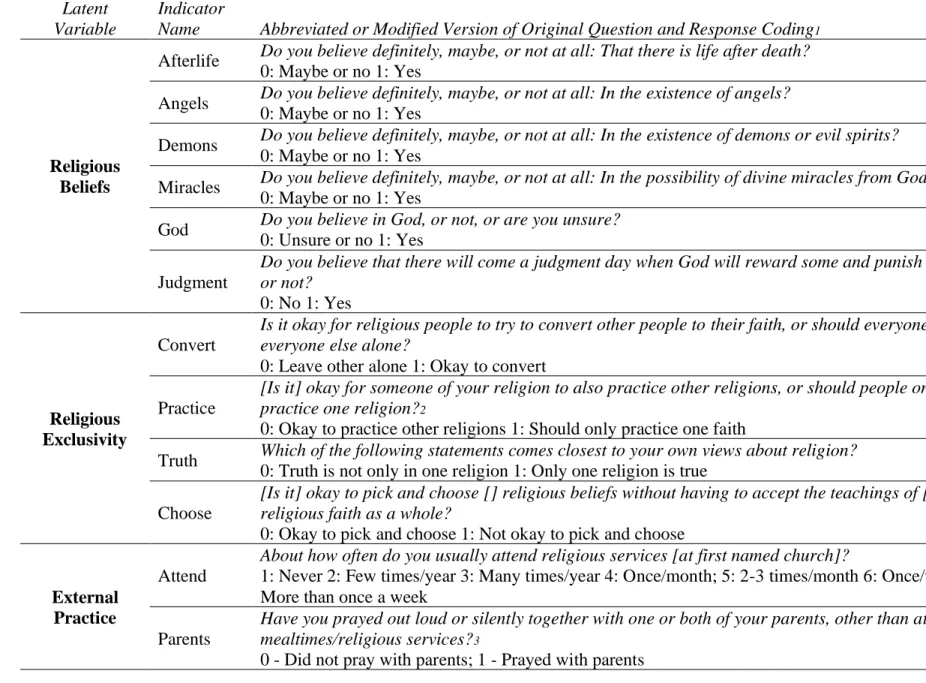
The measurement model from Pearce et al. (2017) that will be replicated here has five
latent variables and 21 indicator variables. The full wording and coding of these 21 variables are
shown in Table 1.1. Each indicator has been given a shortened name for display in the table.4
Religious Beliefs has six binary indicators that reflect whether respondents believe in 1) the
afterlife, 2) angels, 3) demons, 4) miracles, 5) God, and 6) a final judgment day. Religious
Exclusivity has four binary indicators for whether respondents 1) have tried to convert someone,
2) think that people should only practice one religion, 3) think that truth is only in one religion,
and 4) think that people should not pick and choose beliefs from a religion. External Practice
includes religious service attendance (ranging from 1 – never to 7 – more than once a week) and
three binary indicators that reflect whether respondents 1) pray with their parents, 2) participate
in a religious group, and 3) have shared their faith with someone in the past year. Personal
Practice is reflected by how often respondents pray (ranging from 1 – never to 7 – many times a
3 However, results were substantively similar using all available information through a pairwise present treatment of missing data.
day), how often they read from religious scriptures to themselves alone (ranging from 1 – never
to 7 – many times a day), and two binary indicators for whether they 1) fasted or practiced
another spiritual discipline or 2) practiced a weekly day of rest to keep the Sabbath. Finally,
Religious Salience is captured by how important respondents consider their religious faith to
their daily life (ranging from 1 – not important at all to 5 – extremely important) and two binary
indicators reflecting 1) if they would do what God (or scripture) says is right in an ambiguous
situation and 2) whether they made a commitment to live their lives for God.
[Table 1.1 about here]
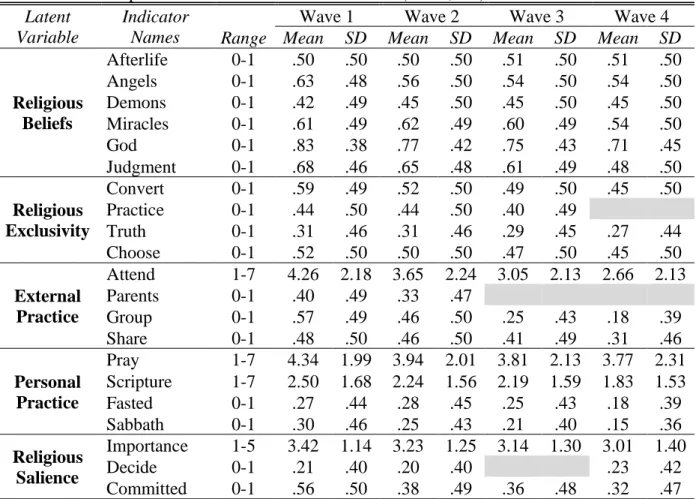
Descriptive statistics for all indicator variables are shown in Table 1.2. As can be seen
from the means in Wave 1, the sample is moderately religious as adolescents. Regarding
religious beliefs, about 85 percent believe in God and between 40 and 70 percent believe in the
afterlife, angels, demons, miracles, and a coming judgment day. While a little less than a third
would agree that truth is found exclusively in one religion, more than half have tried to convert
someone. The mean value of attendance (4.11) indicates that respondents attend services just a
little more than once a month, on average. Relatedly, on average, respondents pray more than
once a week (mean = 4.32), read scripture a little less than once or twice a month (mean = 2.56),
and say that religion is between “very” and “extremely” important to how they live their lives
(mean = 3.43).
[Table 1.2 about here.]
It is also important to note from these descriptive statistics the presence of both stability
and change in the sample between Waves 1 and 4. For example, belief in the afterlife stays
nearly constant at 50 percent. Belief in demons actually increases slightly. Most of the other
about 62 percent (Wave 1) to 55 percent (Wave 4). The percentage of people who have tried to
convert someone else drops from 54 percent to 44 percent, while those fasting or practicing a
spiritual discipline drops from 24 percent to 17 percent. Notably, while there are no appreciable
increases in any indicator across time, there are several appreciable decreases. Belief in a final
judgment day drops over 20 percentage points between Waves 1 and 4, participation in a
religious group drops nearly 40 percentage points, and attendance drops from more than monthly
(mean = 4.11) to more than a few times per year (mean = 2.66). In sum, the overall picture is one
of gradual, decreasing religiosity, yet there are a few stable measures and a few measures
showing steep declines.
Analytic Strategy
Model confirmation at Waves 3 and 4. Figure 1.1 shows a visual of the proposed
measurement model at a cross-sectional and unspecified time point. The ovals represent the
latent dimensions of religiosity while the observed indicators are positioned in rectangles. The
arrows emanating from the latent variables to the observed indicators illustrate that the latent
variables are hypothesized to directly affect the indicators. Each indicator also has a
single-headed arrow pointing to it on the opposite side of the latent variable – this indicates its error
term, as it is not presumed to be a perfect measure of the latent variable.
[Figure 1.1 about here.]
Figure 1.2 positions the cross-sectional measurement model from Figure 1.1 into a
longitudinal framework. To avoid cluttering the diagram, individual indicator variables and their
errors are not shown, but they remain the same as in Figure 1.1. In this figure, the proposed
model spans four time points (in this case, waves of data). Pearce et al. (2017) estimate the left
half of this figure (Waves 3 and 4, together) and then the entire figure (a model that spans all
four waves). This will test whether the proposed model from Pearce et al. (2017) fits the data
well for the young adult sample and for the entire span between adolescence and young
adulthood. A good-fitting model would provide support for this five-dimensional typology of
religiosity beyond just adolescence and into adulthood.
[Figure 1.2 about here.]
These models will be fit using confirmatory factor analysis (CFA) within a structural
equation modeling framework (Bollen 1989). The general measurement model can be depicted
by the expression:
𝒁 = 𝜶 + 𝚲𝐋 + 𝛆
where Z is the vector of all observed variables (indicators), 𝜶is the vector of intercepts, 𝚲 is the
matrix of factor loadings, 𝐋is the vector of all latent variables, and 𝛆 is the vector of error terms
(Bollen 1989). For the longitudinal models estimated here (Waves 3-4 and then Waves 1-4), all
latent variables are allowed to correlate with each other, and the errors of each indicator variable
are allowed to correlate with themselves at different waves. To scale the latent variables, each of
their means are set to zero and their variances constrained to one.
Analyses are conducted using Mplus version 8.3 (Muthen and Muthen 1998). Because
the measures are ordinal or binary, the weighted least squares estimator (WLS) is used, which
has been shown to produce consistent parameter estimates, correct standard errors, and accurate
fit statistics for categorical indicator variables (Bollen 1989).
Standard measures of global model fit are used to evaluate the estimated models: the
chi-square test statistic, Comparative Fit Index (CFI), Tucker Lewis Index (TLI), root Mean Square
modified version of the Bayesian Information Criterion (BIC). While there is no clear consensus
on the requisite values of each fit statistic needed to accept a model, evidence in favor of the
models generally includes small, non-significant chi-square test statistics, CFI and TLI values
greater than .95 and close to an ideal fit of 1.0, RMSEA values less than .06, SRMR values less
than .08, and BIC values less than zero (Bollen 1989; Bollen and Curran 2006; Hu and Bentler
1999; Kline 2015; Raftery 1995; Schwarz 1978). Because no single measure of fit provides a
perfect model assessment, it is recommended that researchers consider multiple fit statistics in
combination with each other when assessing a model (Bollen 1989), as will be done here.
The longitudinal model spanning all four waves will also be compared to several
alternative specifications that combine dimensions of religiosity. For these, I repeat the same
chi-square difference tests as those from Pearce et al. (2017). The alternative specifications include
models that combine: 1) Religious Salience and Personal Practice, 2) External Practice and
Personal Practice, 3) Religious Exclusivity and Religious Beliefs, and 4) all five latent variables.
These chi-square difference tests will show whether the five-dimensional model is a stronger
representation of the data than the more parsimonious model that combines latent dimensions
(i.e., treats them as a singular dimension within wave and across time).
Finally, after assessing global model fit at each wave, components of fit will be
evaluated. These include correlations of latent variables, factor loadings, and explained variance
in each of the observed indicator variables.
Modeling change over time. The second part of the analysis will go beyond the
description of the five-dimensional model and will model change in each religious dimension
over time. Specifically, this part of the analysis will use latent variable (LV) autoregressive latent
incorporate both time-invariant and time-varying covariates to model change in each dimension
of religiosity over time. One particular strength of these models is that they combine the
desirable features of both autoregressive models and growth curve models, which have often
been presented as competing models for longitudinal data (Bollen and Curran 2004). In other
words, the ALT framework allows for both an autoregressive component, where prior values of a
dependent variable can have direct effects on its subsequent values, and a latent trajectory, where
individuals are allowed to have unique intercepts and slopes over time for repeated measures.
While there is no empirical precedent for the ALT model specifically for religious change,
theory would suggest that this model is warranted. For example, numerous studies have shown
religion indicators at prior time points to be strongly predictive of religion indicators at current
time points (Denton and Uecker 2018), and there is a great deal of continuity in religious beliefs,
practices, and affiliations of religiosity throughout life, despite much research being focused on
change (Bengtson et al. 2015; Lee et al. 2018; Pearce and Denton 2011; Smith and Snell 2009).
This warrants the inclusion of an autoregressive component to any models of religious change
over time. On the other hand, empirical examples of growth curve modeling for religious change
provide evidence that individuals vary in both their starting value and trajectories on a number of
religion indicators (Desmond et al. 2010; Petts 2009). Thus, this warrants the inclusion of latent
curve trajectories in models of religious change over time. No study has combined these two into
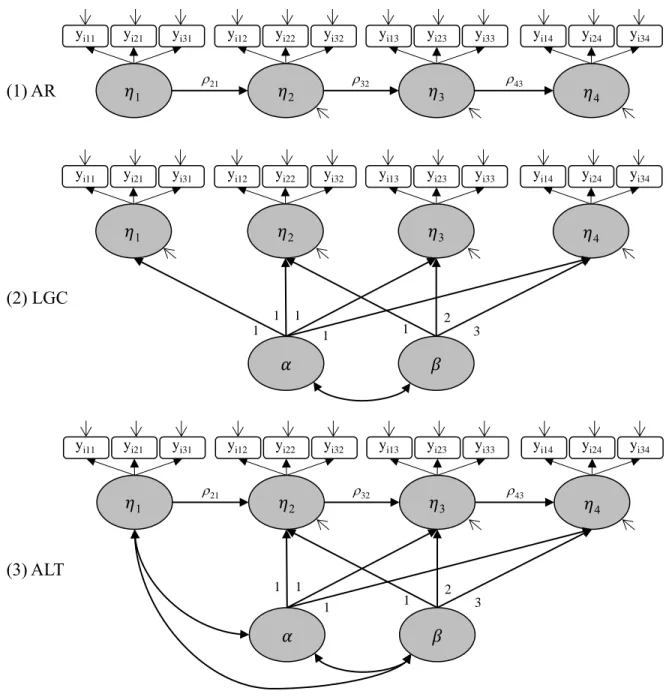
a single approach via the ALT model. A visual diagram, illustrating these three competing
models, is presented in Figure 1.3.5 The models in the figure each depict a single latent variable
measured by three indicator variables at four time points. They could apply to any of the
religiosity dimensions discussed here.
[Figure 1.3 about here.]
The ALT model at the bottom of Figure 1.3 can also be modified to account for
additional covariates. This model, known as the conditional ALT model, is the focal model of
these longitudinal analyses, since both family characteristics and life course transitions are of
interest as predictors of the latent dimensions of religiosity. A visual diagram of the conditional
ALT model is depicted in Figure 1.4.
[Figure 1.4 about here.]
In this model, we have observed indicator variables, 𝑦𝑖𝑗𝑡, which are influenced at each wave by
the religion latent variables, 𝜂𝑖𝑡, that they reflect. Each religion variable, from the second wave
onward, is predicted by its value at the prior wave, 𝜌𝑡,𝑡−1 (the autoregressive component), the
growth curve intercept, 𝛼, and the growth curve slope, 𝛽. The set of time-varying covariates,
Υ𝒙𝑡𝑿𝑖𝑡, affects the religion latent variables, 𝜂𝑡,𝑡=1−4, at each wave. The growth curve
components, 𝛼 and 𝛽, and the religion latent variable at the first time point (Wave 1), 𝜂1, are also
predicted by a set of time-invariant characteristics, Υ𝛼𝒁𝑖,Υ𝛽𝒁𝑖, and Υ𝒛1𝒁𝑖, respectively. This
model (depicted fully in Figure 1.4) is estimated for each of the five latent variables from the
measurement model above, with all the same indicators as shown in Tables 1.1 and 1.2.
Time-invariant covariates. The time-invariant covariates are hypothesized to predict 𝜂1,
𝛼, and 𝛽. Thus, any effect they have on dimensions of religiosity at later time points (Waves 2-4)
are theorized to be indirect through 𝜂1, 𝛼, and 𝛽. These covariates all come from the baseline,
Wave 1 survey. As parental religiosity is crucial for understanding both the baseline and change
variables for parental religiosity are included: parental religious attendance (ranging from 0 –
never to 6 – more than once a week) and parental religious importance (ranging from 0 – not
important at all to 5 – extremely important). Other covariates likely to affect both baseline and
growth components of religious change (Smith and Denton 2005) that are included here are age
(13-17), race (white as referent, black, Hispanic, and other), whether respondent lives in the
south (0 – no, 1 – yes), and religious tradition (conservative Protestant as referent, mainline
Protestant, Black Protestant, Catholic, other religion, and unaffiliated).
Time-varying covariates. These variables are hypothesized to have contemporaneous
effects on the latent dimensions of religiosity at each wave. These include important life course
transitions and characteristics that have been shown to affect religiosity, as discussed in the prior
section. The first two covariates are dummy indicators for whether or not respondents live with a
parent (0 – no, 1 – yes) or are currently enrolled in college (0 – no, 1 – yes).
The next covariate is denoted as “relationship status” and is a categorical variable that
places respondents into one of four categories: married, cohabiting with a romantic partner,
single and sexually active, or single and sexually inactive. The value of this typology is that it
distinguishes between unmarried respondents; since both cohabitation and sex outside of
marriage are inversely associated with religiously, yet do not necessarily overlap with each other,
it is important to allow their effects to vary. Further, this typology does not conflate marital sex
with nonmarital sex, which a dummy variable for sexual activity alone would do. Since only
nonmarital sex would be theoretically expected to decrease religiosity, this distinction is
important. Finally, “sexually active” here means the respondent has had sex within the last
month. Because this is a contemporaneous, time-varying measure, this is more appropriate than
behavior that happened a decade ago. Theoretically, if non-marital sex leads one to feel guilt or
cognitive dissonance about violating religious teachings (Uecker et al. 2007), that effect should
be captured by a recent measure of sexual activity rather than a measure of any lifetime sexual
activity. In the models here, the referent category for this relationship status variable is single
and sexually active people. In Wave 1 only, no adolescent respondent was married or cohabiting,
so this variable simply becomes a dummy variable for single and sexually inactive.
Finally, the last time-varying covariate in this analysis is the number of children that live
with the respondent at least half the time. Unfortunately, this question was not asked at Waves
1-3, so it is introduced in Wave 4. The values range from 0 to 5. Descriptive statistics for all
time-invariant and time-varying covariates are shown in Table 1.3. The sample size decreases slightly
from the measurement model (from 1,539 to 1,474) due to missing data on these covariates,
though the descriptive statistics for the indicator variables do not substantively change so they
are not reproduced here.
[Table 1.3 about here.]
As can be seen from Table 1.3, on average, respondents’ parents have moderately high religious
attendance (mean = 3.33) and importance of faith (mean = 3.94). At baseline, the average age of
respondents is about 15, the sample is 54 percent female, 77 percent white, 11 percent black, 8
percent Hispanic, and 5 percent other race. A little over a third (37 percent) are from the south.
About a third (33 percent) are conservative Protestants, with the next largest groups being
Catholics (24 percent), mainline Protestants (13 percent), “other” traditions (13 percent),
unaffiliated (11 percent), and black Protestants (7 percent).
The percentage of respondents living with a parent decreases over time, with a
peaks in Wave 3 at 59 percent, and drops below 10 percent at Wave 4. As for relationship status,
most people are single and sexually inactive at Wave 1, though this group diminishes at each
subsequent wave. The percentage of people who are single and sexually active, married, or
cohabiting increases over time. Finally, at Wave 4, the mean number of children is .370, though
respondents have up to five children.
RESULTS
Model Confirmation at Waves 3 and 4
Table 1.4 presents the fit statistics for the measurement model at Waves 1-2, Waves 3-4,
and Waves 1-4. The fit statistics from Waves 1-2 are simply a replication from Pearce et al.
(2017), but are shown here for comparison. Beginning with Waves 3-4, the model shows good fit
overall. It has a large and significant chi-square value, but this is common in large samples with
high statistical power. The CFI and TLI are well beyond a .95 threshold of good fit, and are
better than those from the Waves 1-2 model. The RMSEA, SRMR, and BIC also all indicate
good fit, though two of them are slightly weaker than their counterparts from the Waves 1-2
model. The full longitudinal model, spanning all four waves, has a large chi-square value, but all
other fit statistics indicate a very strong fit.
[Table 1.4 about here.]
Despite having good overall fit, it is possible that a more parsimonious model – one that
combines dimensions – may fit even better. In Table 1.5, I test four of these alternatives using a
chi-square difference test between the full longitudinal model and a version of the model in
which the combined latent variables are constrained to have correlations of 1.0 within each wave
and equal correlations to every other latent variable within and between waves. The large and