TRANSCRIPTIONAL REPRESENTATIONS IN DISCRETE NEURAL SYSTEMS AND THEIR TUNING BY CHRONIC PHYSIOLOGICAL PRESSURES
Marcus Luis Basiri
A dissertation submitted to the faculty at the University of North Carolina at Chapel Hill in partial fulfillment of the requirements for the degree of Doctor of Philosophy in
Neuroscience in the Graduate School.
Chapel Hill 2020
ABSTRACT
Marcus Luis Basiri: Transcriptional Representations in Discrete Neural Systems and Their Tuning by Chronic Physiological Pressures
(Under the direction of Garret D. Stuber)
The emergence of complex behavioral, sensory, and cognitive capacities in bilaterian animals was enabled by the evolution of diverse ensembles of neuronal cell-types. To understand how discrete populations of neurons participate in complex circuit-level processes, contemporary systems-circuit-level approaches have sought to assign cell-type-specific transcriptional features to define heterogeneous populations across the brain. However, gene expression is inherently plastic, and how discrete neuronal cell-types are sculpted by systemic pressures is not well understood. Here, we leverage high-throughput single-cell RNA-sequencing to explore how chronic pressures are represented across discrete neural systems in brain regions that are involved in the homeostatic responses to these pressures. We study this concept of transcriptional allostasis through two different models. First, we examine how lateral hypothalamic area neurons are shaped by chronic high fat diet in obesity. Next, we investigate the kinetics of cell-type-specific alterations in transcriptional states within the nucleus accumbens and medial thalamic complex during spontaneous withdrawal from escalating morphine. With this, we identify and characterize discrete substrates that are uniquely sensitive to biologically-relevant allostatic pressures, thereby potentially contributing to the
ACKNOWLEDGEMENTS
Foremost, I thank Dr. Garret Stuber for his persistent trust, leadership, and enthusiasm. The Stuber lab is an exceptionally exciting place to do science, and I am fortunate to have trained under his mentorship. I also thank the members of my graduate school Dissertation Committee and the MSTP Leadership for their guidance and support. To my colleagues in the Stuber lab and in the departmental communities at the University of North Carolina at Chapel Hill and the University of Washington, thank you—these years have been a blast and I deeply respect you all very much. Specifically, Chef/Dr. Mark Rossi—thank you for being a great teammate in science, friend, and mentor. Vijay and Ivan—our evening chats about science and life energized me throughout these years. Thank you. Koichi and Yoshiko—I look up to both of you very much and I am excited to follow your scientific careers. Thank you for the
TABLE OF CONTENTS
LIST OF FIGURES……….………..………...ix
LIST OF ABBREVIATIONS……….……….……...……...x
CHAPTER 1. GENERAL INTRODUCTION: THE HETEROGENEITY OF NEURAL TISSUES…...……….…….…….…..………..….1
On the emergence of neural diversity…….………...…...1
Historical Approaches to Cataloging the Brain………...……...4
Defining Cell-Types in the Context of Cell-State Plasticity…...….………..………..5
CHAPTER 2. AN INTRODUCTION TO HIGH-THROUGHPUT SINGLE-CELL RNA SEQUENCING………..………...6
Methods and Technologies: An Overview……...……….………….…………..6
Molecular biology of single-cell RNA sequencing……….…11
Computational biology of single-cell RNA sequencing……….………13
Normalization, artifacts, collisions, and quality....………..14
Clustering……….16
Inference of cell-state dynamics……...………...17
Applications in Neural Systems………17
CHAPTER 3. REMODELING OF THE LATERAL HYPOTHALAMIC AREA TRANSCRIPTIONAL LANDSCAPE IN OBESITY……….…………...19
Introduction………..19
Drop-Seq Identifies Canonical Cell-Types in the
Lateral Hypothalamic Area……...21
Transcriptional Tuning Across Lateral Hypothalamic Cell-Types During Obesity...………....22
Distinct Transcriptional Representations of Obesity in Lateral Hypothalamic Glutamate Neuron Subtypes...24
Viral SaCas9-Mediated Mutation of Neurotensin in Lateral Hypothalamic Glutamate Neurons Attenuates HFD-Induced Weight Gain………25
Discussion.………...………...………26
Methods………29
Tissue Isolation and Drop-Seq……….29
Single-Cell RNA-Sequencing Clustering and Analysis……….30
Functional Annotations and Pseudotime Analysis………33
Single-Cell GWAS Association……….………34
Nts∷gRNA SaCas9 AAV Construct Design, Cloning, and Surgery………36
Body Composition and Temperature……….……….…37
CHAPTER 4. CELL-TYPE-SPECIFIC TRANSCRIPTIONAL KINETICS INFORM ALLOSTATIC TRAJECTORIES IN OPIATE WITHDRAWAL……….………....54
Introduction………..54
Results………...57
A Transcriptional Atlas of Accumbal and Medial Thalamic Cell-Types….57 Prioritization of Transcriptional Allostasis Across Cell-Types During Morphine Withdrawal………58
Transcriptional Kinetics of Morphine Withdrawal Within Accumbal Neuronal Subtypes ……….………59
Discussion………61
Animals and Morphine Administration……….63
Tissue Isolation and Single-Cell RNA-sequencing………63
Single-Cell RNA-Sequencing Clustering and Analysis……….65
Cell-type prioritization and Pseudotime Analysis………..68
CHAPTER 5. GENERAL DISCUSSION…………...79
LIST OF FIGURES
Figure 1 – Droplet-based single-cell RNA-sequencing workflow………38 Figure 2 – LHA Drop-Seq library quality metrics………...……40 Figure 3 – Transcriptional profiling of LHA cells following chronic HFD exposure...…...42 Figure 4 – HFD alters the transcriptional profile of LHAVglut2 neurons………....…...44
Figure 5 – Genes comprising annotation classes altered in LHAVglut2 neurons
demonstrate pseudotime-dependent expression patterns………...…....…...46 Figure 6 – Distinct subtypes of LHAVglut2 neurons are modified by HFD………...48
Figure 7 – Modification of Vglut2 subclasses by HFD and GABA and Glutamate
receptor expression in glutamate subclasses………...…....………...49 Figure 8 – Neuropeptide, transcription factor, and GPCR differential
expression in glutamate sub-clusters………...50 Figure 9 – SaCas9-mediated loss-of-function of Neurotensin in LHAVglut2
neurons attenuates HFD-induced weight gain………...52 Figure 10 – Single-cell RNA-sequencing of the nucleus accumbens and medial
thalamic complex following morphine withdrawal……….…………70 Figure 11 – Sequencing and quality metrics for single-cell RNA-sequencing of
nucleus accumbens and medial thalamic complex……….……....71 Figure 12 – Characterization of major resident cell-types in the nucleus
accumbens and medial thalamic complex……….………...73 Figure 13 – Morphine withdrawal causes distinct temporal
changes in gene expression………75 Figure 14 – Gene expression kinetics in a subtype of neurons
LIST OF ABBREVIATIONS
AAV Adeno-Associated Virus aCSF Artificial Cerebrospinal Fluid ANOVA Analysis of Variance
APV (2R)-amino-5-phosphonovaleric acid AUC Area Under the Curve
BMI Body Mass Index
BSA Bovine Serum Albumen
cAMP Cyclic Adenosine Monophosphate
cDNA Complementary DNA
DEG Differentially-expressed gene DNA Deoxyribonucleic Acid
DNQX 6,7-dinitroquinoxaline-2,3-dione FISH Fluorescence In Situ Hybridization GABA Gamma-Aminobutyric acid
GPCR G Protein-Coupled Receptor GWAS Genome-Wide Association Study
HFD High Fat Diet
LHA Lateral Hypothalamic Area MMLV Moloney Murine Leukemia Virus MTC Medial Thalamic Complex
NIDA National Institute on Drug Abuse NIH National Institutes of Health
NMDG N-methyl-D-glucamine
PAM Protospacer Adjacent Motif PCA Principal Components Analysis PCR Polymerase Chain Reaction
PKA Protein Kinase A
PVT Paraventricular Nucleus of the Thalamus
RNA Ribonucleic Acid
SE Standard Error
SMART Switching Mechanism at 5′ End of RNA Template SNP Single Nucleotide Polymorphism
SNR Signal-to-Noise Ratio
SPRI Solid-Phase Reversible Immobilization SVA Surrogate Variable Analysis
t-SNE t-Distributed Stochastic Neighbor Embedding
TTX Tetrodotoxin
CHAPTER 1. GENERAL INTRODUCTION: THE HETEROGENEITY OF NEURAL TISSUES On the emergence of neural diversity
Living structures—from unicellular protists to complex chordates—can be defined
by their unique capacity to resist thermodynamic entropic forces and maintain
sophisticated, enduring forms1. Essential to this is the ability of living biological systems
to sample physical signals, both intrinsic and extrinsic, and generate an appropriate
response that contributes to their structural and temporal persistence. In the most
fundamental biological unit of life—the cell—such abilities are achieved through
extracellular and intracellular receptor systems coupled to signaling relays, which
ultimately actuate a conditionally-specific reaction. In multicellular organisms, however,
maintaining complex forms requires signals to be communicated not only within the cell
but also between cells, sometimes across distant regions and between dissimilar
tissues. The capacity to faithfully communicate detailed information across distances is
therefore not only an adaptation, but an absolute requisite for complex multicellularity.
Although it is unclear whether multicellularity began through symbiosis, cellularization of
a syncytium, or through colonial organization, survival under all three hypotheses is
dependent on the ability of individual cells to exchange information about local internal
and external states (Brunet and King, 2017). In its most rudimentary forms, such
communication occurs primarily through juxtacrine and paracrine mechanisms, with air
or water serving as the carrier medium for volatile or soluble chemical cues. However,
juxtacrine communication requires contact, and paracrine diffusion-based
communication is generally slow, imprecise, and subject to temporal averaging and a
loss in amplitude with distance (Berg and Purcell, 1977; Gregor et al., 2007; Shalek et
al., 2014). Consequently, as biological systems evolved to occupy more specialized
ecological niches, so too did their need for rapid, high-fidelity transmission of complex
signals across larger distances.
Although all cells maintain specific intracellular ionic concentrations and
therefore an electrical membrane potential, elementary examples of rapid electrical
conduction between spatially-distant cells has been observed in some basal metazoans
including certain classes of colonial hydrozoans and Porifera. For example, ancient
glass sponges conduct electrical impulses through a trabecular syncytium to precisely
coordinate ciliary currents required for feeding (Leys and Mackie, 1997; Leys et al.,
1999). However, such electrical conduction is limited in its speed of transmission and its
potential signal complexity, and although sponges are relatively homogenous in
cell-type, such communication would be unable to act on distinct receptor or effector tissues
outside of the syncytium. Still, the use of electrical conduction is thought to allow these
species to occupy unique ecological niches by providing them the ability to rapidly
toggle filter feeding to protect them from transient environmental hazards (an example
of behavioral instinct). As such, these species represent the longest-living known
metazoan classes, with lifespan estimates in some glass sponges reaching
As are many things in comparative evolutionary taxonomy, the ancestral origins
of the prototypical neuron remain in dispute. The earliest two hypotheses, both
generated by students of Ernst Haeckel, proposed competing monophyletic versus
polyphyletic theories for neural origins (Hertwig and Hertwig, 1878; Kleinenberg, 1872;
Moroz, 2009). Although the early events in nervous system evolution are unclear, and
there is significant evidence supporting both a single common ancestor for all neural
components as well as the merging of separate anatomical and genetic components
from distinct ancestral lineages, contemporary theories mostly agree that neurons
eventually evolved from specialized cells of epithelial origin (Kristan, 2016). The most
primitive living example of a complete prototypical neural circuit is found in the true
jellyfish (Scyphozoa), where specialized epithelially-derived photo- and proprioceptive
sensory structures act on pacemaker neurons that chemically synapse with motor
structures to coordinate rhythmic movement (Katsuki and Greenspan, 2013).
The emergence of simple sensory input-to-motor output circuits is thought to
have authorized an evolutionary scramble that promoted the rapid selective
specialization of cell-types, ultimately yielding a heterogeneous array of sensory
neurons, interneurons, and projection neurons that allowed metazoa to successfully
occupy more specialized ecological niches through the accumulation of diverse
sensory, behavioral—and eventually—cognitive capacities (Kristan, 2016; Monk and
Paulin, 2014). Over roughly 500 million years, this selective specialization of neural
systems has fashioned a stunning organization of cell-types in the brain of unmatched
Historical Approaches to Cataloging the Brain
The concept of neuronal “cell-types” was first acknowledged and studied by
Santiago Ramón y Cajal, who—by using a what was then state-of-the art silver staining
method developed by Camillo Golgi—was able to visualize sparse groups of neurons
within densely populated regions with clear morphological detail (Santiago Ramón y
Cajal, 1909). With this, he established that neurons were discrete units rather than an
interconnected mesh, and that a wide catalog of neuronal morphologies existed
throughout the nervous system. The categorization of cell-types by morphological
features continued with the development of more sophisticated imaging and staining
techniques (MacNeil and Masland, 1998), and these metrics were combined with
classifications according to connectivity across brain regions (Shepherd, 2004).
Additionally, the invention of single- and multi-cell electrophysiological recording
methods allowed for neurons to be classified by inherent electrical properties and firing
patterns, and these electrophysiological characterizations were subsequently combined
with morphological and connectivity information to more-precisely classify cells in the
brain (Ascoli et al., 2008; Devries and Baylor, 1997; Gupta et al., 2000; Jiang, 2015;
Káradóttir and Attwell, 2006; Somogyi and Klausberger, 2005).
In addition to morphological and physiological information, an appreciation for the
molecular heterogeneity of neuronal populations began with the recognition of distinct
enzymes, receptors, and neuropeptides involved in neuronal functional specification
(Fremeau et al., 2001; Lightman, 1988; Shirasaki and Pfaff, 2002). With the
development of in situ hybridization methods, testing for the expression of specific
allowing for the detection any known transcript coding sequence to be readily examined
(Lewis et al., 1988; Sunkin et al., 2012). Concurrently, more advanced high-dimensional
methods for characterizing the transcriptional features of neuronal cells enabled the
enormous magnitude of neuronal molecular complexity to be more comprehensively
appreciated and assigned for the first time (Dulac and Axel, 1995; Zeisel et al., 2015).
Defining Cell-Types in the Context of Cell-State Plasticity
Neuroscience is rapidly cataloging the transcriptional character of neuronal
populations across wide brain regions, with systems-level approaches to collecting
additional types of molecular information such as epigenomic and proteomic
composition likely on the horizon. However, cellular identifies and their defining features
are fully plastic (Takahashi and Yamanaka, 2006), and as such, defining cell-types by
the presence of a certain feature or collection of features is inherently problematic.
Furthermore, the specificity of cell-type definitions is subjective to the resolution
demanded by interpreter, as theoretically every individual cell within a population could
be segregated by molecular features as surveyed in a particular moment of time. This
challenge might be addressed by considering the intersection of functional and
molecular specificity in ascribing cell-types, but this too is complicated by plastic
considerations, especially in the brain where plasticity across circuits is complex and
ongoing. Thus, a faithful cell-type designation cannot exist without prior assumptions.
For the sake of simplification, however, a suitable cell-type definition should thus only
consider features that are resilient to nearly all pressures through which the cell has the
capacity survive, and similarly, cell-state can be defined as the collective response to
CHAPTER 2. AN INTRODUCTION TO HIGH-THROUGHPUT SINGLE-CELL RNA SEQUENCING2
Methods and Technologies: An Overview
In order to achieve divergent functional specificity, the adult brain is comprised of
a diverse catalog of neuronal cell-types that exhibit unique functional and morphological
complexity. All neurons share the same genome within an individual, and interregional
and intraregional neuronal diversity is therefore borne from distinct patterns of gene
expression across cellular populations. Accordingly, the observation that unique
transcriptional features can be used to discriminate unique functional populations in the
brain has significant historical precedent (Edlund and Jessell, 1999; Fremeau et al.,
2001; Lewis et al., 1988; Lightman, 1988; Shirasaki and Pfaff, 2002; Sunkin et al., 2012;
Tasic et al., 2016; Zeisel et al., 2015). However, it has become increasingly recognized
that neuronal subtypes are often marked by either undescribed individual features or a
multiplexed combination of features, thereby requiring sufficient numbers of unique cells
to be profiled in order to achieve sufficient tissue-level resolution. Within the past few
years, a number of high-throughput genomic strategies have enabled the examination
of thousands-to-millions of cells simultaneously and at sufficient depth (Cao et al., 2017;
Klein et al., 2015; Macosko et al., 2015; Rosenberg et al., 2018). This revolution in
high-throughput single-cell sequencing approaches, originally catalyzed by specialist
2 Some material within this chapter will appear as part of a book; citation as follows: Rodriguez-Romaguera J,
methods, have recently reached a point in which they have become accessible to most
labs both in terms of technical prerequisites and cost. Although this discussion will be
focused on single-cell RNA-sequencing, similarly notable advances have been made in
other avenues of single-cell genomics including single-cell DNA-sequencing (Lan et al.,
2017) and single-cell epigenomics (Cusanovich et al., 2015; Stevens et al., 2017).
Preceding to the development of RNA-sequencing, genome-wide gene
expression profiling of either bulk tissues or single-cell extracts generally relied on
analog imaging-based hybridization technologies, primarily in the form of DNA
microarrays (Churchill, 2002; Schena et al., 1995; Taub et al., 1983). To dissect the
heterogeneity of neural tissues, pioneering single-cell microarray methods were applied
to the exploration of neuronal transcriptional programs (Iscove et al., 2002; Kamme et
al., 2003; Tietjen et al., 2003). However, these hybridization-based methods required
bait sequences to be known beforehand and were subject to oversaturation by
highly-expressed genes or poor detection of rare transcripts, confounding quantitative
sensitivity (Kukurba and Montgomery, 2015). Microarrays were eventually replaced by
Sanger sequencing-based methods such as low-throughput and quantitative
sequencing of complementary DNA (cDNA) clones (Expressed Sequence Tag libraries)
or sequencing of chemically-tagged and captured cDNA pools (i.e. Serial Analysis of
Gene Expression, Cap Analysis Gene Expression) (Adams et al., 1991; Itoh et al.,
1994; Shendure, 2008; Shiraki et al., 2003; Velculescu et al., 1995). Although tag-based
methods allowed for precise digital quantification of gene expression levels, they were
isoform-insensitive and generally produced short reads that were difficult to align to a
required relatively large amounts of RNA to be isolated, were manually intensive, and
were limited by the high cost-per-base of Sanger sequencing (Wang et al., 2009).
Genome-wide gene expression analysis was eventually revolutionized by the
development of high-throughput next-generation sequencing, which allowed for rapid
massively-parallel sequencing of polynucleotide sequences at a small fraction of the
cost of Sanger sequencing (Bentley, 2008; von Bubnoff, 2008). This quickly enabled
deep RNA-sequencing of bulk tissue lysates, allowing for the interrogation of
transcriptional events at high transcriptomic coverage and resolution for the first time
(Kukurba and Montgomery, 2015; Lister et al., 2008; Mortazavi et al., 2008;
Nagalakshmi, 2008; Shendure, 2008; Wang et al., 2009; Wilhelm, 2008). The basic
technical and analytical principles of these bulk RNA-sequencing approaches laid the
groundwork for more sophisticated single-cell methods, and they continue to inform the
principles of contemporary high-throughput single-cell RNA-sequencing strategies.
The first single-cell RNA-sequencing experiments relied on manual microscopic
selection of individual cells (Kurimoto, 2006; Kurimoto et al., 2007; Tang et al., 2009).
Although at least one-hundred single-cell RNA-sequencing methods have been
described to date3, these methods are generally all comprised of a workflow similar to
that of bulk RNA-sequencing approaches. Briefly, RNA is isolated from individual
cellular or nuclear lysates, reverse transcribed, amplified, and prepared for
next-generation sequencing. The primary differences in these methods is in their cDNA
amplification technologies and in their approaches to the highly-multiplexed capture of
3 For a community-complied list of high-throughput single-cell RNA-sequencing methods, see:
RNA from individual cells. The most common of these high-throughput single-cell
sequencing approaches can generally be grouped into either droplet-based (Klein et al.,
2015; Macosko et al., 2015) or plate-based methods (Campbell et al., 2017; Cao et al.,
2017; Moffitt et al., 2018; Rosenberg et al., 2018). Droplet-based methods use
microfluidic devices to deliver cells, reagents, and barcoded oligonucleotide-coated
microparticles into nanoliter-sized emulsions which serve as a compartment for the
capture of polyadenylated transcripts. These barcoded microparticles are then pooled
and subjected to solid-phase cDNA amplification to ultimately generate sequencing
libraries. Rather than relying on microfluidic devices to isolate cells, plate-based
strategies instead generate multiplexed sequencing libraries by distributing cells into
96-well plates and performing multiple successive rounds of in situ reverse transcription
and barcode ligation, with pooling and redistribution of cells between each round. Thus,
both droplet-based and plate-based strategies are able to generate next generation
sequencing libraries from thousands-to-millions of cells in which each library molecule is
barcoded by transcript-, cell-, and sample-of-origin.
The choice of droplet-based versus plate-based strategy depends on factors
including the amount of starting material, the required depth of transcriptome coverage,
the number of cells to be achieved, cost, and convenience. In general, plate-based
strategies require considerably more starting material and sacrifice depth of coverage
but can be used to produce data from a greater number of individual cells at a
significantly lower cost. Although home-built droplet microfluidic-based strategies often
demand a significant amount of technical expertise and investment, they have recently
process, provide consistent performance across datasets, and generate high-quality
data at greater depth (Kim et al., 2019; Sharma et al., 2020). However, such
commercial options require specialized proprietary equipment and significant reagent
costs, dramatically increasing the cost-per-cell. Ultimately, however, the choice of
droplet-based or plate-based strategy depends mostly on experimental requirements.
For small brain nuclei or samples that are cost- or time-prohibitive to generate,
commercial droplet-based strategies may be most appropriate; plate-based strategies,
on the other hand may be best suited to studies of large brain regions requiring
transcriptomes to be generated from a very large number of individual cells.
In terms of data robustness, the primary factor determining the statistical
resolution of feature identification and cell-type classification is the balance between
depth of transcriptome coverage and total number of cells (Svensson et al., 2017, 2017;
Zhang et al., 2020). Very roughly, shallow depth can be compensated for by generating
transcriptomes from a large number of cells, while a fewer number of cells in a dataset
can be overcome by sampling each cell’s transcriptome more deeply. Ultimately,
however, high-throughput single-cell RNA-sequencing methods are considered shallow
as compared to manual methods (Hodge et al., 2019; Tasic et al., 2016; Zeisel et al.,
2015), and this lack of depth is overcome by observing and statistically grouping a large
number of cells based on transcriptional similarity. The size and complex nature of data
generated from single-cell RNA-sequencing experiments has mandated the
development of novel computational approaches to interpret the data (Butler et al.,
2018; Macosko et al., 2015; Qiu et al., 2017; Vieth et al., 2019; Ziegenhain et al., 2017),
Molecular biology of single-cell RNA-sequencing
The transcriptome encompasses a diverse array of RNA species, with biological
information encoded in both the structure and conditional abundance of each molecule.
Within a cell, rare transcripts are not necessarily less biologically significant than
abundant transcripts; the number of molecules of an RNA species present at a
particular moment in time is determined by their partially-inherent cytoplasmic stabilities,
as dictated by production and decay kinetics. Therefore, in order to faithfully observe
transcriptional events within an individual cell, sufficient numbers of molecules must be
sampled and quantified within sensitivity and saturation limits that reflect the dynamic
range of cellular transcriptional signals.
The generation of sequencing libraries from individual cells has been traditionally
limited by the low amount of input RNA present in single-cell lysates, requiring either
multiple successive rounds of linear isothermal amplification (Eberwine et al., 1992; Van
Gelder et al., 1990) or exponential amplification (Dulac and Axel, 1995) of reverse
transcription products to achieve sufficient product for sequencing. However,
amplification-dependent methods produce artifacts that mask biological variation
including amplification of primer concatamers or misprimed genomic reads, jackpot
events resulting from stochastic early amplification bias, and signal oversaturation by
abundant transcripts (Iscove et al., 2002). Such technical confounders are inherent to
the overamplification of low-input substrates, introducing significant variability across
samples and complicating the accurate quantification of molecules both within and
across individual cells. In an effort to manage artifacts produced by excessive rounds of
with primer-embedded promoter sequences prior to cDNA amplification allow for fewer
rounds of amplification to be used (Kurimoto, 2006). However, these early methods
generally only provide short-read coverage of either the 3’ or 5’ ends of transcripts,
complicating read mapping and hindering the analysis of polymorphism and isoform
diversity (Islam et al., 2011; Kurimoto, 2006; Tang et al., 2009).
A number of methods have been developed to minimize amplification artifacts,
increase quantitative precision, and generate cDNA libraries that represent full-length
coverage across transcripts (Hashimshony et al., 2012; Islam et al., 2011; Kivioja et al.,
2012; Picelli et al., 2013, 2014; Ramsköld et al., 2012; Tang et al., 2009). These
methods primarily differ in the types of RNA molecules captured, cDNA coverage bias,
amplification method, strand specificity, and quantification strategy. Consequently,
contemporary high-throughput methods combine aspects of multiple base
methodologies (Hedlund and Deng, 2018; Macosko et al., 2015; Ziegenhain et al.,
2017). The most common contemporary molecular platform for both manual and
high-throughput single-cell RNA-sequencing is based on a template-switching PCR approach
to cDNA amplification (Switching Mechanism at 5′ End of RNA Template; SMART;
SMART-seq), and multiple improvements based on its components have been made as
single-cell RNA-sequencing approaches have evolved (Islam et al., 2011; Kim et al.,
2019; Kivioja et al., 2012; Macosko et al., 2015; Picelli et al., 2013, 2014; Ramsköld et
al., 2012; Sharma et al., 2020).
Most single-cell RNA-sequencing methods, including SMART-seq, begin with the
first-strand synthesis of cDNA by reverse transcription of polyadenylated transcripts via
transcripts enriches for pre-mRNA, mRNA, and lncRNA while avoiding ribosomal RNA,
which accounts for the vast majority of cytoplasmic RNA mass and would otherwise
saturate library pools (Moore and Proudfoot, 2009; Slomovic, 2006; Yang et al., 2011).
In SMART-based methods, second-strand synthesis is achieved by leveraging the
transferase and strand-switching activity of Moloney Murine Leukemia Virus (MMLV)
reverse transcriptase (Ramsköld et al., 2012; Zhu et al., 2001). During first-strand
synthesis, the terminal transferase activity of MMLV reverse transcriptase adds a
non-templated extension of cytosine nucleotides to the 3′ of the first strand. Second-strand
synthesis uses this cytosine extension as a priming site to create an extended template
with PCR adaptor sequences. MMLV reverse transcriptase then switches templates and
completes transcription to generate full-length cDNA molecules containing full 5’ regions
and adaptor sequences. Following second-strand synthesis, molecules are purified and
amplified via conventional high-fidelity PCR (Brandariz-Fontes et al., 2015; Filges et al.,
2019). Prior to sequencing, amplified library pools are fragmented and tagged with the
appropriate sequencing adaptors following standard protocols for next-generation
sequencing library construction.
Computational biology of single-cell RNA-sequencing
Single-cell RNA-sequencing experiments yield complex datasets produced by
the highly-multiplexed amplification of faint signals that are often near the quantitative
limit of detection. Such datasets are usually comprised of millions or billions of
sequencing sampling events, and these events must be faithfully distilled into
meaningful, consistent, and biologically-reliable observations. Generalized single-cell
events, normalization across cells to correct for technical artifacts, clustering of cells on
reduced gene expression components, and feature identification across clusters.
Normalization, artifacts, collisions, and quality
Preprocessing and quality control of high-throughput single-cell RNA-sequencing
data is an essential step in transforming sequencing observations to
biologically-meaningful information. Given the high-sensitivity of next-generation sequencing
technologies and the enormous number of total observations, variation in experimental
and technical factors has the inclination to generate confounding effects that mask true
biological variability. Importantly, observed differences in depth of sequencing and
molecules detected across cell-types can influence the quality of unsupervised
downstream analyses (Vallejos et al., 2017). These variations are tied to the inherent
sparsity of single-cell datasets, where stochastic detection, zero-inflation of values, and
saturation with abundant reads amplifies the effects of technical noise and masks rare
sampling events (Kharchenko et al., 2014; L. Lun et al., 2016; Pierson and Yau, 2015;
Vallejos et al., 2017). Consequently, normalization of single-cell RNA-sequencing
datasets represents a critical step in controlling for noise and artifacts that may mask
true biological signals (Bacher and Kendziorski, 2016; Bacher et al., 2017; Brennecke et
al., 2013; Kharchenko et al., 2014).
In the rapid escalation of single-cell RNA-sequencing applications, data
normalization strategies initially relied on methods originally developed for bulk
RNA-sequencing datasets in which scaling factors are calculated globally across the entire
dataset (Leek et al., 2012; Macosko et al., 2015; Vallejos et al., 2017). However, given
to normalize datasets without regressing out true biological variability between cells
have been developed. These methods either seek to adjust molecule counts according
to estimated scaling factors for individual cells (Vallejos et al., 2015, 2017) or to model
signal and dropout events probabilistically for regression (Kharchenko et al., 2014).
Typically, these models applied to single-cell RNA-sequencing data assume either a
negative binomial or zero-inflated distribution for normalization.
Prior to data normalization, preprocessing steps for single-cell RNA-sequencing
data includes the removal of low-quality cells. In general, cells containing a low
abundance of unique counts or features are removed using a subjective threshold.
Further, cells containing a high percentage of reads originating from the mitochondrial
genome are removed, as these are thought to be enriched in distressed cells (Galluzzi
et al., 2012; Ilicic et al., 2016).
In addition to the removal of low-quality cells, single-cell RNA-sequencing data
quality can also be improved in preprocessing by the removal of doublet or collision
events. These events occur when more than one cell receives the same cellular
barcode, such as by occupying the same droplet during microfluidic-based single-cell
RNA-sequencing protocols. In general, algorithmic doublet removal strategies generally
seek to identify these cells by automatically clustering the cells at cell-type resolution
and subsequently classifying these cells against a pool of predicted stereotyped
doublets (DePasquale et al., 2019; Gayoso and Shor, 2019; Wolock et al., 2019).
Therefore, cells containing transcriptional features representative of more than one
cell-type are predicted to be artefactual combinations of more than one cell. Notably, such
one cell-type. However, both heterotypic and homotypic doublets can be identified by
performing sample indexing of cell pools at the bench prior to loading into the single-cell
RNA-sequencing protocol (McGinnis et al., 2019; Stoeckius et al., 2017).
Clustering
An initial goal in the analysis of most single-cell RNA-sequencing datasets is the
classification of cells according to transcriptional similarity. Nevertheless, clustering cells
is inherently complicated by the high dimensionality of single-cell transcriptome data
and the sparsity of observations. To overcome this, correlated gene expression
dimensions are reduced by principal components analysis (PCA) prior to clustering in
most single-cell RNA-sequencing analysis pipelines (Macosko et al., 2015; Shalek et
al., 2014). After PCA, clustering is typically performed on a shared nearest-neighbor
graph calculated either on principal components or in gene expression space (Shekhar
et al., 2016). This graph is then used as the input for clustering approaches, the most
widely used of which is the Louvain community detection algorithm (Kiselev et al., 2019;
Macosko et al., 2015; Shekhar et al., 2016).
To visualize cells, a second round of dimensionality reduction is applied on a
subset of retained principal components that explain a substantial amount of the total
variance in the data. This reduction is performed using nonlinear transformations, which
allow for better visualization of the data (Kiselev et al., 2019). The most commonly used
reduction and visualization methods are t-distributed stochastic neighbor embedding
(t-SNE) (Maaten and Hinton, 2008) or Uniform Manifold Approximation and Projection
information in the distances and densities between cells, UMAP allows for the
visualization of relationships across cells projected onto the same space.
Inference of cell-state dynamics
Another goal of single-cell RNA-sequencing experiments is often the examination
of cell-state changes either during lineage specification or in response to a chronic
perturbation (Loo et al., 2019; Qiu et al., 2017; Rossi et al., 2019; Sharma et al., 2020).
Roughly, these methods seek to identify transcriptional trajectories across populations
of cells either by ordering cells according to transcriptional similarity (Qiu et al., 2017;
Trapnell et al., 2014) or by determining the direction of gene expression changes by
comparing genewise abundances of nascent and mature transcripts to assign weighted
transcriptional vectors across cells (La Manno et al., 2018). Using these methods,
critical mechanistic regulators of developmental or allostatic states can be identified by
examining endpoints and nodes in cellular trajectories.
Applications in Neural Systems
Single-cell RNA-sequencing provides a novel set of approaches to address
common challenges in systems neuroscience. For example, by examining differential
gene expression across molecularly-defined cell-types, transcriptomic signatures of
acute and chronic experimental manipulations can be identified within specific neuronal
cell-types (Avey et al., 2018; Ocasio et al., 2019; Rossi et al., 2019). Furthermore,
neuronal subpopulations activated by an acute stimulus can be identified by examining
immediate-early gene expression across neuronal subtypes (Hashikawa et al., 2020;
Hrvatin et al., 2018; Kim et al., 2019; Wu et al., 2017), and neuronal projection
distribution of virally-encoded sequences across neuronal subtypes at the projection
source (Kebschull et al., 2016). Thus, in systems neuroscience, at minimum, single-cell
RNA-sequencing can be leveraged to identify precise transcriptionally-defined neuronal
subtypes within brain regions of interest, describe which subtypes serve as functional
substrates during experimental conditions, and to distinguish specific projection
populations within heterogeneous brain regions. These methods are poised to become
a routine part of the circuit neuroscientist’s toolkit in a manner that will dramatically aid
CHAPTER 3. REMODELING OF THE LATERAL HYPOTHALAMIC AREA TRANSCRIPTIONAL LANDSCAPE IN OBESITY4
Introduction
Obesity affects more than 500 million adults worldwide (Finucane et al., 2011), and
its comorbidities present a pressing medical challenge (Flegal et al., 2004; Kopelman,
2000) that causes a staggering economic burden (Finkelstein et al., 2005). Despite its
increasing prevalence and the consensus that the brain regulates food intake and energy
homeostasis (Flegal et al., 2016), the neural adaptations governing obesity are unknown.
The lateral hypothalamic area (LHA) is a well-conserved brain region that orchestrates
feeding, energy homeostasis, and reward-related behaviors in mammals (Anand et al.,
1955; Hoebel and Teitelbaum, 1962; Jennings et al., 2013; Margules and Olds, 1962;
Woods, 1998). The LHA is highly molecularly diverse (Mickelsen et al., 2019; Stuber and
Wise, 2016) and synaptically connected with wide-ranging subcortical brain regions that
are critical for fear and anxiety, aversion, and reward (Nieh et al., 2015, 2016; Rossi and
Stuber, 2018; Stamatakis et al., 2016). Until recently, no consensus has existed regarding
the molecular heterogeneity of LHA cell-types. LHA glutamatergic neurons, expressing
vesicular glutamate transporter type-2 (Vglut2; LHAVglut2), can influence food intake, body
weight, reward, and aversion (Stuber and Wise, 2016). Importantly, LHAVglut2 activation
4 Material within this chapter previously appeared in part in a paper published in the journal Science. The original
suppresses feeding (Jennings et al., 2013), and the integrity of LHAVglut2 cells is critical for
mitigating weight gain in response to caloric surfeit (Stamatakis et al., 2016).
Here, we apply high-throughput droplet-based single-cell RNA-sequencing
(Macosko et al., 2015) to track transcriptional changes occurring during obesity and
demonstrate that high fat diet (HFD) robustly modifies the transcriptional landscape of
LHAVglut2 neurons during obesity. We find that HFD-induced transcriptional events in
these neurons predict altered activity dynamics, and using longitudinal in vivo two-photon
calcium imaging, show that responses of LHAVglut2 neurons to rewards are greatly
attenuated over the course of weight gain on HFD. We further identify 15 unique subtypes
of LHAVglut2 neurons and characterize how these glutamatergic subpopulations are
differentially and uniquely impacted by HFD. We then leverage insights from single-cell
RNA-sequencing to selectively disrupt the neuropeptide Neurotensin within LHAVglut2
neurons using virally-delivered SaCas9, which subsequently mitigates weight gain and
caloric intake on HFD.
Collectively, these data demonstrate how diet alters the transcriptional landscape
of the LHA and disrupts the reward encoding properties of an endogenous brake on
feeding to promote over-eating and obesity. More generally, these data demonstrate how
physiologically-relevant pressures, such as dietary influences, can exert a widespread
influence on cell-state plasticity in neuronal substrates that govern associated behavioral
processes. This work also serves as proof-of-principle for how high-throughput single-cell
RNA-sequencing can be applied to identify specific candidate features for biological
Results
Drop-Seq Identifies Canonical Cell-Types in the Lateral Hypothalamic Area
To probe transcriptional changes within the LHAfollowing chronic HFD exposure,
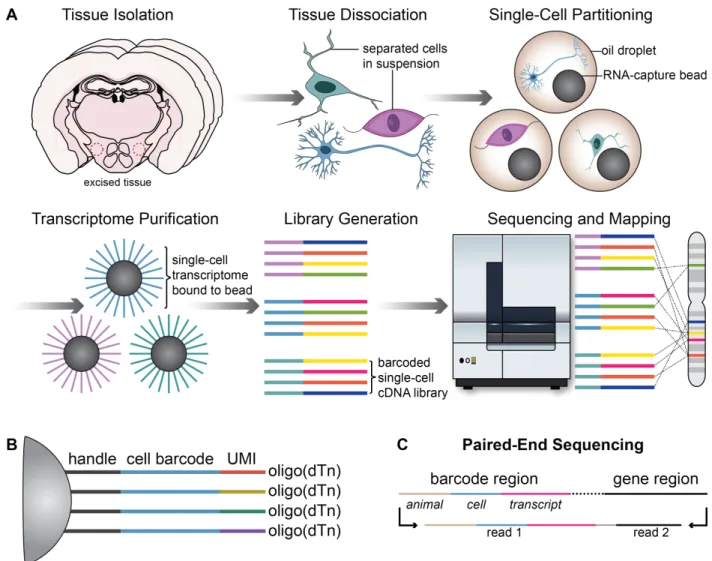
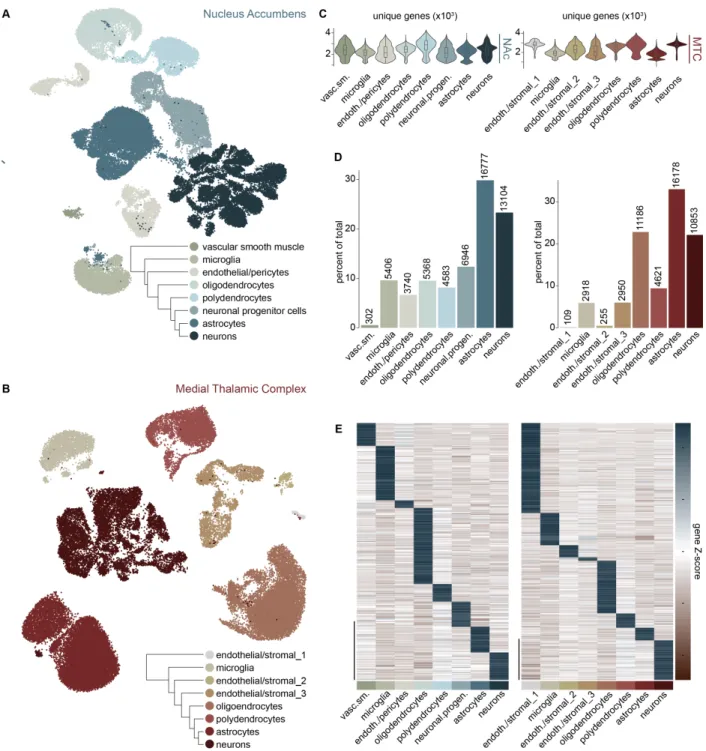
we used high-throughput microfluidic droplet-based single-cell RNA-sequencing ( Drop-Seq, Figure 1 and Figure 2) to transcriptionally profile 20,194 LHA cells in control and HFD mice (Figure 3A) to a median of 619 unique genes and 961 unique transcripts per cell. Cells were clustered based on highly variable gene expression using principal
component analysis. Dimensionality was reduced and the data were visualized by
clustering in t-SNE space (see Methods) (Maaten and Hinton, 2008). In agreement with
previous transcriptional characterizations of mouse brain regions (Gokce et al., 2016;
Hrvatin et al., 2018; Mickelsen et al., 2019; Wu et al., 2017), we identified
transcriptionally-distinct resident cell-types of LHA tissue including neuronal, glial, and stromal cell
classes, each expressing canonical markers for each cell-type (Figure 3C-D). We also observe previously-described functionally-distinct major subclasses LHA neurons
including a large population of GABAergic (Vgat) and glutamatergic (Vglut2) neurons, as
well as separate discrete populations expressing Orexin/Hypocretin (Hcrt) and
Pro-Melanin Concentrating Hormone (Pmch) (Figure 3C and 3E) (Aston-Jones et al., 2010; Bittencourt et al., 1992; Elias et al., 1998; Jego et al., 2013; de Lecea et al., 1998; Qu et
al., 1996). GABAergic and Glutamatergic cells exhibited similar proportional
representation between sequencing and fluorescent in situ hybridization (Figure 3F), suggesting that the droplet-based single-cell RNA-sequencing protocol and statistical
clustering approach maintained biologically-valid relative proportions of cell-types across
Transcriptional Tuning Across Lateral Hypothalamic Cell-Types During Obesity
Obesity is a multifaceted physiological perturbation with metabolic, hormonal,
immune, and behavioral features (Kahn and Flier, 2000; McLaughlin et al., 2017; Uranga
and Keller, 2019). As such, obesity presents unpredictable heterogeneous pressures on
the neural systems regulating food intake and energy balance. Consistent with the
complex and distributed nature of chronic HFD exposure, we found that all resident cell
classes of the LHA display distinctive, non-overlapping patterns of transcriptional
modification following chronic HFD (Figure 4A-B). However, of all cell-types, glutamatergic neurons, expressing Vesicular Glutamate Transporter Type-2 (Vglut2
(Slc17a6); LHAVglut2), exhibited significant changes in the greatest degree and proportion
of genes across all LHA cell-types (Figure 4A-D). Of the major neuronal populations, LHAVglut2 neurons also exhibited the most statistically significant distribution of
HFD-induced alterations in gene expression (Figure 4C). Consistently, LHAVglut2 neurons also
contained the most significant gene-level genetic association with human body mass
index (BMI) (Figure 4E), suggesting that similar alterations within LHAVglut2 neurons may
underlie human obesity. This agrees with previous reports in which diet alters
hypothalamic neurons involved in energy balance (Chen et al., 2017; Henry et al., 2015).
Together, these data suggest that LHAVglut2 neurons are especially responsive to
obesity-induced perturbations in transcriptional state.
To further understand the effect of HFD on LHAVglut2 gene expression programs,
we used LHAVglut2 cells to construct learned cell-state trajectories in which cells were
ordered according to degree of transcriptional change, represented in pseudotime (Qiu
pseudotimes and displayed pseudotime-dependent changes in gene expression
(Figure 4G), suggesting that a widespread gradient of allostatic changes occur within LHAVglut2 neurons during chronic HFD exposure. To identify features underlying these
changes, we tested genes differentially-expressed across the LHAVglut2 pseudotime
trajectory for enrichment across functional annotation classes and examined classes
relevant to neuronal activity and function. We found that LHAVglut2 cells exhibited
significant pseudotime-dependent alterations in annotations associated with neuronal
activity including ion homeostasis, synaptic activity, and intracellular signaling (Figure 4H and Figure 5) (Kuleshov et al., 2016).
Selective ablation of LHAVglut2 neurons potentiates the intake of calorically-dense
food (Stamatakis et al., 2016). Because LHAVglut2 neurons were particularly sensitive to
chronic HFD (Figure 4) and displayed significant changes in functional annotations classes associated with neuronal activity (Figure 4H), we sought to assess their natural activity dynamics during caloric reward consumption (Rossi et al., 2019). To test this, a
virus encoding the fluorescent calcium reporter GCaMP6m (Chen et al., 2013) under
the control of Cre (AAVdj-DIO-GCaMP6m) was infused into LHA of Vglut2-Cre mice. A
gradient refractive index (GRIN) lens was implanted ~150 µm above the injection site,
permitting optical access to LHAVglut2 neurons. Mice were maintained on either HFD or
control diet for 12 weeks (Figure 4I). While control LHAVglut2 neurons maintained their
responsivity to sucrose consumption, HFD LHAVglut2 neurons became progressively less
responsive to sucrose (Figure 4J-K). Thus, as suggested by the transcriptional changes observed via single-cell RNA-sequencing, LHAVglut2 neurons alter their food
Distinct Transcriptional Representations of Obesity in Lateral Hypothalamic Glutamate Neuron Subtypes
Based on known, partially-overlapping patterns of mRNA and protein expression
within the LHA (Gerashchenko and Shiromani, 2004; Rossi and Stuber, 2018; Stuber and
Wise, 2016), we hypothesized that the LHAVglut2 neuron population comprises distinct
subtypes of glutamatergic neurons that may be differentially impacted by HFD. To identify
subpopulations of LHAVglut2 cells, we isolated the cells from the Vglut2 cluster and
reclustered the cells using similar approaches to those used for the clustering of all LHA
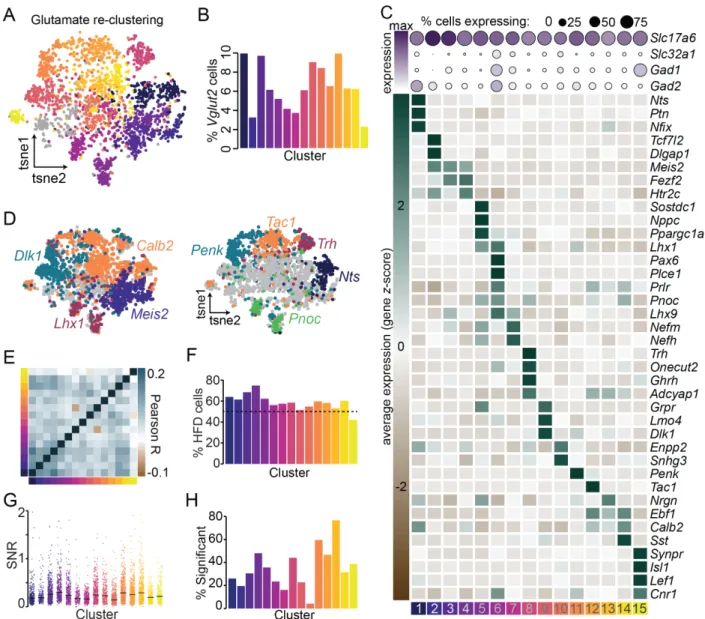
cell-types. We discovered 15 transcriptionally-distinct LHAVglut2 neuron subclasses
(Figure 6A-D). Across these, we identify the genes Dlk1, Calb2, Meis2, and Lhx1 as broad markers encompassing multiple LHA glutamatergic subclasses (Bedont et al.,
2014; Meister et al., 2013) (Figure 6D). As higher resolution, these broad glutamatergic subclasses are comprised of discrete subclasses that can largely be separated by unique,
non-overlapping expression of the neuropeptides Neurotensin (Nts), Thyrotropin
Releasing Hormone (Trh), Preprotachykinin-1 (Tac1), Proenkephalin (Penk), and
Prepronociceptin (Pnoc) (Figure 6C-D), suggesting that these subclasses of LHAVglut2
neurons may participate in more specialized neurocircuit functional activities.
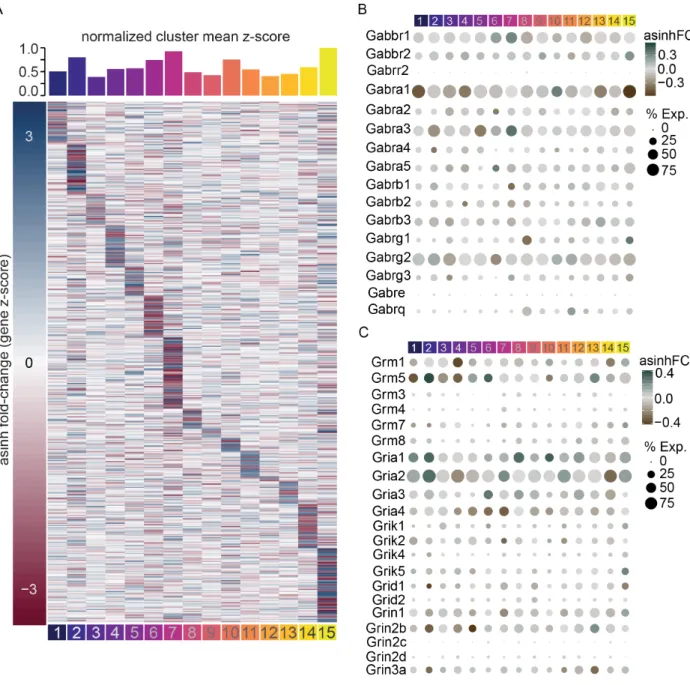
Considering the discrete distribution of features involved in gene regulation and
neuromodulation (Figure 6C) in LHAVglut2 subclasses, we hypothesized that these
subclasses of LHAVglut2 neurons would display differential transcriptional responses to
HFD. We compared intracluster gene expression changes following HFD and found that
each subtype of neurons exhibited significant variability in the proportion and magnitude
subcluster-specific changes were observed across critical modulators of neuronal activity, including
GABA and glutamate receptor subunits, neuropeptides, transcription factors, and
G-protein coupled receptors (Figure 7B-C and Figure 8), HFD and obesity may induce subcluster-specific reshaping of functional activity dynamics in the LHA.
Viral SaCas9-Mediated Mutation of Neurotensin in Lateral Hypothalamic Glutamate Neurons Attenuates HFD-Induced Weight Gain
We next sought to leverage the discrete transcriptional events observed within
LHAVglut2 subpopulations. We hypothesized that targeted functional manipulation of at
least one of these subclasses should modify the HFD phenotype. One of the largest
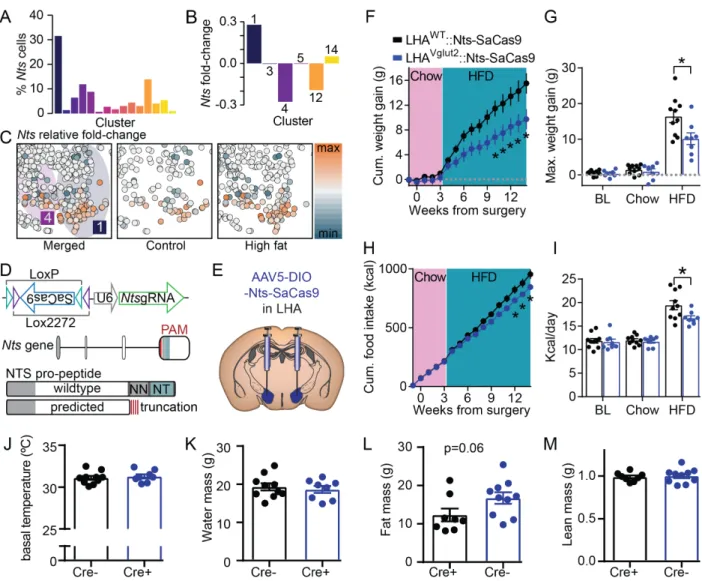
glutamatergic subclasses was marked by high expression of the neuropeptide Nts
(LHAVglut2∷Nts) (Figure 6B-D), which has been previously described in the hypothalamic
and systemic regulation of feeding behavior and obesity (Leinninger et al., 2011; Li et
al., 2016). We observed that HFD significantly upregulates Nts expression within the
LHAVglut2∷Nts cluster, as well as modifies the expression of Nts in other Nts-expressing
LHAVglut2 subtypes (Figure 9A-C).
We hypothesized that loss-of-function mutation of Nts in these populations would
modify obesity- or feeding-associated phenotypes. To test this, we designed a
Cre-inducible Staphylococcus aureus Cas9-based (SaCas9) (Friedland et al., 2015; Hunker
et al., 2020; Ran et al., 2015) viral vector strategy (AAV5-DIO-Nts-Cas9) to target the
Nts locus at its peptide-coding exon, which is predicted to produce a translation product
terminating in a frameshift truncation prior to its neuropeptide domain and result in
complete loss-of-function of Nts (Figure 9D). Injecting AAV5-DIO-Nts-Cas9 into the LHA of Vglut2-Cre+ mice did not affect food intake or body weight on a standard chow
controls (Figure 9F-I). Viral SaCas9-mediated mutation of Nts in LHAVglut2 neurons did
not affect body temperature, water mass, or lean mass (Figure 9J-K, M). These results are consistent with homozygous Nts deletions (Li et al., 2016), suggesting that this
small population of LHAVglut2 neurons is sufficient to coordinate some of the peripheral
Nts-dependent responses to HFD. Importantly, the phenotype induced by SaCas9
mutation of Nts opposes the effect of viral ablation of LHAVglut2 neurons (Stamatakis et
al., 2016), suggesting that the effect is specifically driven by Nts signaling by these
neurons rather than reduced survivability secondary to infection with the SaCas9 virus.
Discussion
While obesity represents a strong systemic pressure on cellular physiology
throughout the body (Kahn and Flier, 2000; McLaughlin et al., 2017; Uranga and Keller,
2019), the influence of obesity on brain transcriptional states at cellular resolution has
not been previously described. Here, we show that LHA substrates are transcriptionally
modified by chronic HFD, and that these changes occur in a highly cell-type-specific
manner, with distinct transcriptional representations of obesity occurring across resident
tissue cell-types and neuronal subtypes. By prioritizing these cell-types on multiple
metrics of differential gene expression, we identify LHAVglut2 neurons as uniquely
responsive to HFD manipulation and use transcriptional features to predict altered
activity dynamics in these neurons in response to caloric reward. We further
characterize LHAVglut2 neurons and identify molecularly-defined subtypes of glutamate
neurons in the LHA and show that cell-type-specific manipulation of a gene that is
differentially-expressed during obesity in these neurons (Nts) can attenuate
Because LHAVglut2 activity is known to directly influence feeding (Jennings et al.,
2013) and the integrity of these cells is critical for weight gain in response to HFD
(Stamatakis et al., 2016), we hypothesize that the excitatory LHAVglut2 signal represents
the activation of a brake on feeding, which suppresses food intake. In accordance with
this idea, we demonstrate for the first time that chronic HFD exposure dramatically
alters the transcriptional profile of LHAVglut2 neurons and ultimately hinders the activity
dynamics and reward encoding properties of these cells, thereby weakening an
endogenous brake on feeding to promote over-eating and obesity. Consistent with the
observation that anorexigenic signals are often negatively valenced (Rossi and Stuber,
2018), mice avoid LHAVglut2 activation (Jennings et al., 2013; Nieh et al., 2016).
Together, these results indicate that LHAVglut2 neurons are powerful negative regulators
of motivated feeding whose natural function, activity dynamics, and transcriptional
landscape are uniquely degraded during diet-induced obesity. As such, this
anatomically and molecularly restricted group of cells represents a novel therapeutic
target for the treatment of obesity and psychiatric eating disorders.
Although this analysis focuses on glutamatergic neurons, this dataset provides a
rich resource for identifying biologically meaningful transcriptional alterations across
additional LHA neuronal, glial, and stromal cell-types in response to HFD. In addition to
regulating consummatory behavior for food during obesity, LHAVglut2 cells also contribute
to aversion (Jennings et al., 2013; Lazaridis, 2019; Nieh et al., 2016; Trusel, 2019), but
it remains unclear whether these two populations are segregated. Future studies could
leverage this dataset to develop molecular and transgenic tools to manipulate more
Notably, these experiments also show that cell-state responses to external
pressures are inherently tied to cell-type definitions. Although, in some cases, this is
obvious—such as amongst different cell-type lineages intermixed within a tissue—we
find that this holds true even at high cellular molecular resolution. That is, even amongst
cell-types that have been historically considered to be relatively similar such, as
subclasses of excitatory neurons within an anatomically-defined brain subregion (LHA),
we observe distinct, non-overlapping patterns of transcriptional modification in response
to an exogenous pressure (HFD). These distinct transcriptional representations are
observed even between cell-types that are more specifically-defined, such as within the
broader subclasses of LHAVglut2 neurons. Given the multifaceted nature of HFD and
obesity, as well as the circuit level complexity of neuronal systems, the distinct patterns
of gene expression observed amongst similar cell-types in the brain may be tied to
either inherent differences in the character of their responses to the same exogenous
signals, cell-type encoded abilities in their capacity to respond to different
obesity-associated signals, circuit-level electrophysiological influences independent of
exogenous signals that drive differential gene expression patterns, or more likely, a
combination of all three scenarios. To investigate this, future work should aim to
examine the contribution of discrete, well-defined pressures on functionally and
anatomically-restricted neuronal systems, such as modulation of downstream or
upstream circuit activities, or through the actions of ligands specific for neuronal
Methods
Tissue Isolation and Drop-Seq
Male C57BL/6J mice 8 weeks old at the start of diet manipulation were
maintained on either control or high fat diet for 9-16 weeks (n = 7/group). Mice were
deeply anesthetized with 390 g/kg sodium pentobarbital, 500 mg/kg phenytoin sodium
and rapidly transcardially perfused with 20 mL ice-cold sodium-substituted aCSF
(NMDG-aCSF) containing 96 mM N-methyl-D-glucamine (NMDG), 2.5 mM KCl, 1.35
mM NaH2PO4, 30 mM NaHCO3, 20 mM HEPES, 25 mM glucose, 2 mM thiourea, 5 mM
Na+ascorbate, 3 mM Na+pyruvate, 0.6 mM glutathione-ethyl-ester, 2 mM
N-acetyl-cysteine, 0.5 mM CaCl2, 10 mM MgSO4, and adjusted to pH 7.35–7.40, 300-305 mOsm
(Rossi et al., 2019; Ting et al., 2014). Brains were isolated and six 280 μm sections
through the LHA were collected in ice-cold NMDG-aCSF on a Leica VT1200 vibratome. Sections were allowed to recover in carbogen-buffered NMDG-aCSF containing 500 nM
TTX, 10 μM APV, 10 μM DNQX (NMDG-aCSF-R) to reduce excitotoxicity activity at
room temperature for 40 minutes. After recovery, LHA tissue was isolated with Palkovitz
punches and incubated in NMDG-aCSF-R containing 1.0 mg/mL pronase for 35
minutes at 30ºC. Following digestion, tissue was transferred to 1.0 mL NMDG-aCSF-R
supplemented with 0.05% bovine serum albumen (NMDG-aCSF-BSA) and
mechanically dissociated with a borosilicate patch pipet fire-polished to an internal
diameter of 200-300 μm. The suspension was washed in 12 mL NMDG-aCSF-BSA,
sedimented at 220 x g for 6 minutes at 18ºC, and immediately resuspended at a final
Drop-Seq was performed as originally described,with minor modifications
(Macosko et al., 2015). Briefly, cells were loaded Single-cell capture was performed on
a glass microfluidics device (Dolomite Microfluidics, Royston, UK) with flow rates for set
to manufacturer recommendations. Beads were loaded at a concentration of 390
beads/μL. Reverse transcription, exonuclease I digestion, and PCR were performed as
in (Macosko et al., 2015) with one additional cycle added to the second stage of
amplification. Following PCR, products were pooled by animal, purified on SPRI beads
(Agilent) at ratios described in (Macosko et al., 2015), and indexed following Nextera XT
Tagmentation instructions with 750 pg input per reaction. Tagmentation products were
double purified on solid-phase reversible immobilization (SPRI) beads using a
negative/positive selection strategy to retain species between 300-600 bp, as quantified
with an Agilent Bioanalyzer 2100 High Sensitivity DNA assay. Final libraries were
pooled by mass proportional to the estimated number of cells per pool member as
quantified by a Qubit dsDNA High Sensitivity Assay. Sequencing was performed at the
University of North Carolina at Chapel Hill High Throughput Sequencing Facility on an
lllumina HiSeq2500 using Paired-End 2x50 Rapid Run v2 chemistry.
Single-Cell RNA-Sequencing Clustering and Analysis
Demultiplexing was performed with 1 mismatch allowed using Illumina bcl2fastq
v2.18.0.12. Initial processing and generation of digital expression matrices was
performed using Drop-Seq _tools v1.12 and Picard Tools v2.2.4 as described in
(Macosko et al., 2015). Alignment was performed using STAR v2.4.2a with 72 GB of
Clustering was performed using a combination of Seurat v1.4.0.16 and custom
code in R v3.3.2 unless otherwise noted. For clustering of all cells (Figure 2-3), cells were filtered by ≤ 5,000 and ≥ 200 unique genes, ≤ 15,000 unique molecules, and ≤ 10
percent mitochondrial reads; for re-clustering of glutamatergic neurons (Figures 4-8), cells in the glutamate cluster were filtered by ≤ 5,000 and ≥ 500 unique genes, ≤ 15,000
unique molecules, and ≤ 5 percent mitochondrial reads. Filtered data were scaled to the
median number of unique molecules and log(x+1) transformed. Zero-variance genes
were removed from the data, and batch correction was performed with ComBat from the
SVA v3.220 package using parametric adjustments on a model matrix containing
sequencing pool, total number of unique genes and molecules, and percent
mitochondrial reads (Johnson et al., 2007; Leek et al., 2012) (Figure 2C-E). Batches for clustering of all cells and for glutamate re-clustering were defined as described. Relative
log expression by cell and mean expression correlation across animals were used to
assess correction quality (Figure 2). Only genes detected in all animals by group were included in downstream analysis.
Highly variable genes were selected as described in (Brennecke et al., 2013)
using an implementation in the package M3Drop v1.0.0 (Andrews and Hemberg, 2019)
with a false discovery rate of 0.01 and a minimum dispersion of 0.5. These genes were
used as the basis for principal components analysis. Cluster calling was performed on
principal components using the Louvain algorithm with multilevel refinement (Rodriguez
and Laio, 2014; Rotta and Noack, 2011; Šubelj and Bajec, 2011) and default settings.
Principal components were reduced and visualized via t-SNE using the first 100
resolution of 2.5 (Figures 4-8) under default settings (Maaten and Hinton, 2008).
Clusters were reordered based on a dendrogram estimated on a hierarchically-clustered
distance matrix constructed on all genes (Figures 2-3) or highly variable genes (Figures 4-8). For glutamate re-clustering the confidence of dendrogram splits was assessed using the out-of-bag error for a random forest classifier trained on all internal
nodes. For glutamate re-clustering, children of one node with an out-of-bag error
outside of Tukey’s upper limit were merged. One non-glutamatergic cluster and one
cluster with < 50 cells were ignored from subsequent analyses (Figure 6A,gray). Feature discovery was performed using a likelihood-ratio test for single-cell data
as implemented in Seurat (Macosko et al., 2015; McDavid et al., 2013). For cluster
features, all genes in each cluster were tested against those in either the nearest cluster
or node in the dendrogram tree. For group features, intra-cluster group comparisons
were performed using the same test. In the clustering of all cells, one neuronal cluster
comprising 3.72% of all neurons lacked high confidence markers and was not further
analyzed (Figure 3C, gray). Comparisons of gene expression levels between groups were performed on inverse hyperbolic sine (asinh) transformed data (Amir et al., 2013;
Hoffman et al., 2012; Rossi et al., 2019).
For gene x; asinh fold-change (asinhFC) was defined as:
Signal-to-noise ratio (Figure 4A and Figure 6G) was defined as: asinhFC = ln x⎛ HF + xHF 2+1
⎝⎜ ⎞⎠⎟ − ln xC + xC
2
+1 ⎛
⎝⎜ ⎞⎠⎟
SNR = asinh x
( )
Cσ
asinh XHF
All steps from prepossessing to the generation of digital expression matrices
were run on a Dell blade-based cluster running RedHat Enterprise Linux 5.6. Cluster
calling and t-SNE were run on a similar cluster running RedHat Enterprise Linux 7.3. All
other steps were performed on an Apple MacBook Pro running macOS 10.13.3.
Functional Annotations and Pseudotime Analysis
Differentially-expressed genes (DEGs) with p ≤ 0.001 were used as input for
gene-set analysis (Figure 4H). Gene-set analysis was performed using the online tool ENRICHr (http://amp.pharm.mssm.edu/Enrichr/) (Golden et al., 2017; Hoffman et al.,
2012). Adjusted p-values from ENRICHr were used to select significant terms from the
following annotation databases: a, GO_Biological_Process_2018, s,
GO_Cellular_Component_2018, u, GO_Molecular_Function_2018, x, KEGG_2016, r,
Panther_2016, µ, Reactome_2016.
Pseudotime analysis was performed using Monocle v2.2.0 (Qiu et al., 2017;
Trapnell et al., 2014) (Figure 4F-G and Figure 5). Briefly, cells from the glutamate cluster were selected and filtered for cells containing ≤ 5,000 and ≥ 500 unique genes, ≤
15,000 unique molecules, and ≤ 5 percent mitochondrial reads. Raw counts were fitted
to a negative binomial distribution with fixed variance and size factors for individual cells
were estimated using a mean-geometric-mean-total calculation. DEGs between control
and HFD were estimated on a dispersion model and those with q ≤ 0.01 and detected in
at least 10% of cells were used for pseudotime ordering. Trajectories were constructed
Single-Cell GWAS Association
We used MAGMA (v1.06) as previously described to identify cell-types
associated with BMI (Coleman et al., 2019; de Leeuw et al., 2015; Skene et al., 2018).
The GWAS on BMI was a cross-sectional analysis of 353,972 European participants
from the UK Biobank. Body composition was assessed using Tanita BC-418 MA scale
(Tanita Corporation, Arlington Height, IL). We included 7,794,483 genotyped and
imputed SNPs and insertion-deletion variants with a minor allele frequency of 1%
(referred to as SNPs). We excluded pregnant participants or females after hysterectomy
and covaried for factors related to assessment center, genotyping batch, smoking
status, alcohol consumption, menopause, and for continuous measures of age, and
socioeconomic status (measured by the Townsend Deprivation Index) (Townsend,
1987). We accounted for underlying population stratification by including the first six
ancestry PCs, calculated on the European subsample. We used BGENIE v1.2
(https://jmarchini.org/bgenie) for specific analyses and meta-analyzed these
sex-specific GWASs using METAL (Bycroft et al., 2018; Willer et al., 2010)
(http://csg.sph.umich.edu/abecasis/metal).
Linkage disequilibrium (LD) score regression (Bulik-Sullivan, 2015) estimated
SNP-h2 for BMI was 21.9% (SE = 0.7%), the intercept 1.09 (SE = 0.01), and the
attenuation ratio 0.06 (SE = 0.01), indicating a polygenic trait. Significantly associated
SNPs (p <5 x 10⁻⁸)were considered as potential index SNPs. SNPs in LD (r2> 0.2) with
a more strongly associated SNP within 3000 kb were assigned to the same locus using