Research Article
a
August
2017
Computer Science and Software Engineering
ISSN: 2277-128X (Volume-7, Issue-8)
A Research on Mammograms Classification using Wavelets
Aaina, Amardeep Kaur
Punjabi University Regional Centre, Mohali, Punjab, India
DOI: 10.23956/ijarcsse/V7I8/0166
Abstract— To cope with the distinct typeof deformity causing cancer, there are number of techniques which help in identifying tumor. Some of the various techniques are: Mammography, Ultrasound, MRI, and so on. Recently, Electrical impedance and nuclear medicine are used universally for investigation. These techniques are based on the picture processing i.e. identifying the anomaly which is done through the reading and retrieving data from photos. Although this research depends on mammogram photographs. Before recovering information one should be aware about all types of anomalies such as: micro-classification, masses, structural distortion, asymmetry, bosom density and so on. Moreover, after the process of obtaining the irregular part or can say that ROI (Region of Interest) on which the therapy is applied.The GLCM feature is used to extract the features and wavelets are used for compressing the image that helps in finding the abnormal part in the image which will not be compressed.
Keywords— Image Compression, Lossless compression, Near Lossless compression
I. INTRODUCTION
Mammography is a particular kind of bosom screening process that uses low-energy X-rays to identify the cancer in bosom which is also known as mastography. Characteristic masses or micro-classification are the processes which help to analyze the bosom cancer in its early stage[1].
Bosom tumor is very common tumoramong women globally. One in eight women experience bosom cancer once in their lifetime [2]. Mammography is used to diagnose the cancer in breast of women [3]. Early identification of breast cancer is very important for proper treatment of the tumor which is due to bad contrast and less visibility in the mammographic pictures. Enhanced algorithms of computer-aided diagnosis help the specialists to accurately detect the disease[1].
For cancer detection neural network is used widely in these days like back propagation neural network, radial basis function neural network and so on.
M. Pratiwi, Alexander, J. Harefa, and S. Nanda[1]: uses the radial basis function neural network for characterization of mammograms in context of texture based elements. These texture based elements are extracted using gray level co-occurance matrix (GLCM).
K. A. M. Junaid[4]: uses the back propagation neural network for identification of different types of tumor like cancerous or benignant. This algorithm helps in training the neural network to do work properly in finding the tumor.
S. Naranje[2]: explains how artificial neural network helps in making decision for identifiying breast tumor.
Many of the researchers uses computer aided diagnosis process for reading the pictures accurately as compared to humans.
On the basis of previous researches, this paper uses the GLCM feature to extract the features and wavelets are used with the RBFNN which helps in finding the abnormal part in the photographs.
In this paper the first section describe about the general introduction of bosom tumor identification. In the 2nd section the Computer Aided Diagnosis (CAD) is described how it helps the experts in detecting the tumor. The 3rd section is about the GLCM features with RBFNN which are used to extract the features. The 4th section explains about the Wavelets with RBFNN. The 5thsection explains about the general steps for cancer detection. The 6th section tells about the materials and methods used for the identification of the cancer. 7th section explains about the initial parameters. 8th section explains about the performance metrics. Section 9th explains about the results and discussion. Finally, the10th section gives the conclusion and future scope.
II. COMPUTER AIDED DIAGNOSIS
Computer Aided Diagnosis (CAD) is a process that helps the doctors in analyzing the medicinal pictures. Screening strategies like X-ray, MRI, and Ultrasound diagnosis give a huge amount of information that the surgeons or other specialists has to examine and to estimate about the diseasein a very less time[1]. Advanced technology pictures are used in CAD to highlight the observable segments where the disease is present; this helps the doctors to take a suitable decision by which they can cure the disease.
ISSN(E): 2277-128X, ISSN(P): 2277-6451, DOI: 10.23956/ijarcsse/V7I8/0166, pp. 296-300
III. GLCM FEATURES WITH RBFNN
There are two important aspects of feature selection, first one is to decrease the redundancy of the extracted features and second one is to increase the relevance of the selected features[5]. The researchers use this for dimensionality reduction and feature minimization for various kinds of learning, improving diagnosis efficiency and increasing the directness of the process. The classification process highly depends on the with selection, which selects a subset of highly relevant features from the extracted original feature set[1]. It may happen that feature extraction process may create new features which are based on the combinations or transformations of the original features set, and then those features are also used for features selection process. Along with the feature detection using GLCM another strategy is used for image operation which is known as Wavelet with RBFNN. Using wavelet technique the image is analysed and transformation operations are applied.
IV. WAVELET WITH RBFNN
Recently, wavelets are very popular technique to examine the pictures and from these pictures give the information about the shape and texture[6]. The Daubechies wavelet transform take input of neural network as coefficients and color moment’s [7]. These color moment have already been used in number of color based picture classification system, especially when the picture contain only the objects.
V. CANCER DETECTION STEPS
Image Acquisition: The first step starts with taking a number of mammogram pictures from the Database. Photographs are then stored in MATLAB and displayed as a gray scale picture. The advantage of the computer tomography picture is having good clarity, less noise and distortion[8].
Image pre-processing:All the photographs undergo number of pre-processing steps such as noise removal and enhancement.
Noise Removal: Picture de-noising algorithms is used in image processing. The input picture is a normal colored picture i.e. RGB picture. The RGB photo is converted into grey scale picture because MATLAB does not support the RGB format. Then the grey scale image contains noises such as white noise, salt and pepper noise and so on.
Image Enhancement: Image enhancement is the process to improve the picture quality, so that the picture that comes out as the resultant picture is better than the original one[5].
Image Segmentation:In computer vision, segmentation is the process of dividing a digital picture into number of segments (sets of pixels, also called super pixels).Image segmentation is done to identify the objects and boundaries (lines, curves, etc.) in photographs[9].
Features Extraction: The features Extraction step is very necessary in working with picture processing techniques which uses algorithms and techniques to identify and isolate various portions or shapes (features) of a picture. After the segmentation is completed on breast region, the features can be obtained from it and the diagnosis rule can be designed to exactly identify the cancer nodules in the breast[10].
VI. MATERIALSANDMETHODS
Materials: The data set used in this study for reading MRI images of mammograms is taken from the MIAS database (http://peipa.essex.ac.uk/info/mias.html). Pictures used for breast cancer identification are ofsize 256*256 pixel. The total number of pictures taken is 165 out of which 100 pictures are used for testing which helps in finding the cancer in the image and rest 65 pictures are used for training.
ISSN(E): 2277-128X, ISSN(P): 2277-6451, DOI: 10.23956/ijarcsse/V7I8/0166, pp. 296-300
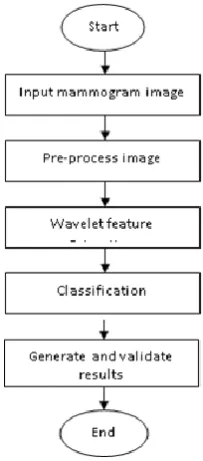
The new approach is implemented which is described using the following steps:
Step 1: Input MRI Image: In this phase the mammogram picture is uploaded into the algorithm.
Step 2: Pre-Processing: This phase consists of two steps
Conversion of RGB2Gray scale image: In this the uploaded colored image i.e. RGB picture is converted into gray scale image.
Noise removal process: After the conversion of colored picture into gray scale, de-noising is done using median filter. Noise can be of many types like salt and pepper noise, Gaussian noise, and periodic noise and so on.
Step 3: Wavelet features: In this step, the photograph is segmented using hybrid clustering technique and region of interest is calculated.
Step 4: Classification: This phase consists of two steps:
Tumor Detection: In this the sobel operator is used to identify the edges and to localize the picture.
Tumor Area Detection using hybrid clustering: In this tumor is identified using hybrid clustering but edge is not very accurately defined.
Step 5: Finally, results are generated.
VII. INITIAL PARAMETERS
True Positive: In the true positive, the person is actually having tumor and the prediction made also shows that there is tumor.
True Negative: In the true negative, the person is actually not having tumor and the prediction made also shows that there is no tumor.
False Positive: In the false positive, the person is actually not having any tumor but the prediction made gives the result as there is tumor.
False Negative: In the false negative, the person is actually not having any tumor and the prediction made also show that there is no tumor.
VIII. PERFORMANCE METRICS
The performance metrics used in the study are given below:
1) Accuracy: Accuracy is how close a measurement is to the correct value for that measurement.
(1)
2) Sensitivity: measures the proportion of positives that are correctly identified.
Sensitivity= TP/ (TP+FN) (2)
3) Specificity (also called the true negative rate) measures the proportion of negatives that are correctly identified.
Sensitivity = TN / (TN+FP) (3)
IX. RESULTS AND DISCUSSION Results
ISSN(E): 2277-128X, ISSN(P): 2277-6451, DOI: 10.23956/ijarcsse/V7I8/0166, pp. 296-300
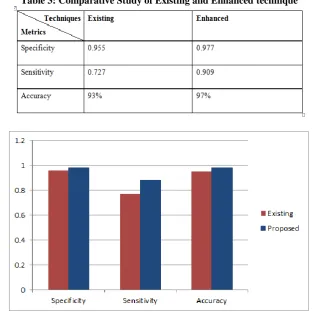
Table 3: Comparative Study of Existing and Enhanced technique
Fig 2: Comparative Study for Existing and Proposed
Discussion
This work was conducted to get the higher accuracy using RBFNN and wavelets. Three performance metrics were used; those were accuracy, specificity and sensitivity. The GLCM feature extraction was used to extract the features. In the existing work few GLCM features were used where as in the enhanced technique more GLCM features are used to extract the features. The more feature extraction increases the range of GLCM feature extraction and hence results in higher accuracy. The Figure 2 shows that enhanced technique is better than the existing. The enhanced technique shows accuracy 97% which is more as compared to the existing technique.
X. CONCLUSION
ISSN(E): 2277-128X, ISSN(P): 2277-6451, DOI: 10.23956/ijarcsse/V7I8/0166, pp. 296-300
[6] A. S. Al-Fahoum and I. Howitt, “Combined wavelet transformation and radial basis neural networks for classifying life-threatening cardiac arrhythmias,” Med. Biol. Eng. Comput., vol. 37, pp. 566–573, 1999.
[7] S. Mandal and I. Banerjee, “Cancer Classification Using Neural Network,” Int. J. Emerg. Eng. Res. Technol., vol. 3, no. 7, pp. 172–178, 2015.
[8] T. Kanimozhi and A. Murthi, “Computer Aided Melanoma Skin Cancer Detection Using Artificial Neural
Network Classifier,” Singaporean J. Sci. Res. J. Sel. Areas Microelectron., vol. 8, no. 2, pp. 35–42, 2016. [9] K. Sirinukunwattana, S. E. A. Raza, Y. W. Tsang, D. R. J. Snead, I. A. Cree, and N. M. Rajpoot, “Locality
Sensitive Deep Learning for Detection and Classification of Nuclei in Routine Colon Cancer Histology Images,”
IEEE Trans. Med. Imaging, pp. 1–12, 2016.
[10] P. Jangbari and D. Patel, “Region of Interest Coding Techniques for Medical Image Compression,” Int. J. Comput. Appl., vol. 134, no. january, pp. 0975–8887, 2016.